The best design and planning projects seem to happen when communities can see and understand what shapes their world. From projects as small as a community’s city block to those as large as a suburban green field development, understanding infrastructure expansion isn’t always available to those who need it.
Visualizing planned growth of our built and natural world, such as stormwater system updates, land-use permits, and growth patterns, is essential for understanding and influencing how cities evolve. And yet, this information is often difficult, if not impossible, to access.
At Esri’s Geodesign Summit in 2025, Stantec showed how they used geographic information system (GIS) technology to transform the city’s Storm Drainage Master Plan into a digital, interactive resource showing what is possible when technical information is paired with thoughtful communication. Watch the recording of this presentation.
A Living Plan in Geographic Context
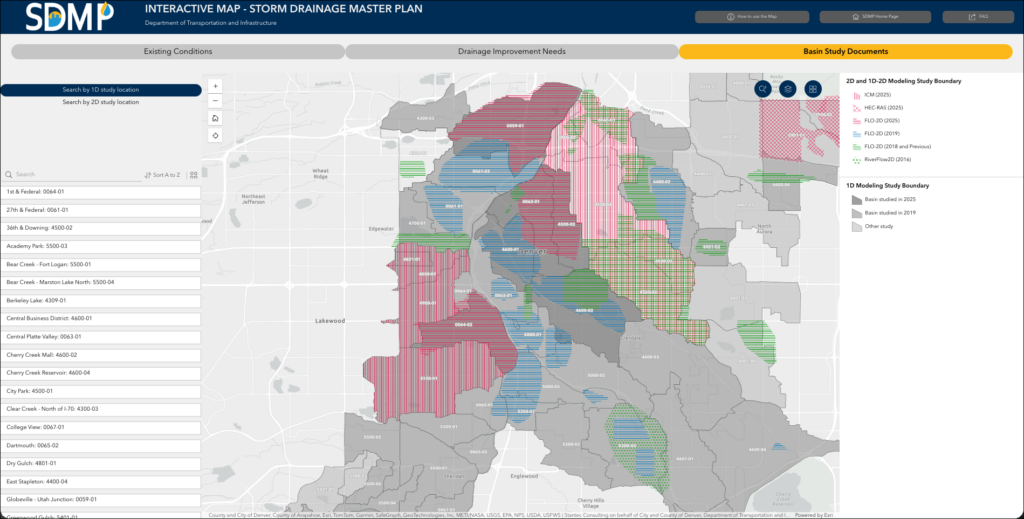
For years, Denver relied on a printed Storm Drainage Master Plan, an important but static document that guided infrastructure planning. As severe weather events grow more frequent and urban flooding becomes a more urgent concern, the city recognized that residents needed a better way to understand stormwater risks.
Stantec partnered with the Denver Department of Transportation and Infrastructure (DOTI) to reimagine the plan as an interactive online portal powered by ArcGIS Hub and ArcGIS Experience Builder.
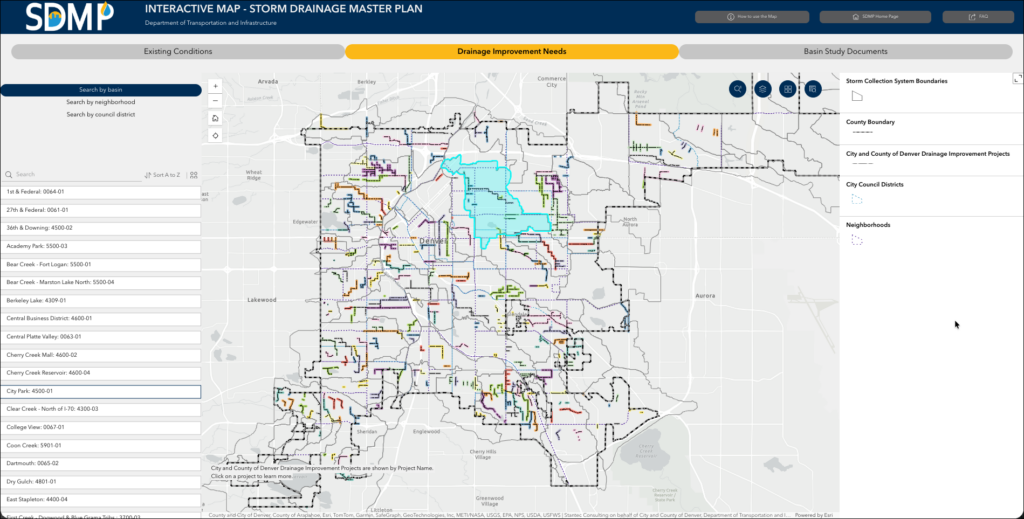
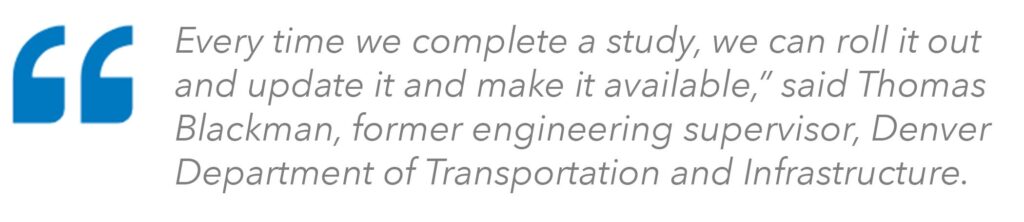
Instead of waiting for a major update every five years, staff can now refresh the information continuously, making it a living plan that adapts as conditions change.
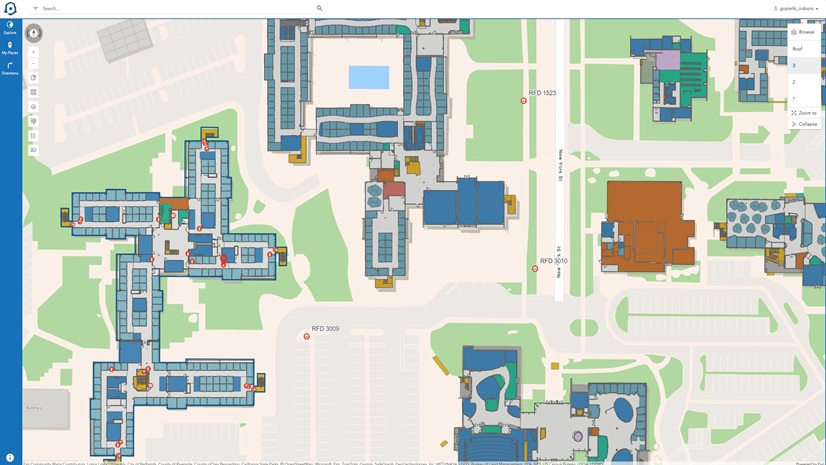
Stantec’s project team—including engineers Patrick Flynn and Erin Sturm—played a central role in translating complex hydrologic data into clear, approachable data sources. By leveraging geospatial technology, they helped DOTI create a single digital destination where residents, developers, and policymakers can explore stormwater information in context. Viewers can review localized flooding risks, evaluate infrastructure needs, and understand how stormwater systems relate to the broader urban environment. For a city experiencing rapid growth, this type of visibility is essential for informed and equitable planning.
Public participation improves design outcomes when people can see and understand the information guiding decisions. GIS makes that possible. Tools such as ArcGIS Hub, ArcGIS StoryMaps, and ArcGIS Experience Builder allow planning teams to combine narrative, visuals, and geospatial data into accessible formats that support meaningful engagement. By showing how systems interact above and below the surface, GIS lets collaboration happen between technical experts and the communities they’re working for.
Stantec’s work in Denver highlights the growing role of AEC firms in shaping how cities communicate with their residents. Public engagement maps, interactive visuals, and scenario-based communication tools create a shared understanding that can influence planning conversations for years to come. These tools also give design teams a more agile workflow by connecting geospatial data, analysis, and communication in a single environment. When communities have access to clear and timely spatial information, their input becomes more grounded and their participation more meaningful.
To explore more examples of how AEC firms use GIS, visit esri.com/aec.