Authored by: Andy Regalado, Enterprise GIS Manager, Eastern Municipal Water District
Eastern Municipal Water District (EMWD) is the water, wastewater, and recycled water service provider to nearly one million people living and working within a 682-square-mile service area in western Riverside County and northern San Diego County. It is California’s sixth-largest retail water agency and its mission is: “To deliver value to our diverse customers and the communities we serve by providing safe, reliable, economical, and environmentally sustainable water, wastewater, and recycled water services.”
EMWD has four active regional water reclamation plants that treat approximately 50 million gallons of wastewater each day. There are two water filtration and three groundwater desalination plants, which provide clean, high-quality, and reliable water to our communities.
Plant Mapping Business Needs
Plant data was absent from the GIS system with no compiled record of plant piping and facility installation details to aid in project planning and plant management. Much of the knowledge about the treatment and water filtration systems was not systematically documented and instead resided as institutional knowledge with the plant workforce.
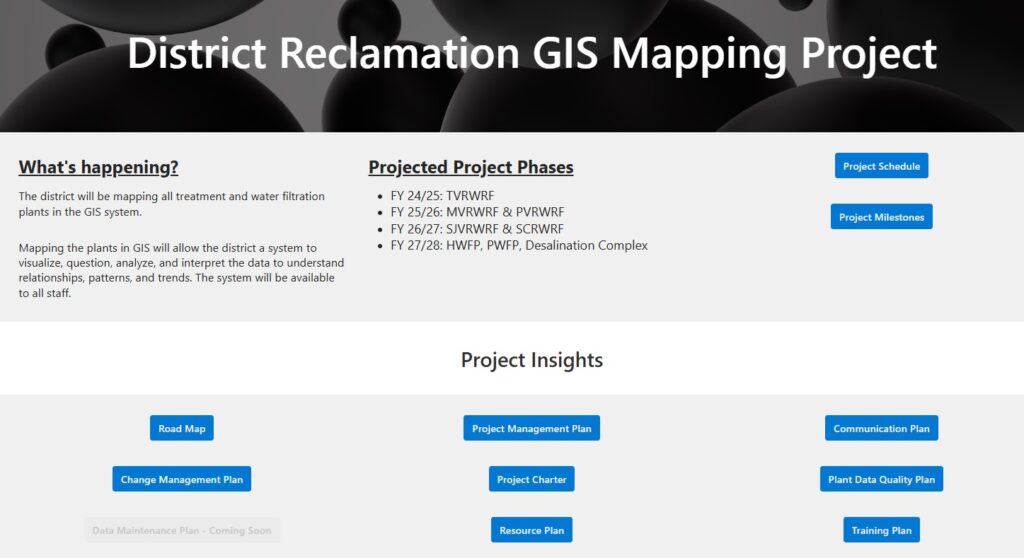
This created a perfect opportunity for GIS to assist. An initial pilot project was conducted to identify challenges and lessons learned. The pilot project was presented to the board and executive staff, focusing on goals, results, and lessons learned. The board agreed that the plant mapping project provides great value to our operational functions and approved moving the project forward. Since then, the entire Temecula Valley Regional Water Reclamation Facility has been mapped in GIS. The GIS team is now in the process of mapping the remaining plants. Mapping all the plants in the GIS system will take a number of years. A SharePoint hub site has been created to convey project details, documentation, and quick links to the GIS web-based application, PlantMapper.
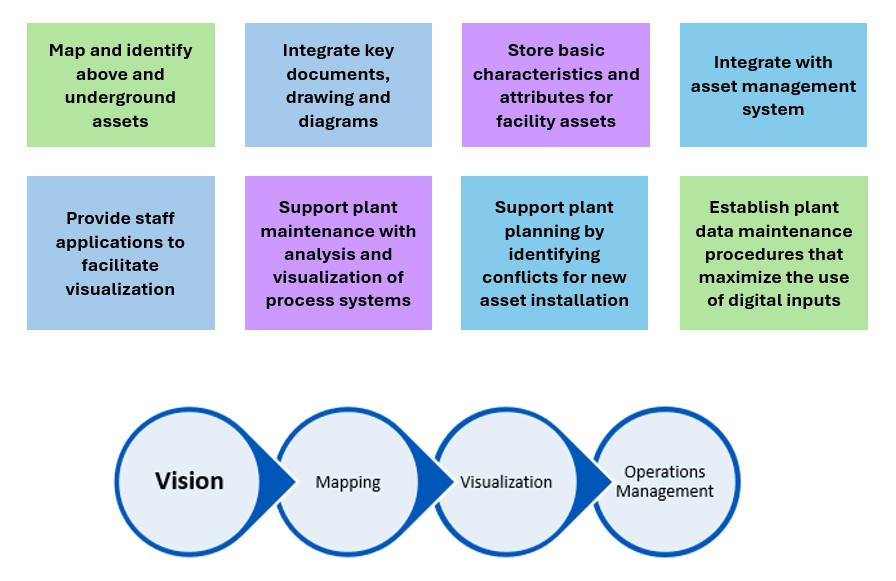
With this project, the business needs drive our goals. A robust road map and project plan were created to guide the project. Stakeholders from operations, engineering, and plant site staff were engaged early to help shape the project. Demos were provided by consultants showcasing 2D, 3D, digital twins, and virtual reality to begin discussions about what type of system the district could realistically maintain and benefit from. Next, we created a project charter and project management plan outlining our goal to create a system that included mapping and visualization capabilities to support plant operations management. We are a very large district, and we had to be realistic about what we could maintain in-house.
“Adding our plant facilities to our GIS system provides significant benefits to different stakeholders within our organization. From our engineering team utilizing the information to design rehabilitation and expansion projects, facilitating our field engineering team’s ability to know what type, size, and material of existing utilities are during construction, to our operations team being able to quickly identify locations for different systems and possible isolation points.” —Abdiel Picazo, Senior Engineer
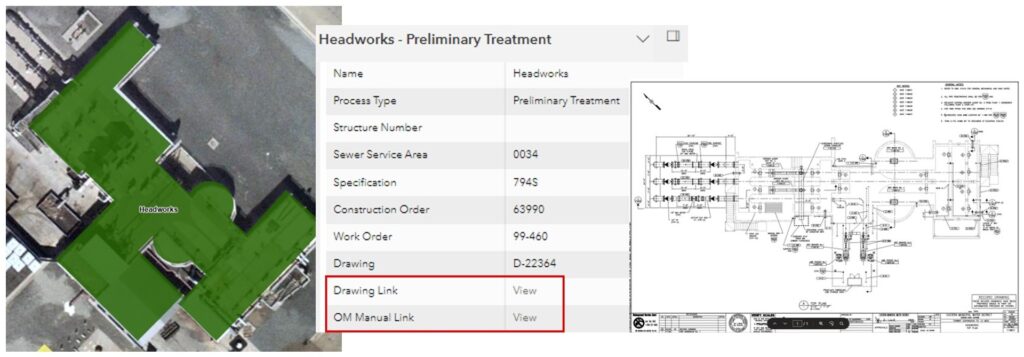
The number one request received from stakeholders was easy access to drawings, much like we have for all our other facilities in GIS. The simplicity of clicking on an asset and gaining access to drawings and operational manuals saves valuable time for our plant and engineering staff. Previously, staff needed to pull historic plans and overlay them in chronological order to locate and identify underground assets.
GIS Technology Utilized
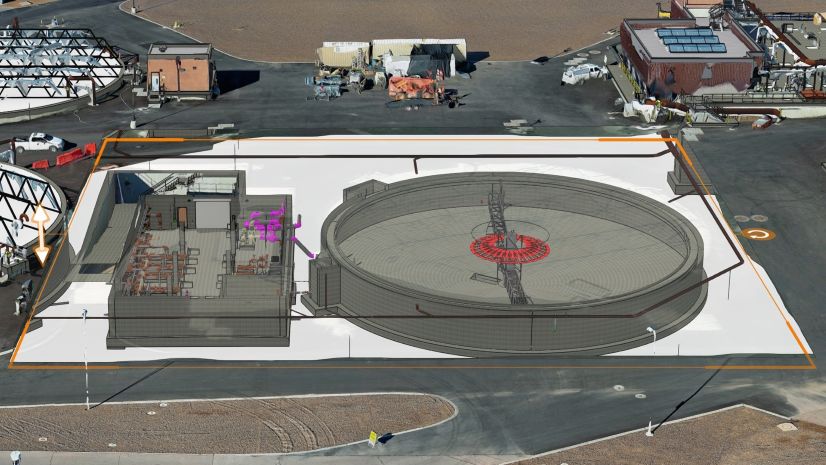
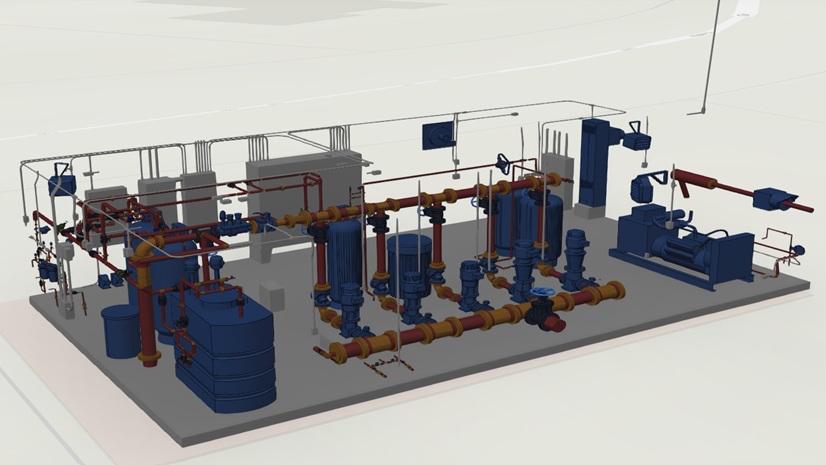
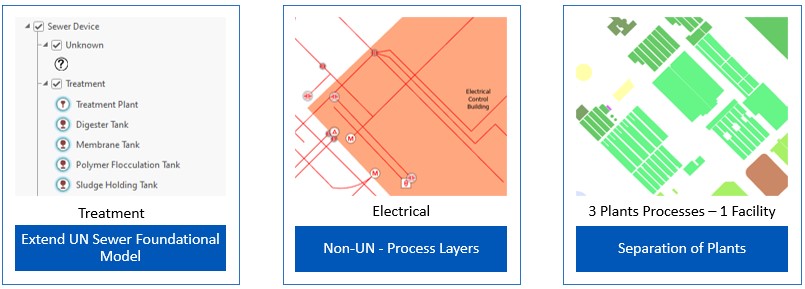
ArcGIS Utility Network was chosen as the data model to house the plant data. A custom model was created based on the Sewer Utility Network Foundation. Twenty-four new asset groups and 233 new asset types were added to the model. Our design goals were to model the gravity flow between structure polygons; extend the Sewer Utility Network Foundation; model treatment process vs. supporting processes; separate multiple plants within one facility; model structure boundaries with corresponding sewer devices as points of connectivity; and utilize associations to simplify complex arrangements.
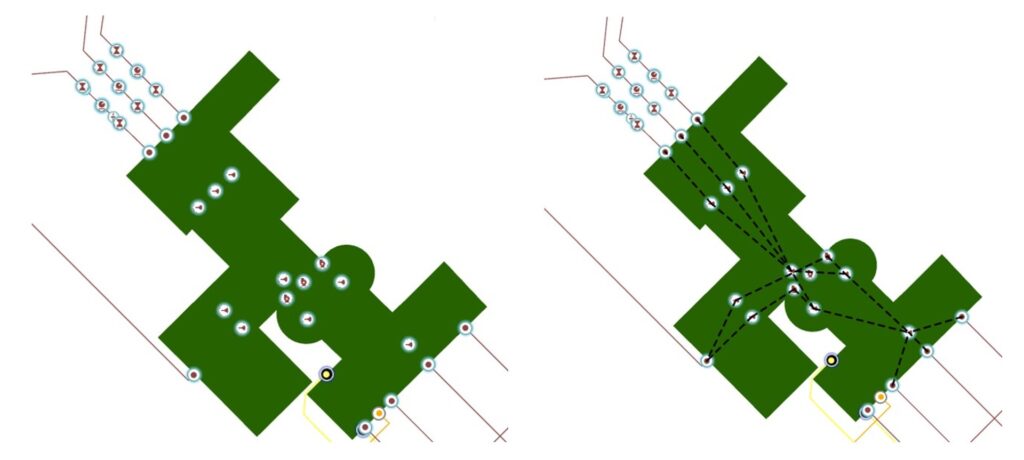
The use of utility network associations has been a big benefit within the plants. We are able to model connectivity and flow without mapping all the lines within a vertical asset. This simplifies the mapping process while still conveying flow for our users. It also declutters the map, as associations can be turned on and off with ease.
Mapping plants in GIS is a challenge. A workshop was conducted among the asset management team, engineering, and plant operations staff to agree on the hierarchy level to be mapped in GIS. EMWD initially migrated all data from the most complete AutoCAD (DWG) file into GIS. After the migration, topology cleanup was necessary because the data contained gaps and overlaps, but the migrated data still provided a solid AutoCAD-converted foundation. We knew we could not rely on the AutoCAD converted data completely. A thorough quality control process was done against each plan set to ensure all features were within GIS and that required attributes were captured. We also then cross-referenced the data against our asset management hierarchy and schematic drawings to ensure all facilities were present at the desired hierarchy level.
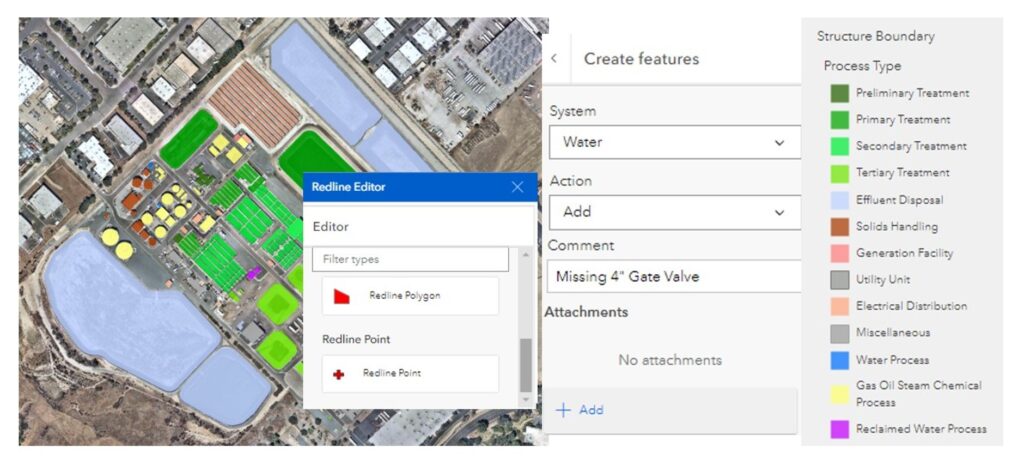
ArcGIS Experience Builder was utilized as the application platform to deliver data to district users. It gives flexibility in the future to customize an experience for each plant as needed. Plant staff are expected to be engaged as each plant is mapped to ensure their needs are met. A markup widget has been enabled to allow mobile staff to identify items that may need correction. It is understood that the initial drawings may not reflect current field conditions.
“GIS gives operators the ability to see beyond the surface—turning underground infrastructure into a visible, understandable system that improves training, planning, and day-to-day operations.” —Anthony P. Jimenez,Water Reclamation Shift Supervisor
Plant Mapping GIS Benefits–We Are Just Getting Started
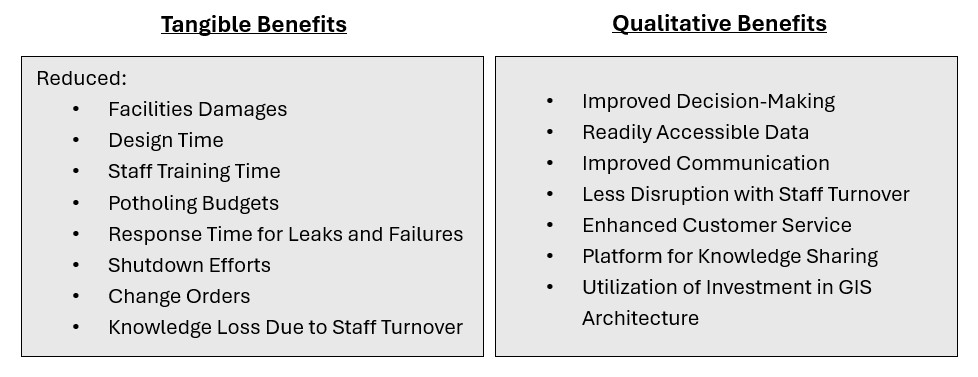
We have just launched our first plant in our GIS mapping viewer. Immediately upon release, we are already seeing benefits, such as reduced design time, decreased staff training requirements, and minimized knowledge loss from staff turnover. The complete benefits of having our plants mapped in GIS have yet to be realized. Looking ahead, we anticipate achieving much more, as we are only beginning our journey with GIS and plant management. Our next goal is to integrate with our asset management system (Maximo).
“The benefits of facilities and vertical asset management GIS tools extend across multiple disciplines. Treatment facilities are inherently complex, often housing thousands of assets and feet of piping installed over decades of various projects and expansions. Digitally integrating this data into a single tool provides immediate access to institutional knowledge, which improves operational and maintenance planning, engineering design, and contractor construction execution by providing contractors with verified infrastructure locations, reducing the risk of damages during construction.”—Ken Tagney,Director of Water Reclamation

Transform Facility Management with ArcGIS
ArcGIS empowers utilities to efficiently manage their facilities through a dependable system of record. It enables rapid asset mapping, data visualization in both 2D and 3D, streamlined maintenance planning, enhanced team collaboration, and seamless integration with other essential business systems. This comprehensive approach supports strategic, data-driven decision-making, boosts operational efficiency, and promotes the long-term sustainability of facilities.
Explore facility and vertical asset management solutions powered by ArcGIS
Subscribe to the Water Industry newsletter “Esri News for Water Utilities and Water Resources“
Follow #EsriWater on social media: X| LinkedIn