Nonprofits use maps to create positive change and
advance their mission.
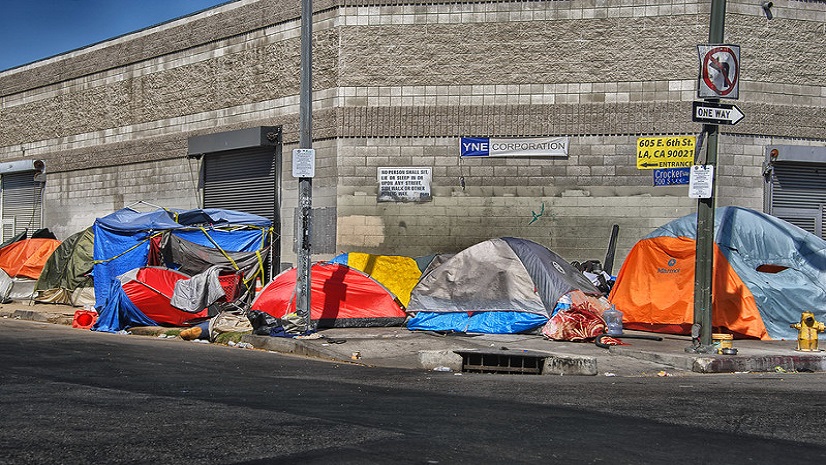
What is the issue a community is facing, where is it happening, who are the people involved, and what do on-the-ground conditions look like? These are the questions that nonprofits and mission-driven organizations working to create positive change need to understand. These are also the questions these organizations need to be able to show others to inspire them and get them onboard with their cause – whether it’s raising awareness and educating the public, inspiring citizens to take action, seeking support from donors, or advocating for change with policymakers and elected officials.
Maps provide an effective and compelling vehicle for change agents to further their mission. Maps make complex data understandable and inspire others to take action. And they are personal – communities can use maps to see where they live, work, and play, and better understand how economic, social, and environmental concerns intersect and what issues need to be addressed.
Democracy Labs, a not-for-profit organization founded in 2017, supports citizens and other nonprofits in democracy, activism, and community organizing. Co-founded by Deepak Puri and his wife, Shareen Punian, Democracy Labs applies innovative technology to social justice, voting rights, and environmental causes.
For example, Democracy Labs created the following map with the nonprofit Fatal Encounters.

The objectives of the map are to make it easier for people to get the facts on where encounters with the police in the United States have ended in fatalities and demand their elected officials support reform. It shows incidents of fatal encounters over time. Details about each encounter are overlaid with political districts, including who the congressional representatives and senators are for a given location. The map makes the information easily understandable and digestible, as well as searchable based on selected criteria.
“Maps are like sandwiches,” says Deepak Puri. “You can see all the layers together in a single entity that is greater than the sum of its parts and provides an integrated view of the context surrounding an incident.”

Multimedia Stories That Inform and Inspire
Nonprofits can also share maps in the form of StoryMaps: “StoryMaps are a wonderful way for nonprofits to create compelling stories to share their work and attract more support,” says Puri. StoryMaps tell a rich, multimedia story that combines maps, text, images and video. For example, in the StoryMap Cable hates Biden’s internet plan, interactive maps show the lack of internet access by county across the United States, as well as household income levels. A “swipe” map allows a side-by-side comparison that reveals a correlation between relatively higher and lower levels of internet access and income. With internet access tightly connected to access to jobs, resources, and critical information such as public health data, lower areas of access are disadvantaged and on the wrong side of the “digital divide.”


Multimedia content – such as news articles, videos, and White House fact sheets – further draws out these connections and also tracks how major internet providers are resisting government efforts to provide greater internet access to these communities.
The Wisdom of the Crowd
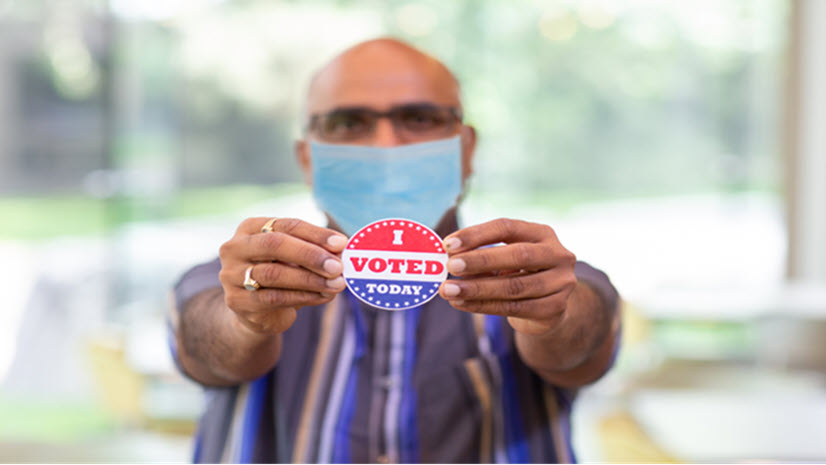
Another way to both advocate for a cause and closely engage the community is to build a crowdsourced map with data shared by the public. Democracy Labs created an app with a simple web form to help citizens report voter suppression incidents, which are then reported in the form of a dashboard and shared with the public, the media, and voting rights groups. “Think of it like an app for drivers to report traffic incidents, which then get reported in real time,” says Puri. Reported information includes location, time, the nature of the incident, and other details. The first app was built in 2018, called SeeSay 2018 (if you “see” something, “say” something), and in 2020, SeeSay 2020.


About Democracy Labs
For Democracy Labs, location-based data and maps provide a fundamental tool for understanding complex issues and conveying information that helps advance their own mission to create positive change around voting rights and other issues of social justice. They also provide pro bono assistance to other nonprofits focused on these same issues, and work with GIS volunteers. Other maps and StoryMaps created by Democracy Labs include:
- Opioid overdose crisis: Who made money from it? Who died?
- Denied broadband internet? How to challenge faulty FCC data that leaves you offline.
- Respect: Register. Vote. Organize. (StoryMap created for Women’s Voices Women Vote Action Fund)
About the Esri Nonprofit Program
The Esri Nonprofit Program provides low-cost access to GIS (geographic information system) software and resources. These resources include the tools used by Democracy Labs: ArcGIS StoryMaps for compelling, multimedia stories that leverage the power of maps (check out the Causes and Advocacy gallery!), and ArcGIS Survey 123 for a simple way to collect community data.