Authored by: Tyler DeBruin, GIS Utility Analyst, Town of Grand Chute
The Town of Grand Chute is located adjacent to the City of Appleton in Northeast Wisconsin. Grand Chute has a population of roughly 24,000 with a large regional commercial center. During a typical week, Grand Chute’s population more than doubles with people driving into the region for work. If nonworker visitors to the area are taken into consideration, the population nearly triples. The town nearest in population to Grand Chute doesn’t even eclipse 9,000 residents, which puts the town in a unique position when it comes to municipal services. The town has a full-time Police and Fire Department, along with a Public Works Department in charge of providing sanitary, water, and stormwater services. The Public Works Department also works very closely with our Community Development Department to provide comprehensive services to our residents and business owners.
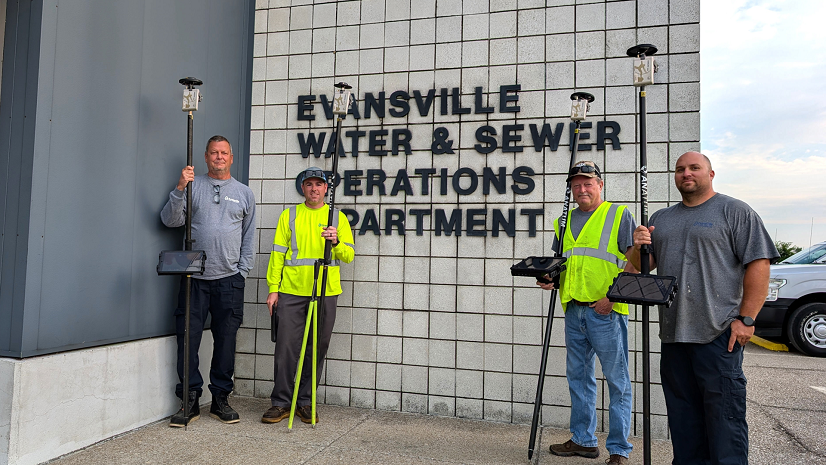
Town of Grand Chute Water Department Flowing into Esri
The Town of Grand Chute has a large municipal water service. With just under 10,000 services, it takes a dedicated team to manage this utility. In the past, much of the work done on the services was completed on paperwork sheets that would be filled out in the field. This would cause a lot of duplicate work and time when it came to state-required reporting at the end of the year along with cross-department coordination. Our water utility does so much more than simply provide water to residents—our water utility touches every department in the town. Having water so interwoven into the work of all departments made coordination a must. The town uses Esri as a conduit for coordination between departments, helping reduce the time commitment of our limited staff and cut back on duplication of work and human error.
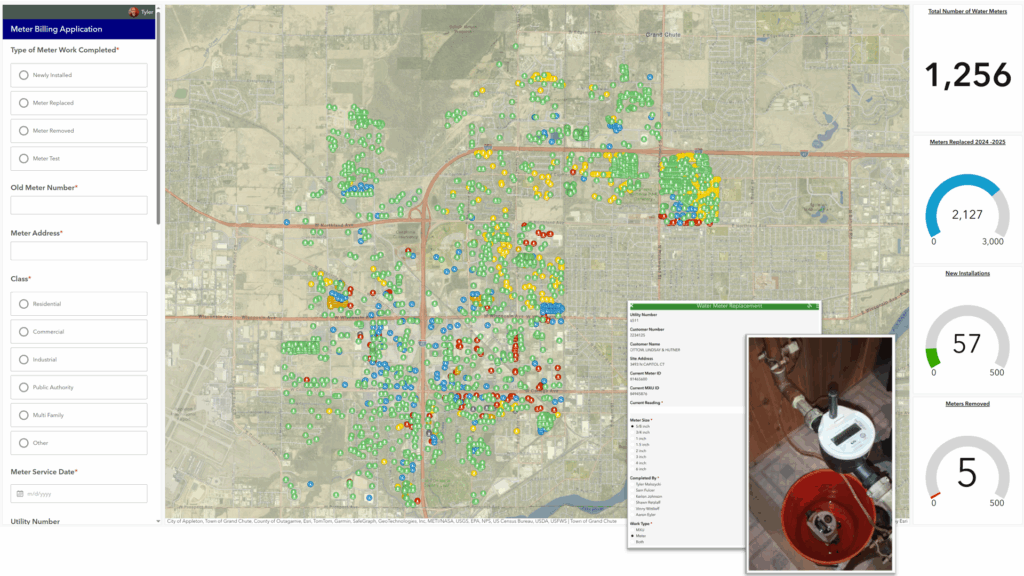
Water Meter Replacement Program
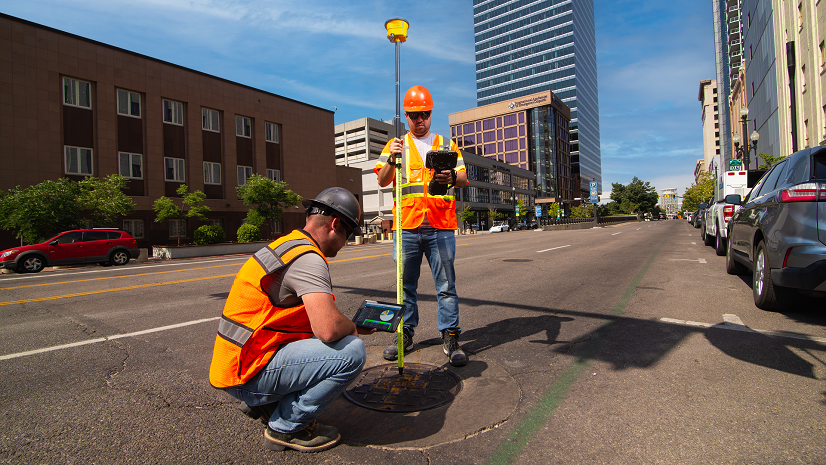
The Town of Grand Chute has six full-time employees that handle all water-related work. That includes, but is not limited to meter reading, utility locating, responding to main breaks, installation of assets, water quality testing, hydrant maintenance, etc. This requires us to work extremely efficiently as a group. This can become a challenge, especially when a larger project is being implemented. One such project is underway in the town: a water meter replacement project. This will require our staff to replace nearly 10,000 water meters within the next four years. This is already a large undertaking, given our staff cannot neglect their other responsibilities, but nearly impossible if staff relied on paperwork sheets like they did just a few short years ago. In the past, the town would use paperwork forms for water meter replacements. This caused a number of issues due to human error, missing forms, and location inaccuracies (due to condominium complexes having multiple addresses in a small area). Filling in the required information for the location accurately is important because this is used to update our billing software. This workflow is where the power of Esri comes in.

The town moved its entire water meter database from Microsoft Excel into ArcGIS Pro, joining properties based off their service address. A feature layer was created with ArcGIS Pro and shared to ArcGIS Online, so all staff had one central mapping resource of water meter information that could be reviewed. It also gave each meter a spatial reference, so instead of reading off a large list of addresses, staff could simply search for an address and see the location on a map. We then used ArcGIS Survey123 to create a short survey mobile workers could fill out when they replaced a meter, along with an associated report that would be sent to our billing staff. We connected ArcGIS Online and ArcGIS Survey123 with dynamic hyperlinks, so essential data would be prepopulated in the survey, cutting the required questions in half. Webhooks were then used so when a survey was submitted, it sent an automated report email from our mobile staff to our office staff, cutting back even more on our overall time commitment. After a survey was submitted, a related table was utilized so the symbology would automatically update, making tracking completed locations effortless. The combination of Esri products helped us nearly eliminate all human error and has helped us replace over 2,000 meters in the past year so far. Without the ArcGIS software-based workflow, we would have had to hire a contractor to do the work, which would have cost much more than doing the work in-house.
Water Cross-Connection Tracking
Because water meter replacements took less time with the new workflow, staff are also able to conduct cross-connection inspections during scheduled meter replacement appointments. Our Community Development Department requires these inspections, so the time saved is easily doubled by including this additional inspection. Water cross-connections are required every 10 years at residential properties, and every two years for commercial properties (with some exceptions). Like water meter replacements, in the past, the town would use paper documentation to try and track these inspections. This came with a number of issues, as it was hard to organize inspection forms to the varied inspection frequencies and track locations out of compliance. Again, the town turned to Esri!
We linked our water meter replacement application with our water cross-connection application in ArcGIS Online. Mobile staff would access these maps with the ArcGIS Field Maps application and have the ability to mark down when they conducted a water cross-connection inspection. This would prompt one additional question in Survey123 and link back to our water. We used webhooks again to help send automated reports and documentation to Community Development staff. Using ArcGIS helped turn one appointment for a water meter into a streamlined process that knocked out two appointments in one. It also helped save our residents money. In the past, they would have to hire a private plumber for the inspection, which would range anywhere from $100 to $200 per inspection.
Fire Department Pre-Incident Solution
Water meter replacements also have a connection to our Fire Department pre-incident mapping and inspections. Many of the water meter locations are in areas called out during pre-incident mapping. General water access throughout a property is also an important factor when it comes to both of these projects. In the past, our Fire Department has used paper tracking that would be input manually into another software provider. This, however, lacked a connection to our larger interconnected network that was powered by ArcGIS.
The town implemented numerous solutions for our Fire Department, including the Pre-Incident Planning Solution provided by Esri. This gave us a head start on implementation and helped us link all our emergency services solutions back to our water department. Within our pre-incident inspections, we linked documentation for required inspections using ArcGIS Online and Survey123. Now, for example, when a fire suppression system is inspected, or private fire hydrants are inspected, we can link this information back to our water department. This helps to ensure private water networks connected to our public system are working properly and helps account for non-metered water, which is a requirement of our yearly reporting.
Capital Improvement Planning for Water
The expansion of our water utility is also another important factor to consider when looking at our network as a whole. How many new services can we expect in the next 10 years? How many more miles of mains will we install? How many more public hydrants will be installed? These are extremely important questions that will have a profound effect on the work we previously discussed. These questions are linked to capital improvement planning (CIP). In the past, we’d simply have tables listed in our budget when it came to our CIP projects. This would be an issue because it was hard to pick specific projects and give them a spatial reference. Many of these projects would list a total project cost, but there were numerous other factors that needed to be considered. That is when the town once again turned to Esri.
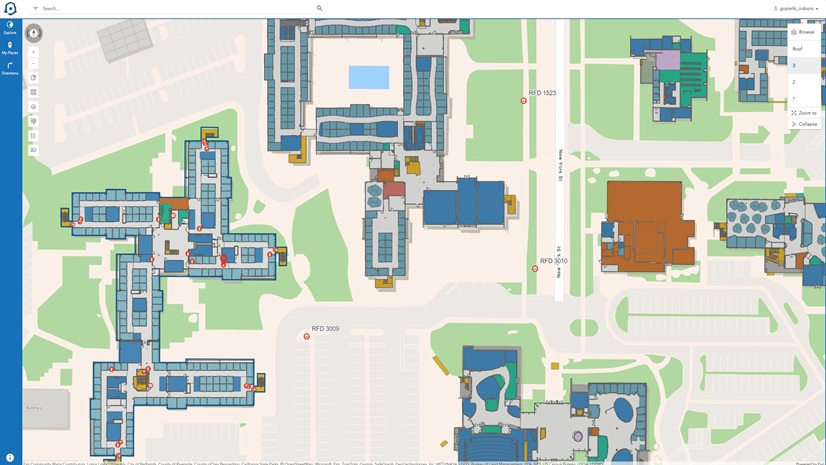
Using ArcGIS Pro, we created a historical database of CIP projects. We then published the data to ArcGIS Online to create a variety of dashboards, story maps, and other applications. Using ArcGIS Online, we were able to filter out water utility projects and analyze how much our water utility has grown over the years. Using this information in conjunction with our developable land database, the town can accurately predict how many meters, mains, hydrants, and inspections will be required in the next 10–20 years. It is also a very helpful tool for public engagement, allowing residents and property owners to prepare for future water utility installation.
Water Loss Tracker
Much of the work performed by town staff is related to water loss. Whether it is indirect, like flushing a private hydrant or direct in the sense of a water main break, calculating water loss is very complicated. In the past, the town would simply estimate water loss after a water main break was called in. This wouldn’t account for fire suppression systems, hydrant flushing, private water main breaks, and other incidents that cause water loss, making it so water loss was underreported or missed totally. It also didn’t have a spatial aspect. What if we are consistently having water main breaks in one segment of the town? Is that area of the town in the CIP for a future water main replacement? These are common questions staff would ask and needed a tool to easily analyze and track this.
ArcGIS is the perfect tool to track water loss. We used ArcGIS Pro to create a very basic database to track water main breaks and other miscellaneous water loss. This was then published to ArcGIS Online, and a dashboard was set up for town staff and elected officials for review. Not only did we log direct water loss into this database by submitting a survey through Survey123, but we also linked indirect water loss from some of the above-mentioned workflows. We automatically link water loss associated with a private water hydrant inspection back to the dashboard as well. This is an ever-evolving dashboard. As we add more tracking programs, we are able to feed more data into the dashboard. The ultimate goal is to utilize ArcGIS to account for 100 percent of our water loss.
Looking into the Future
The town has a very integrated and well-run water department when it comes to using Esri’s products. Looking into the future, the town is going to make more connections between departments. We would like to include CCTV and cleaning in the dashboards, mapping applications, and water programs the town manages. We would like to link video inspections to the sanitary main in GIS, as well as track how much water is used when performing inspections. During illicit discharge inspections, we would like to automatically flag when we detect potable water within our stormwater system. This data would be linked to our water loss tracking application, helping us account for potable water that has leaked from a break into our groundwater.
Not only are we looking into cross-departmental linkages using GIS but also interdepartmental. Expanding inspection information to our water department and site development plans can help save our staff time and resources. For example, when mobile staff are working on lateral inspections, we could link this to our water loss tracking dashboard. There are a variety of tools and solutions Esri provides. They are always growing and evolving, and the town will grow with Esri!
“GIS has completely transformed how we manage and deliver water utility services in Grand Chute. Esri’s tools have streamlined everything from water meter replacements to water loss tracking, allowing our team to work more accurately and efficiently. What once required paperwork and manual coordination now happens in real time with greater accuracy and transparency. GIS has empowered our small team to deliver better service to residents while saving time and taxpayer dollars.” —Jordan Jolma, Town of Grand Chute, Director of Public Works
About the Author
Tyler DeBruin is the GIS Utility Analyst for the Town of Grand Chute. He has over 12 years of experience in GIS and local/regional government. He is very involved in the GIS community of Wisconsin, serving on the Board of Directors for the Wisconsin Land Information Association. He regularly teaches workshops and educational sessions at statewide conferences. As a resident and employee of the Town of Grand Chute, he enjoys making a positive impact on his community to help make Grand Chute grand.
Stay Connected with Esri’s Water Team
ArcGIS is an extensive information system that enables modernization of workflows with easy-to-use applications. Strengthen your organization with GIS-based solutions that will increase efficiency and provide insight for decision-makers. Visit the Esri Water Utilities web site for more information.
Join the Water Utilities Community
Follow #EsriWater on social media: X | LinkedIn
Subscribe to the Water Industry newsletter “Esri News for Water Utilities and Water Resources“