Skip to Content

Market Analysis and Customer Insights

Accelerate business growth

Person looking at a laptop screen, map with orange dots

Create location-based market development strategy

Gain a competitive edge and greater market share with location intelligence that can accelerate business growth. Unify market development plans, drive expansion strategies, and increase customer spending. Optimize dealer and sales territories and deliver compelling brand stories. ArcGIS unites disparate data into a single view with maps that help staff uncover hidden potential that drives marketing strategy. Unlock the best opportunities for new sales growth and increased brand loyalty through forward-looking customer insight.

Enrich and refresh market analysis and customer insights

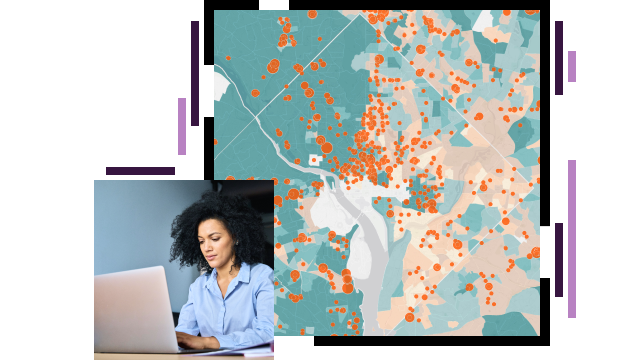
Visualize markets and customers

Quickly generate smart and interactive maps that show where current and potential customers are located and the stores and distribution centers that serve them. In a single view, visualize customer data combined with market demographics and competitive intelligence to discover where opportunities exist for higher revenue and improved conversion.

Dark gray map with blue lines and green dots

Deliver insights—local to global

Monitor market behaviors and shifts automatically to quickly adjust to changing conditions. Advance marketing strategy, maximize sales opportunities, and minimize risks from underperforming markets. Access over 15,000 global market variables for customer analytics, content creation, and integrated business planning—demographics, psychographics, consumer spending by category, and seasonality.

Map with green, cream, and brown parcels

Understand behaviors and relationships

Maximize lift and loyalty. Location-based technology unlocks customer relationship management (CRM) tools with a spatial key. Find where and when the best customers are shopping, and what they are buying by category, location, and channel. Understand where they work and play. Connect and map the influencer network, promotors, and agents that seed more business through relationships.

More on consumer spending data
Dashboard with Tapestry Segmentation data including charts and a map

Set territory expectations as demand shifts

Engage social media and automate content marketing through real-time human movement data that correlates with high potential zones. Execute scenario planning, territory development, and integrated business planning to optimize resources. Adjust service or production based on disruption, workload, performance, strategic accounts, and developing pipeline.

More on territory planning
Map with orange, red, and purple polygons

Predict market potential and product demand

Discover untapped potential and project overall market demand for products or services in any geography. Drive targeted marketing efforts through geospatial analysis of sales data and the latest consumer spending data. Combine that analysis with population movement, growth trends, and household spending data to predict revenues by localized markets given similarities in demographics and market size.

More on market potential data
Dark gray map with large green area and multi-colored dots

Improve dealer network performance

Set expectations, capacity, and product or service mix to achieve the full sales potential in each dealer's territory. View key performance indicators in the context of a territory's demographic, behavioral, and buying power characteristics and forecast revenue potential. Detect trends and identify target audiences to help dealers generate leads and outperform the competition.

Map of the United States with blue dots and lines

INDUSTRY BLOG

Location intelligence—Catalyst for growth in 2022

The gap between companies that are winning and the ones that aren't starts with customer engagement.

Read the blog post

Products

Previous
Next

Contact sales

Connect with the Manufacturing Team