Skip to Content

Supply Chain Visualization and Analysis

Gain real-time awareness

Achieve a responsive and transparent supply chain

Global disruptions, market pressures, and workforce continuity are affecting the cost and flow of goods and raw materials in real time and for the long term. At the same time, customer and business partner expectations of global supply chain traceability and supply chain visualization are growing. With ArcGIS, supply chain managers can mitigate disruptions, address resilience challenges, and provide supply chain transparency while delivering on time to increase customer trust and profitability with improved product visibility.

Gain a competitive advantage with your supply chain

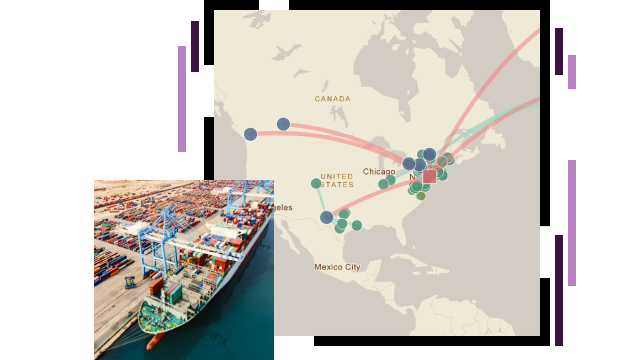
Visualize fixed and moving assets

Set up the digital foundation of supply chain traceability with a supply network map. Proactively adjust to real-time market conditions and disruptions through supply chain visualization of fixed and mobile assets and transportation hubs. Use location intelligence to achieve the benefits of supply chain transparency for risk mitigation, optimal service delivery, compliance, and long-term sustainable development.

Map of the world with multicolored dots

Detect disruptions before they can happen

Gain supply chain visibility in real time and space. See and quantify disruptions and live shipment tracking to understand proximity of raw material shipments, suppliers, and customers. Integrate location-based technology and shared data with control tower and transportation management systems to view real-time operations dashboards and improve product availability and delivery.

Map of the world with lines

Trace for transparency and scenario planning

Visualize and trace supply chain maps upstream and downstream and understand the relationship to potential disruption or sustainability risk. Uncover hidden costs while adding visibility and data to cost-to-serve analyses. Assess viability due to market restrictions, transportation requirements, regulations compliance, and tax and trade implications.

Map of the world centered on Asia with green lines

Track and report sustainable sourcing

Advance branding and build product confidence and credibility through supply chain transparency. Map the supply chain worldwide and tell engaging mapcentric stories of responsible sourcing and community development. Visualize and measure areas of interest around the world to benchmark environmental and social metrics. Address, prioritize, and set forward-looking, meaningful goals in the places that matter most to support business resilience, sustainability, and equality.

Dashboard with map and metrics

Gain insight before the negotiation

Use spatial analysis to balance costs, resources, and opportunities in supply chain operations expansion. Evaluate and score site suitability by analyzing data ranging from natural resource availability to workforce operational needs, logistics potential, environmental regulations, operational costs, and safety or natural disaster risk.

Supply network map

Optimize flow of goods

Prescribe future plans and optimization using geospatial analysis to compare data across space and time and expose unseen patterns, threats, and opportunities. Assess metrics and workflows, planned versus actual, for continuous process improvement at scale internally and externally with supply chain transparency.

Map of New York City with data shown in 3D

WHERENEXT

Distributing beer and industry-changing innovation

The third-largest beverage distributor in the US used creative thinking and geospatial technology to shake up the distribution industry.

Read the article

Products

Previous
Next

Contact sales

Connect with the Manufacturing Team