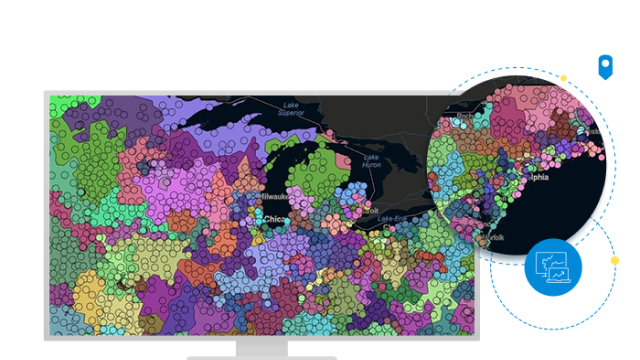
This four-step process shows the detail of information Address Coder quickly and easily adds to address records:
Step One: Data Address RecordData address records are stored in files. For this example, each data address record should consist of a name, complete street address, city, state, and ZIP Code. Post Office boxes identify the location of the person's local post office, not the person's physical residence. You can see that Joe's basic address record does not provide any information about him except that he's a male and lives on Main Street in Anytown, CA.
Step Two: GeocodingThis process adds detail to Joe's address information by assigning a latitude-longitude coordinate to his address record. Codes such as state, county, census tract, block group, and block are geographic boundaries used by industries and governments for all state, county, and federal surveys, analyses, and evaluations. A block is a 15-digit code that represents an area the size of a city block. However, in more rural areas, this geographic area may be larger. The block is the smallest level of geography for which the Census Bureau tabulates data that is collected during a decennial census. When the geocode is added, Joe's address record looks like the illustration below and indicates his physical location.
Step Three: Demographic DataAfter Joe's record was geocoded with latitude, longitude, and census geography codes, demographic data can be added to reveal even more about "who" he is based on the profile of his neighborhood. Esri's Updated Demographics variables, such as age, income, housing type, gender, race, and family type, help more fully describe the types of people who live in an area. As you can see in the example below, adding demographic data such as the current year population (POP_CY) and the total number of households (HH_CY) provides information that analysts can use to learn more about residents and the size of their neighborhoods. This additional data shows that in Joe's neighborhood, there are 1,348 people who live in 752 households.
Step Four: Tapestry SegmentationFor an additional perspective about the types of people who live in an area, a Tapestry Segmentation code can be appended to each address record. Esri's Tapestry Segmentation system combines the who of lifestyle demography with the where of local neighborhood geography to create a model of various lifestyle classifications, or segments, of actual neighborhoods into distinctive behavioral market segments. This example shows the addition of a Tapestry Segmentation code added to Joe's address record.
Now we know that Joe's neighborhood is described as Tapestry segment 08: Laptops and Lattes. Below is the description of Laptops and Lattes neighborhoods. Look at all the information that marketers, direct mail managers, fund-raisers, and others, can use to target this audience for the best results.
Tapestry Segment 08: Laptops and Lattes: Eligible and unencumbered by homeownership and children, residents of Laptops and Lattes neighborhoods are single, affluent, and still renting. The median age is 38.5 years. They are highly educated, professional, and partial to big-city life, preferring major metropolitan areas such as New York, Los Angeles, San Francisco, Boston, and Chicago. Tech-savvy, this is the top group to own a laptop or notebook PC; they go online daily, especially to shop. Their favorite department store, by far, is Banana Republic. They go to movies, rock concerts, shows, museums, and nightclubs. They exercise regularly and take vitamins. They practice yoga, jog, ski, read, watch foreign films on video or DVD, eat out, and travel abroad. They tend to be liberal and work for environmental causes.