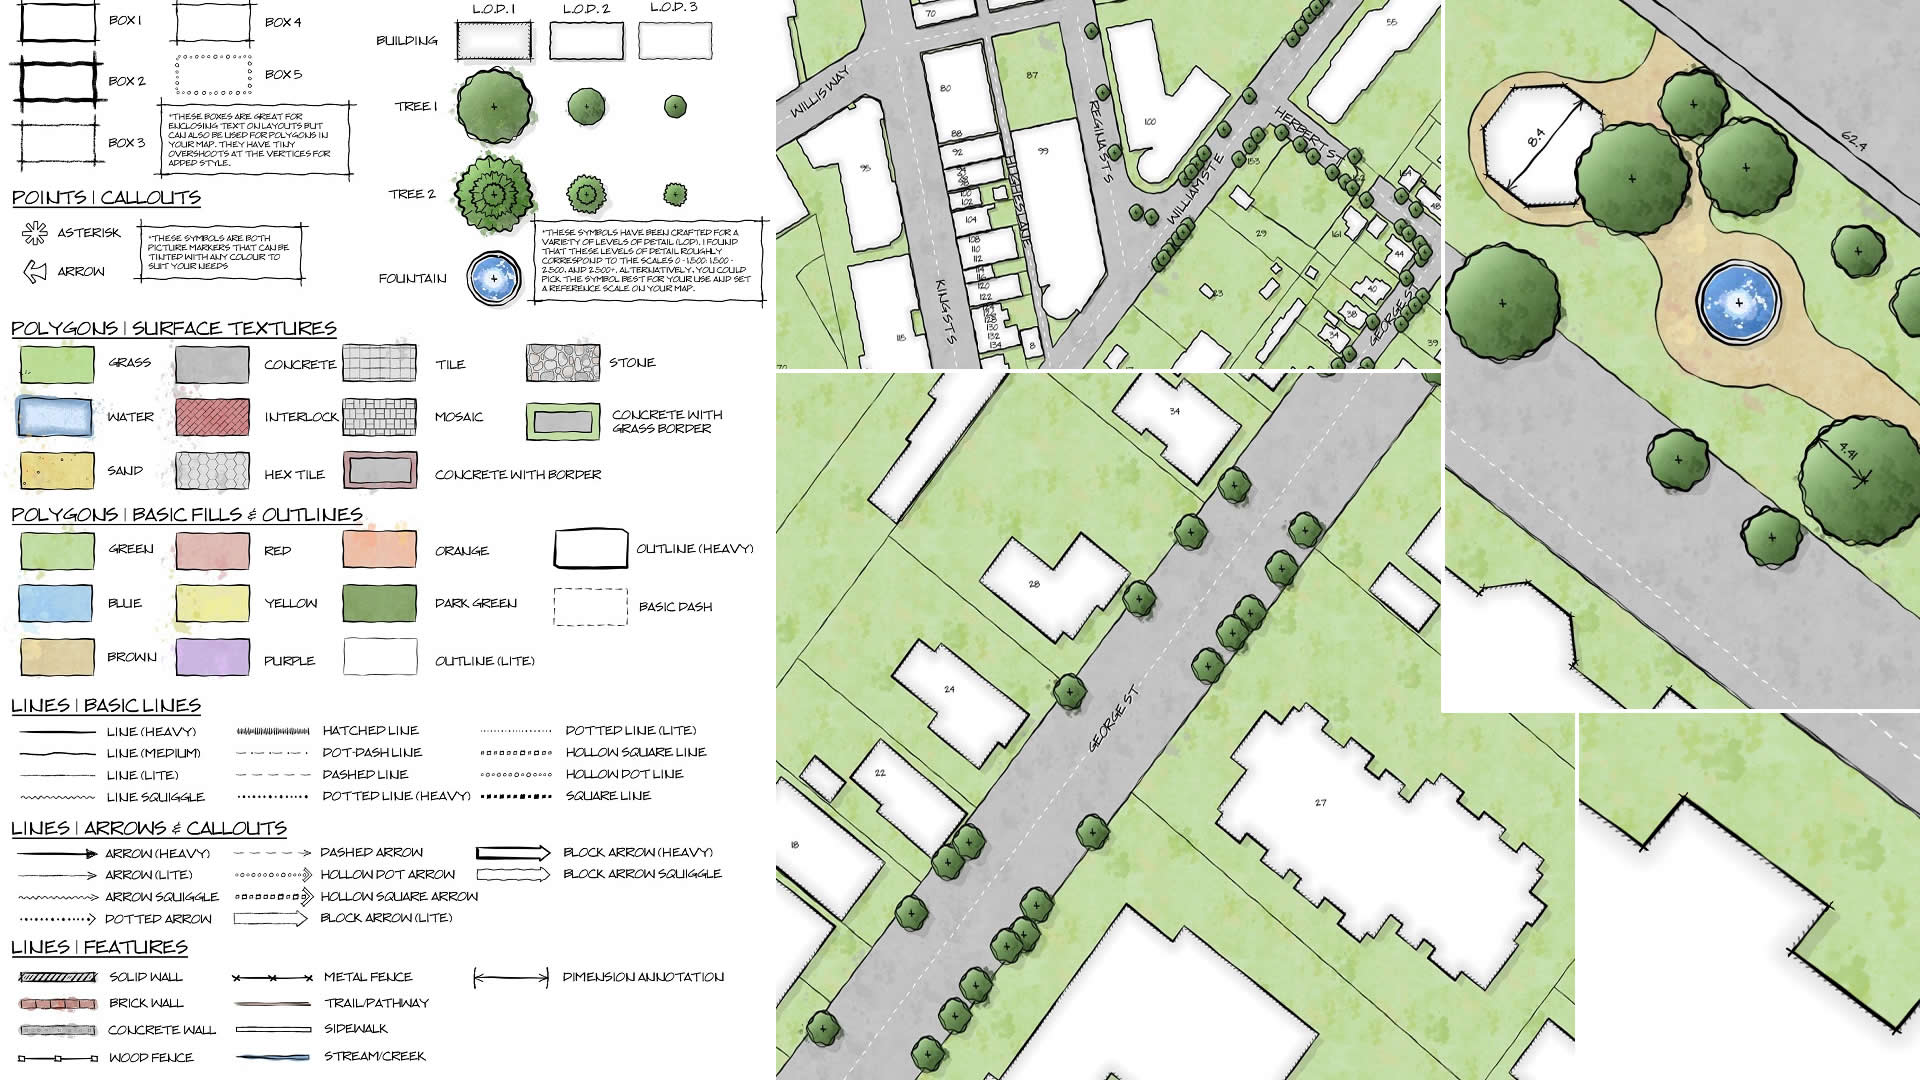
Stylish Landscapes
GIS analyst Warren Davison of Ontario, Canada, created Draft Sketch, a very artistic n ArcGIS Pro style for landscape design and site planning.
GIS analyst Warren Davison of Ontario, Canada, created Draft Sketch, a very artistic n ArcGIS Pro style for landscape design and site planning.
Learn to use the erase geoprocessing tool in ArcGIS Pro and data from ArcGIS Living Atlas of the World to make a map of your area of interest.
Esri technology evangelist Bern Szukalski shows you how to build your first web experience with ArcGIS Experience Builder.
When you create a new map using ArcGIS Online, you can choose which basemap you want from the basemap gallery.
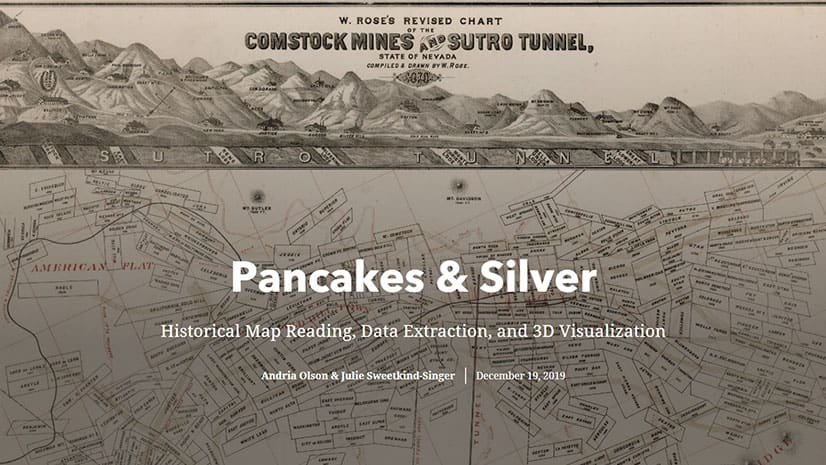
Stanford University Libraries won the grand prize in the Esri 2019 StoryMapper of the Year competition.
Dublin Airport is turning into a digitally smart organization, using location technology from Esri for inspections, indoor mapping, and more.
See how graphic elements such as icons and illustrations create a unified look and feel to your story map reinforce your organization's brand.
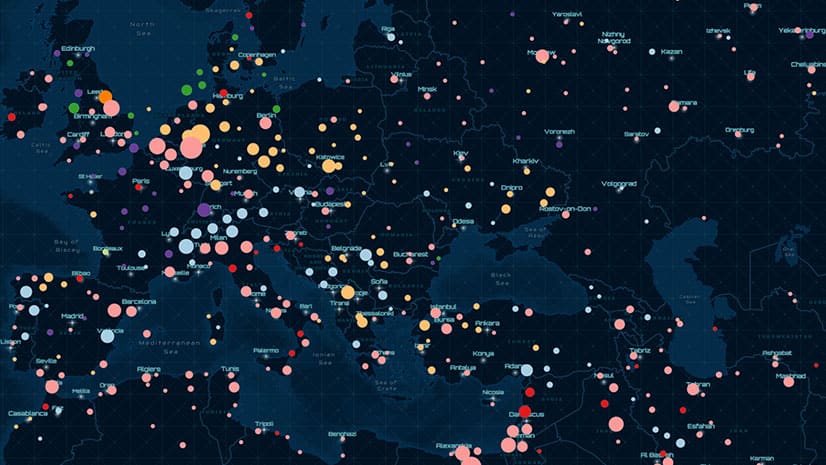
Point clustering is now available in beta in ArcGIS API for JavaScript. See how clustering works when mapping earthquakes.
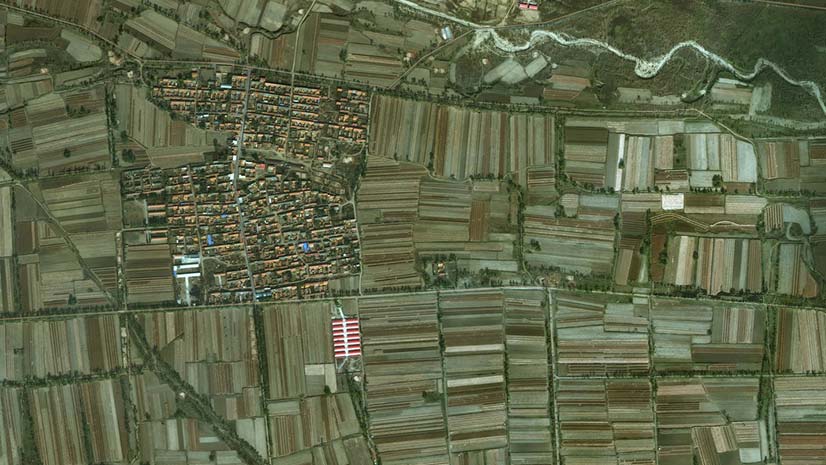
Do you need to extract information from imagery collected by a satellite or a UAV? Check out a course called Imagery Analysis in ArcGIS Pro.
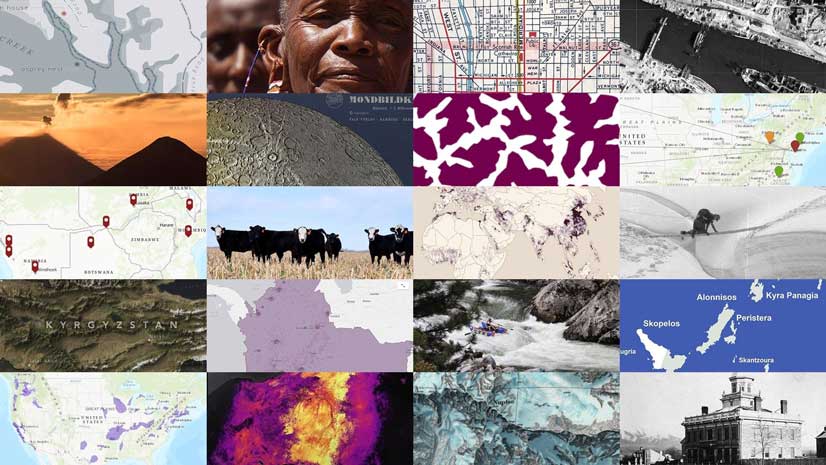
More than 1.1 million story maps live on ArcGIS Online. Here are a few favorites from 2019.
ArcGIS Pro now includes new data analysis capabilities, three new map projections, tools for making chart symbology, and more.
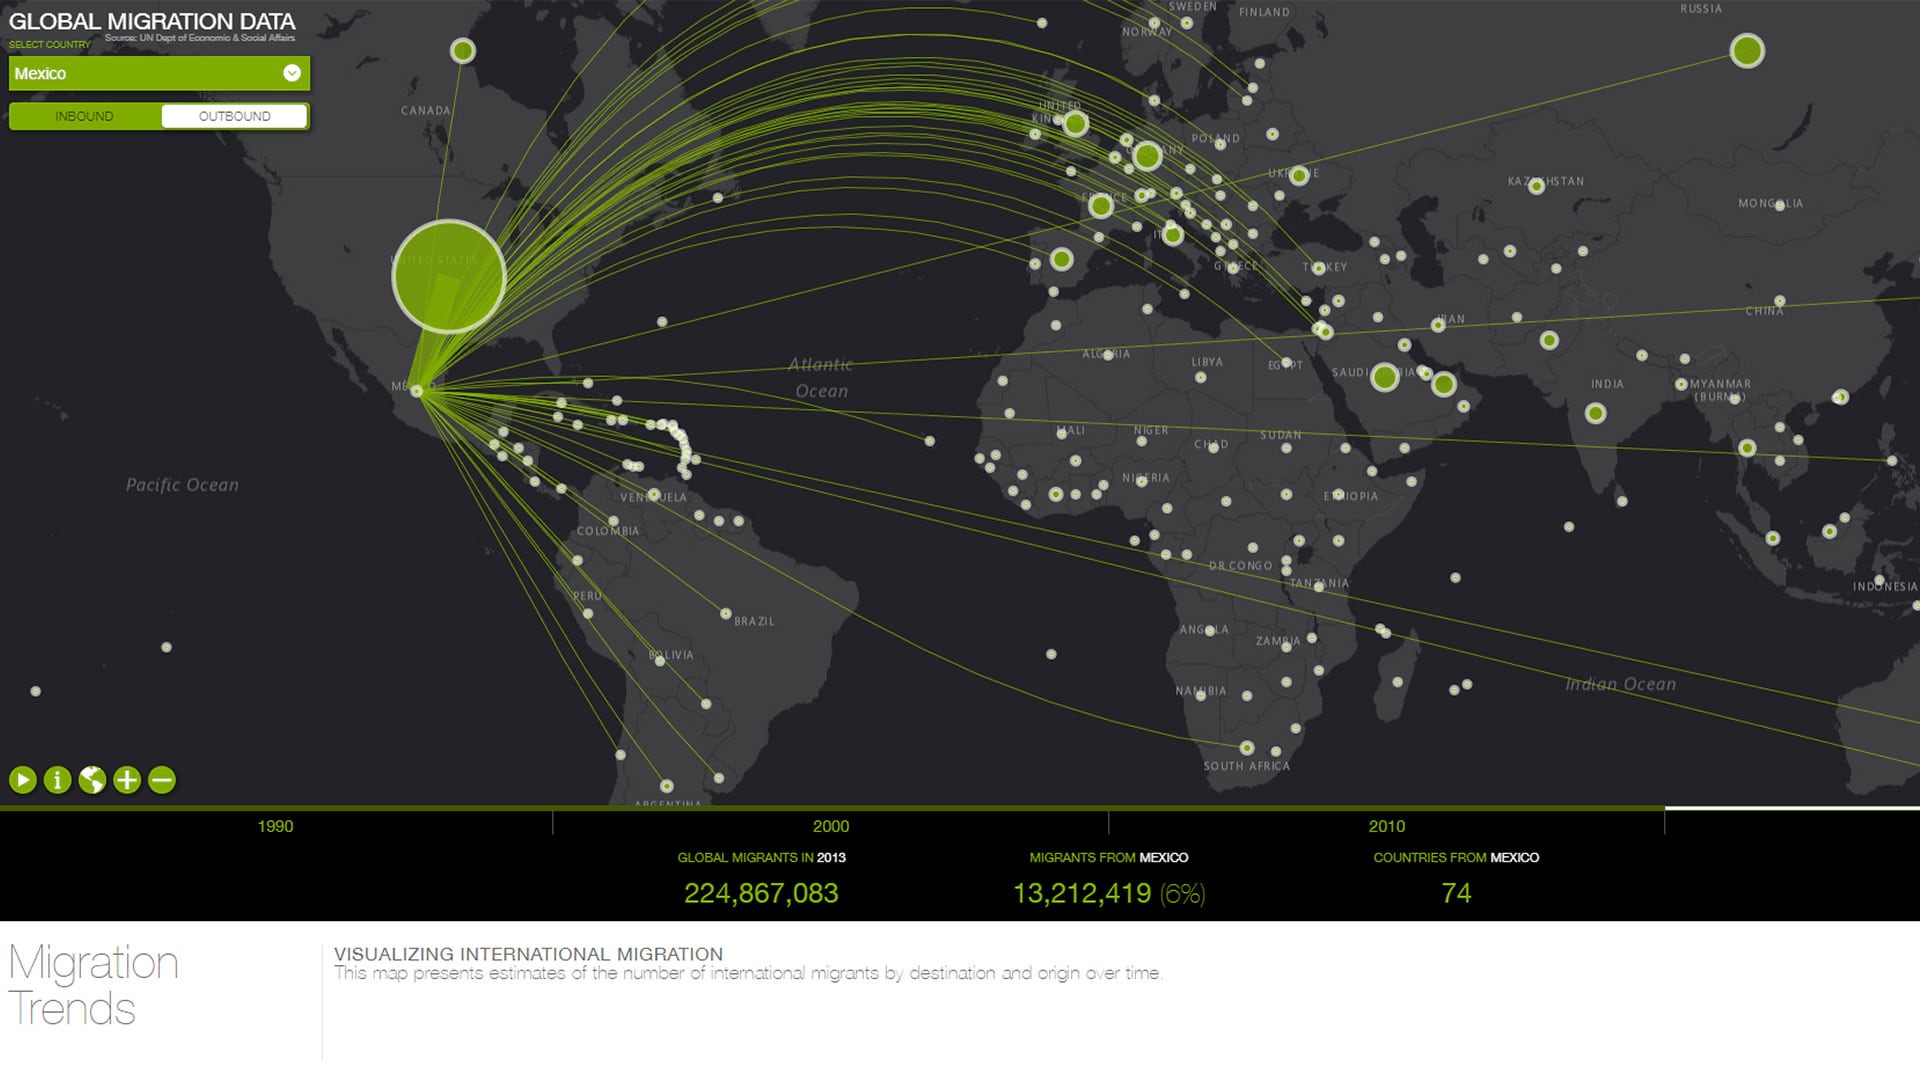
ArcGIS Online and ArcGIS Living Atlas of the World provide cloud-based tools and content that make it easy to analyze spatial demographic data.