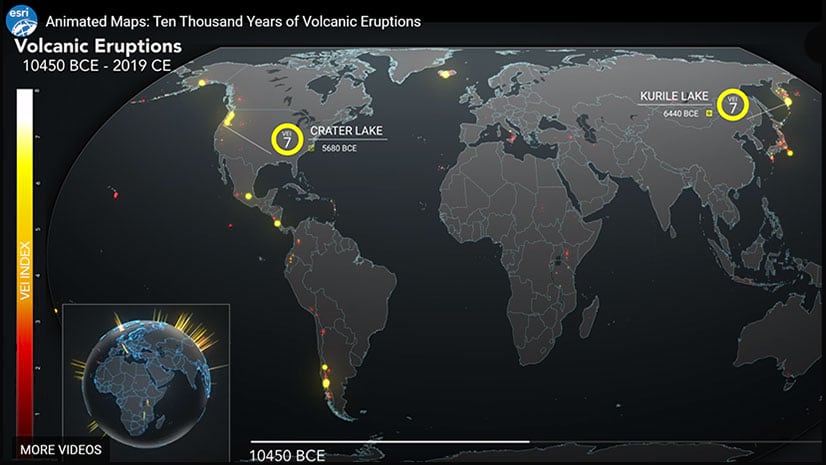
View Volcanic Eruptions Over 10,000 Years
Esri created an animated map that groups volcanic eruptions over the last 10,000 years using the volcanic explosivity index (VEI).
Esri created an animated map that groups volcanic eruptions over the last 10,000 years using the volcanic explosivity index (VEI).
Map Viewer beta includes a new layout for authoring maps and more pop-up configuration capabilities, printing layouts, and smart mapping tools.
When creating thumbnails for items in ArcGIS Online, you can go beyond the basics and establish a unique style or brand. Here's how.
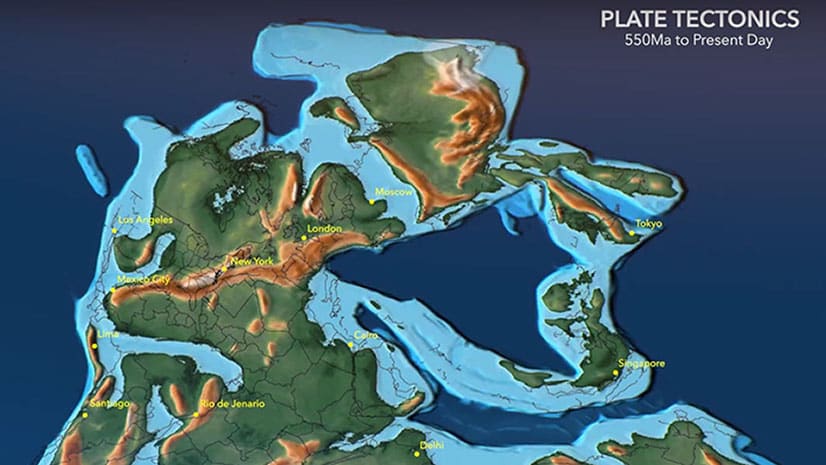
Go back 542 million years to see how the earth’s tectonic plates have moved using this animated map created, in part, using ArcGIS Pro.
Want to spotlight a specific geographic area of interest in your map? Create a vignette with the Overlay Fade style for ArcGIS Pro.
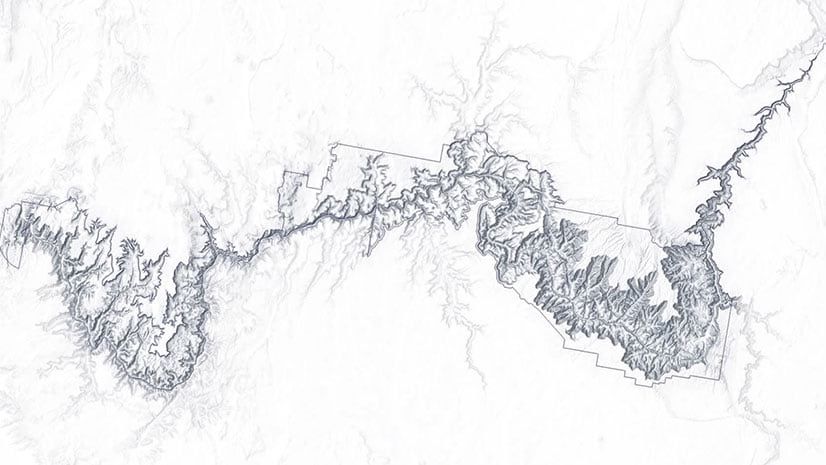
In this one-minute map hack, Esri cartographer John Nelson teaches you how to use ArcGIS Pro make a line map made up of labels.
Protected area managers in Africa are taking storytelling and photography training, including lessons in how to use ArcGIS StoryMaps apps.
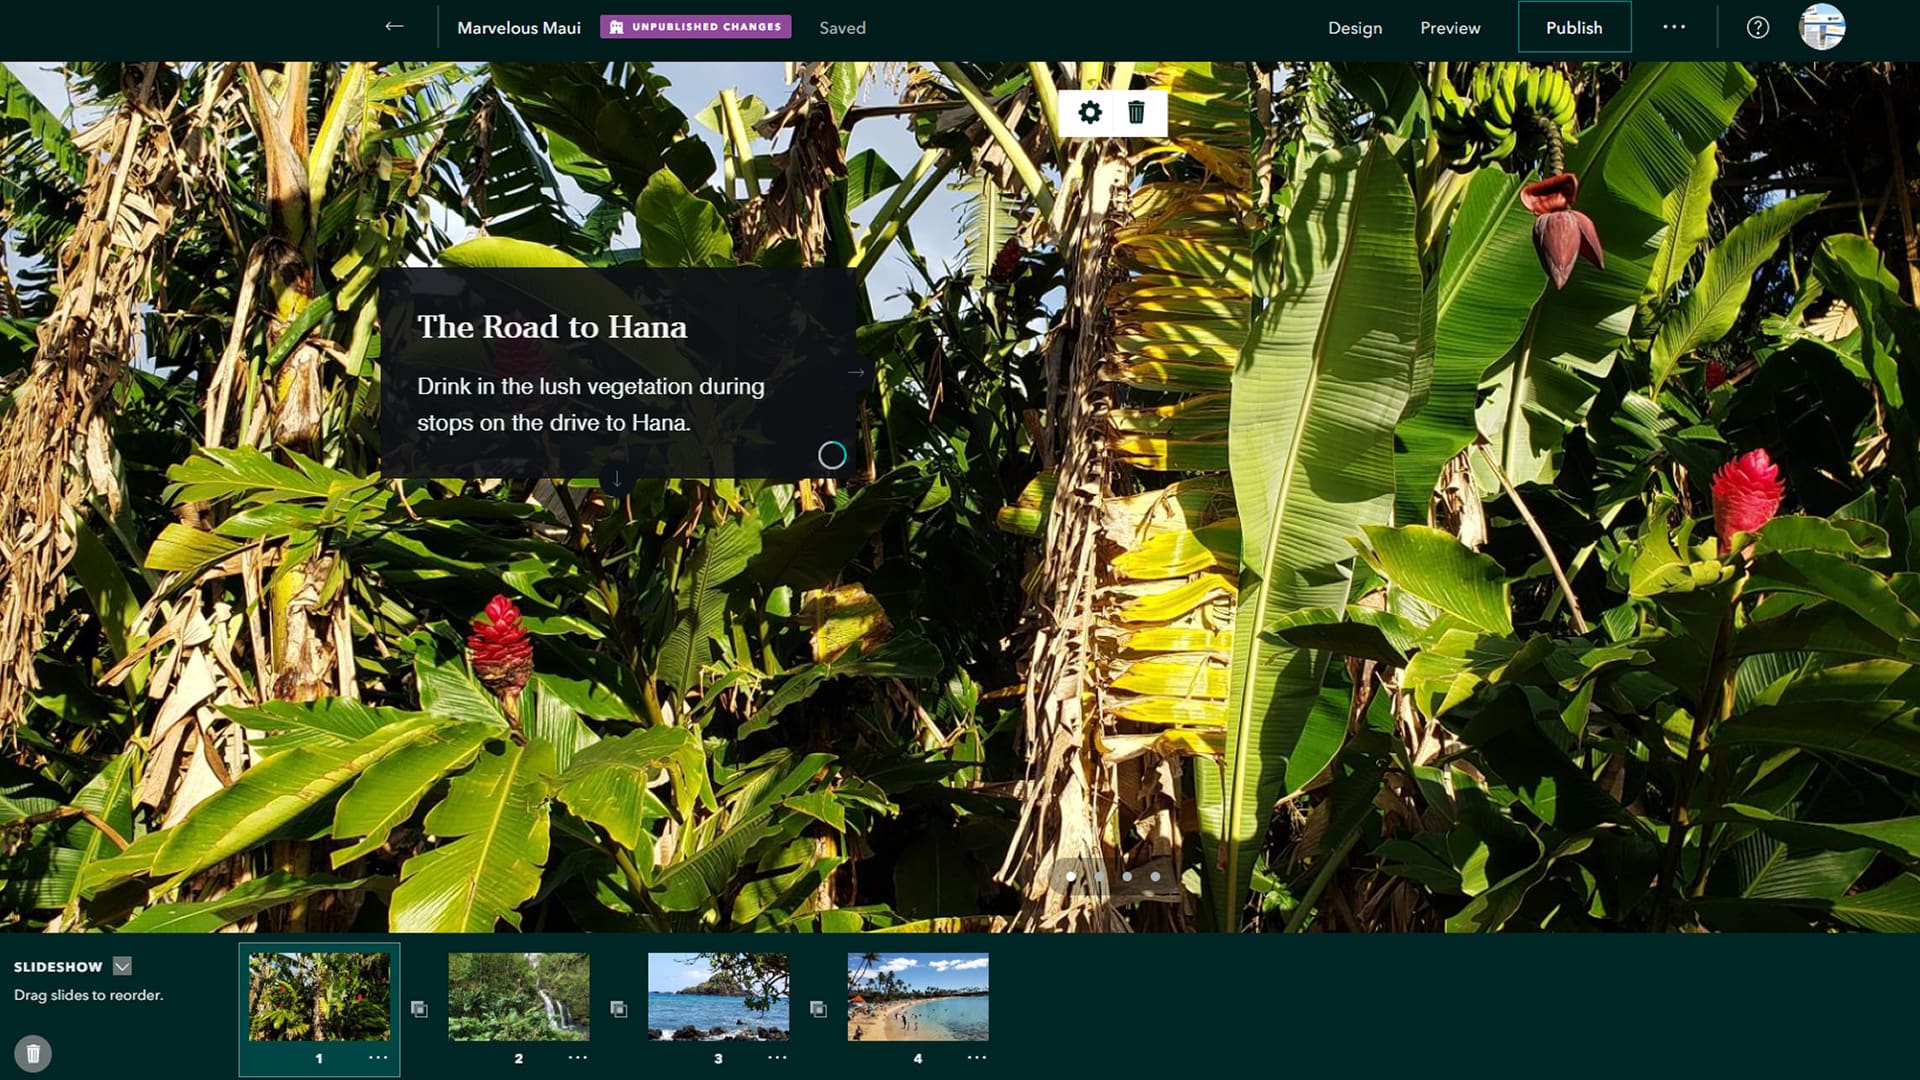
Design, tell, and display your stories more creatively with the new ArcGIS StoryMaps app tools such as slideshow, collections, and autoplay.
A story map by Cooper Thomas of Esri delves into where our planet's seven billion people live and their impact on the land, sea, and air.
What GIS apps do fire agencies need to plan for and respond to incidents and then analyze performance?
The US Census Bureau used GIS to develop a web mapping app that identifies areas with households typically hard to count during the census.
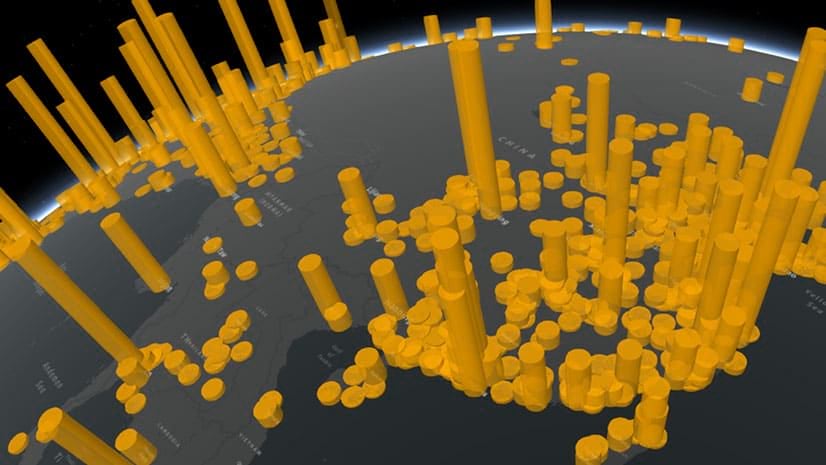
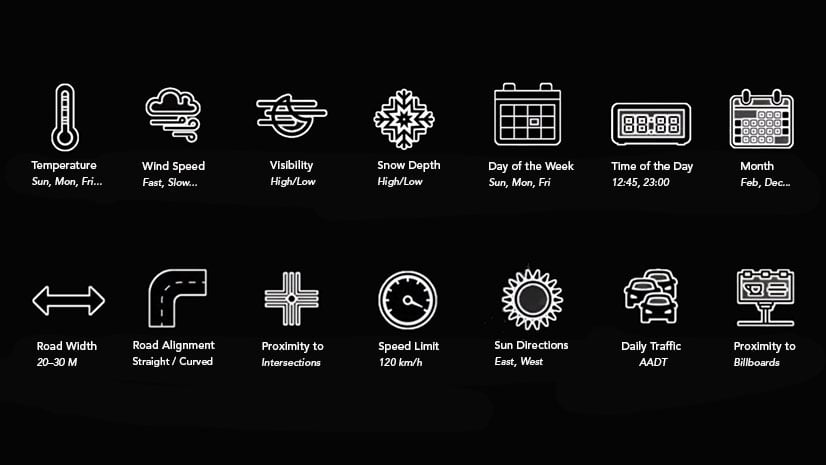
Omar Maher from Esri shows how ArcGIS and Microsoft Azure Machine Learning tools can predict the probability of traffic accidents.