Visualize Your Data with Dots
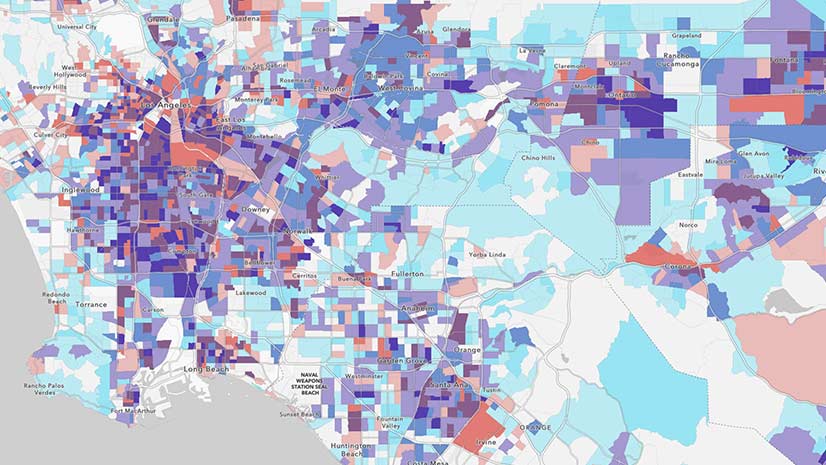
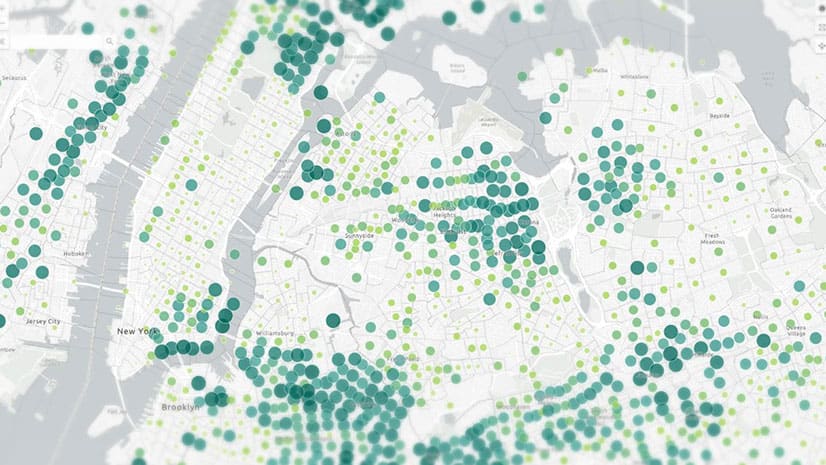
Create maps that represent individuals, houses, or anything else you can count, with the dot density mapping style in the Map Viewer beta.
Create maps that represent individuals, houses, or anything else you can count, with the dot density mapping style in the Map Viewer beta.
The GIS community’s phenomenal work supporting the response to the COVID-19 pandemic is showcased in a new ArcGIS StoryMaps app.
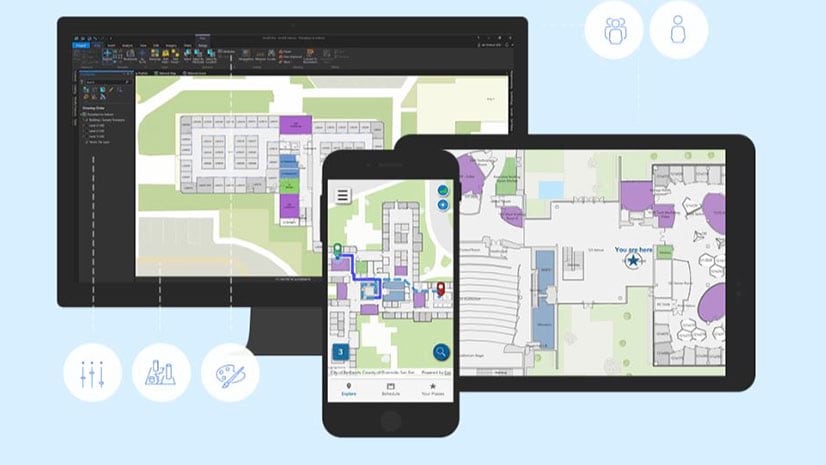
Esri product engineer Jason Hine explains the app development basics for ArcGIS Indoors, Esri’s indoors mapping system.
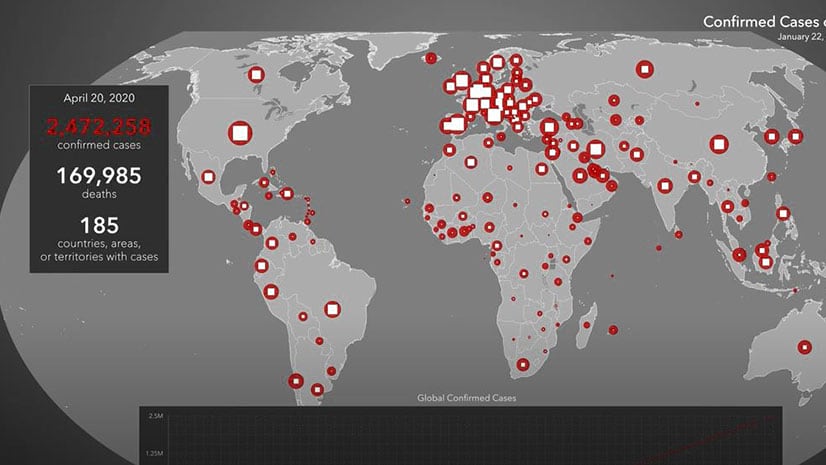
ArcGIS Pro and Adobe After Effects were used to create this animated map of the spread of COVID-19 from January 22-April 20, 2020.
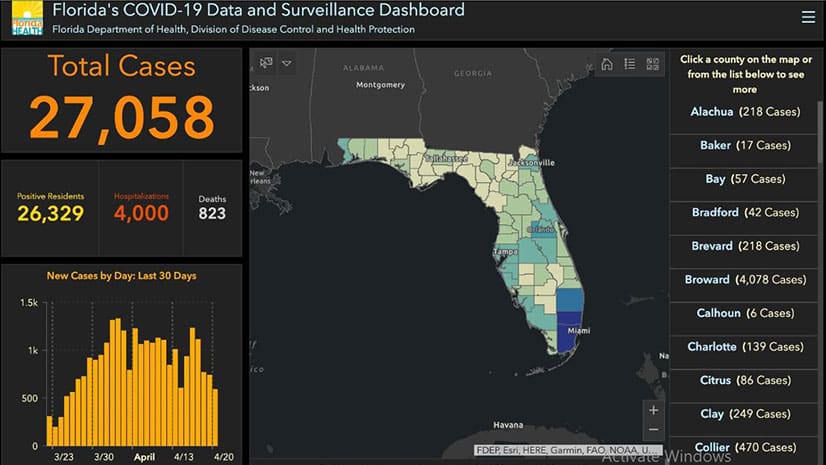
Jim Herries, principal product engineer for cartography at Esri, shares cartographic tips for improving your organization’s COVID-19 case maps.
Esri technology evangelist Bern Szukalski offers several tips on how to properly find and use images in your stories.
Learn about the indoor location technologies such as Bluetooth Low Energy (BLE) beacons are or soon will be supported by ArcGIS Indoors.
Four new layers in ArcGIS Living Atlas of the World contain American Community Survey (ACS) data about children and senior citizens.
A pole and street sign inventory demonstration shows you the ease of switching from paper to digital workflows with ArcGIS.
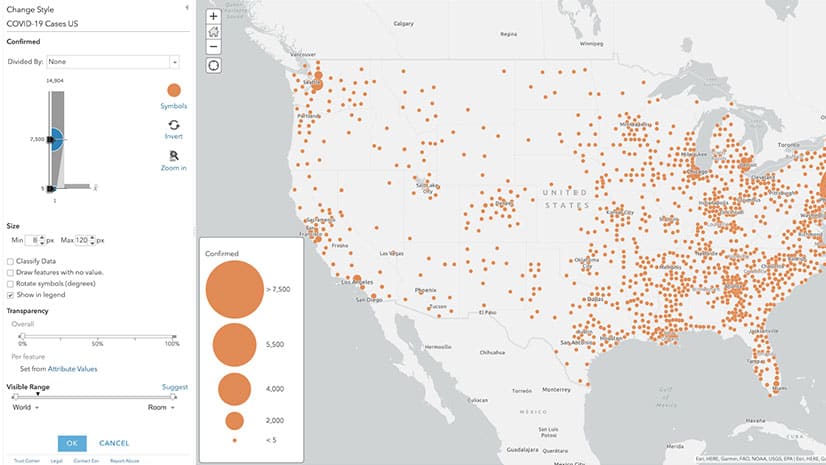
Esri cartographer John Nelson shows you how to apply graduated sizes and colors to symbols in your ArcGIS Online maps.
Get a two-minute overview of Scene Viewer in ArcGIS Online, which gives you the ability to visualize and analyze 2D and 3D information.
The Esri Developer Summit focused on new capabilities in ArcGIS including those in 3D mapping, natural language processing, and data science.