
February 26, 2019 |
Ben Conklin | Public Safety
June 23, 2020
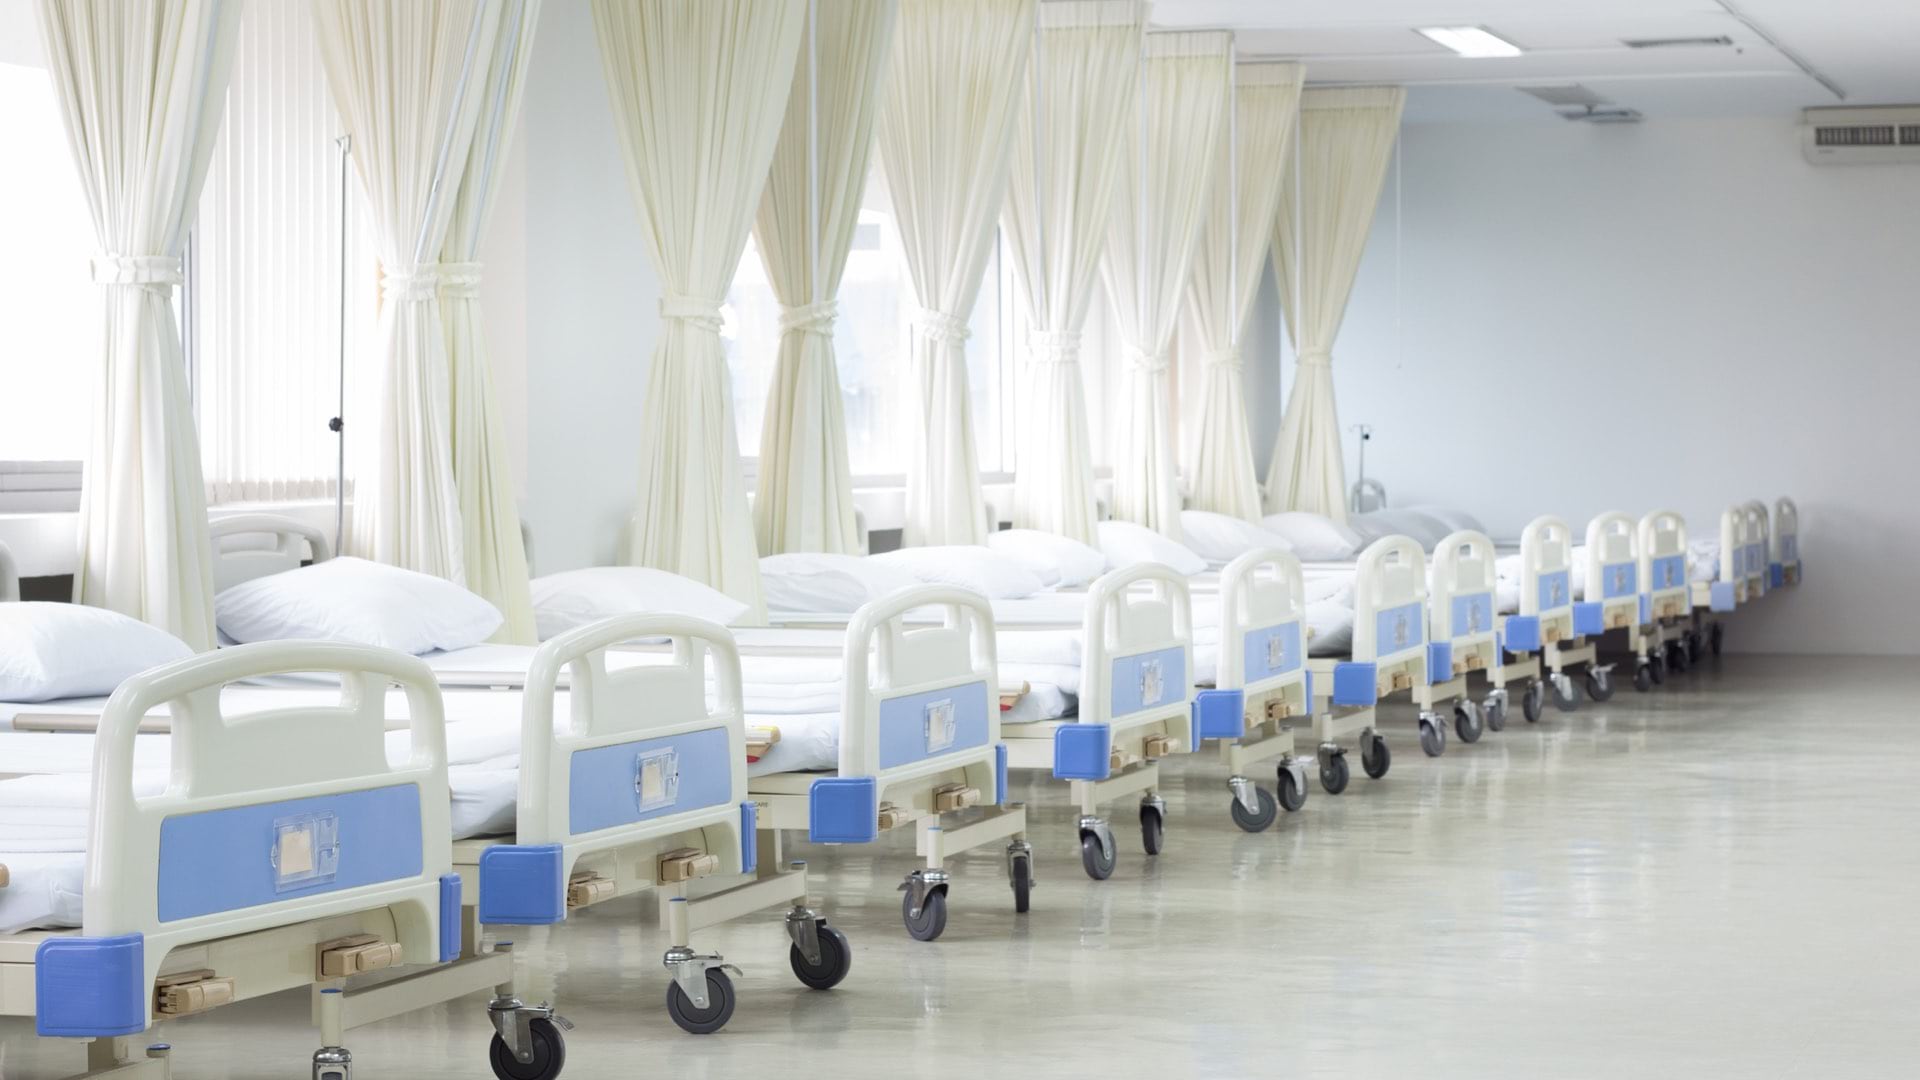
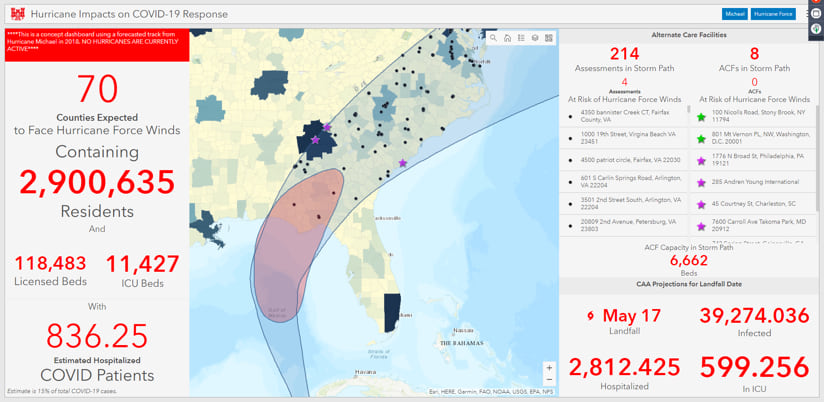
As cases of coronavirus disease 2019 (COVID-19) spread across the US, many worried that seriously ill patients would overwhelm hospital capacity. In late March, the American Hospital Association predicted that if the curve of infection did not flatten, hospital bed capacity would be exceeded by more than 270 percent for inpatient care and by about 500 percent for intensive care.
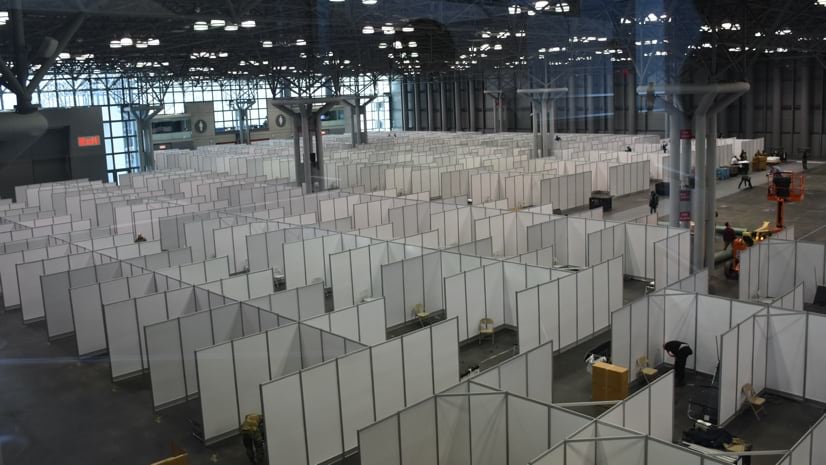
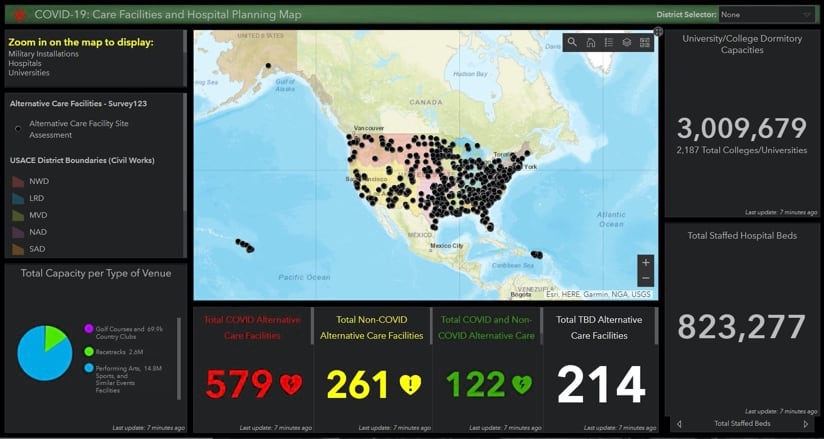
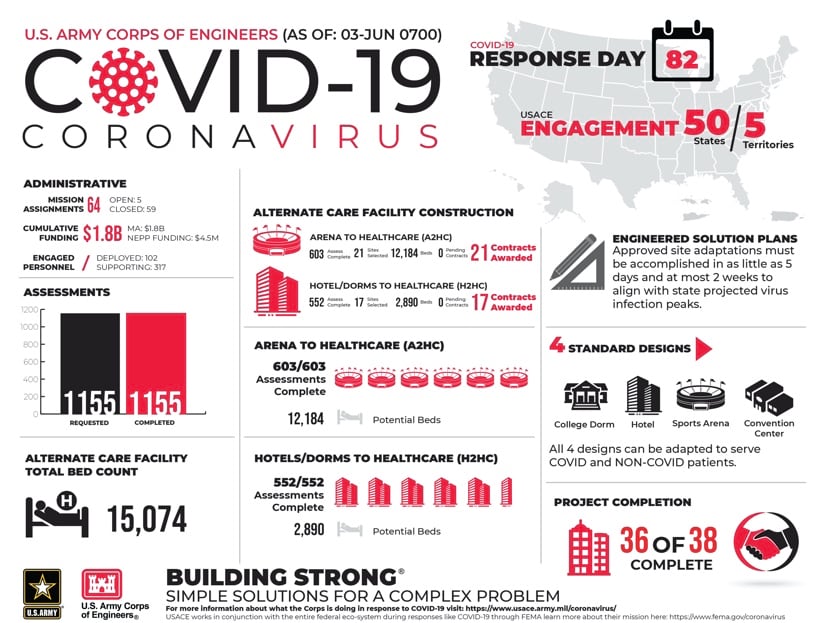
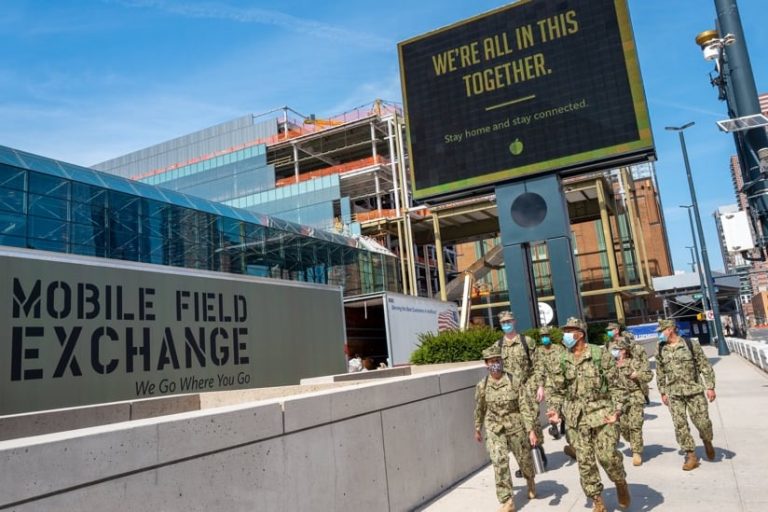
Under its national disaster plan, the Federal Emergency Management Agency asked the US Army Corps of Engineers (USACE) to work with states to build and inspect alternate care facilities. A team from USACE developed engineering plans for converting existing facilities with rooms (such as hotels or college dormitories) and those with large open areas (like field houses or convention centers). From there, the team developed standardized designs, then used mobile applications to quickly assess candidate sites and inspect the retrofitted facilities for readiness.
“There’s no way you can address a complex catastrophe with a complicated solution,” said Lieutenant General Todd Semonite, USACE commanding general, at a White House press briefing.
Responding to a question about how decisions were made on where to build, Semonite replied, “The biggest thing is modeling. We’re looking at some amazing analytics to be able to figure out where we see the growth of the threat and where we see the bed shortage.”
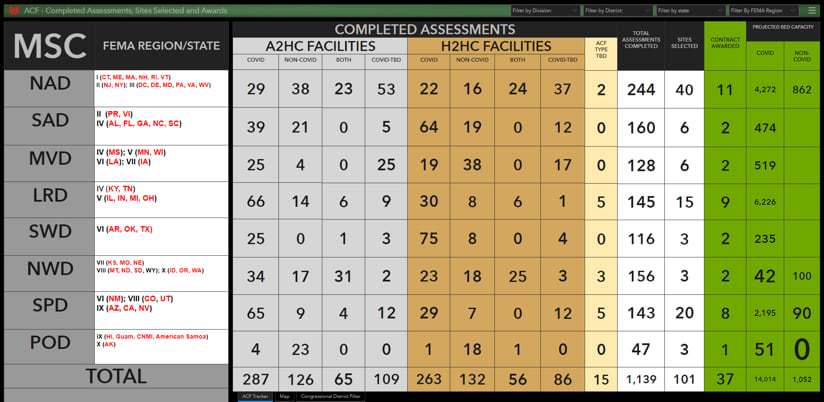
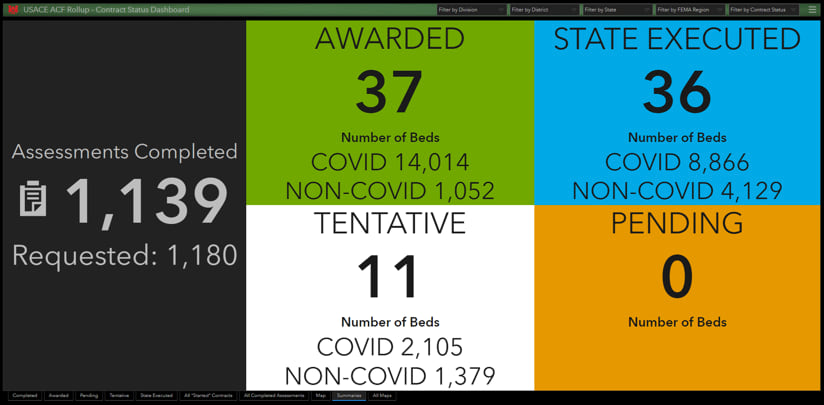
So far, USACE has completed 1,150 site assessments of potential alternative care facilities across the country and constructed or modified 32 facilities, creating 15,074 beds to meet the surge of seriously ill patients.
“There’s really no end in sight for COVID-19 and we’re going to need to continue to maintain these additional beds for some time to come,” said Julie Vicars, a USACE Common Operating Picture (uCOP) manager.
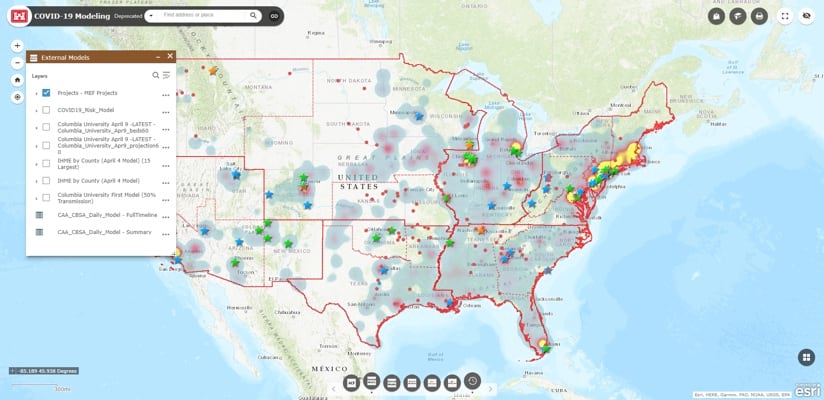
The USACE modeling and analyses team has had to make sense of several models being used in the coronavirus pandemic. Many epidemiologists have adapted the long-standing susceptible, exposed, infected, and recovered (SEIR) models for COVID-19. For example, Columbia University created a spatiotemporal transmission model that first predicted the spread across China before turning to a global view. The Institute for Health Metrics and Evaluation (IHME) at the University of Washington used modeling to project the locations and number of cases and deaths. Penn Medicine’s Predictive Healthcare team created a model it calls COVID-19 Hospital Impact Model for Epidemics (CHIME). Both the Center for Army Analysis and the US Army Engineer Research and Development Center conducted daily modeling efforts.
“General Semonite wanted to know why all of a sudden there were five models,” said Rick Vera, the geospatial branch chief at USACE’s Galveston district who was the team lead for the modeling effort. “Colonel David Hibner, commander of the USACE Army Geospatial Center, had the idea of putting them all together, kind of like a spaghetti model, so that all models could be looked at in one graph to see which were more optimistic and to see which ones predicted that the peak cases would extend into late summer or even fall.”
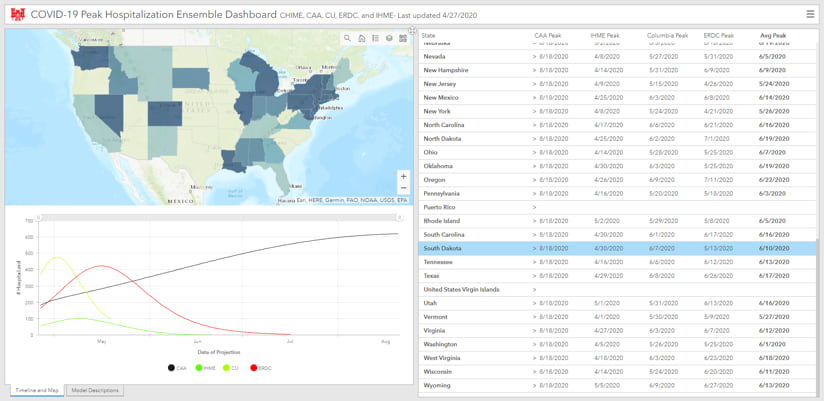
The modeling and analysis team, consisted of an ad hoc grouping of geospatial experts from several USACE offices, all working remotely. This team hosted its dashboards and analyses on USACE’s enterprise geographic information system (GIS) application. Together the team gathered model outputs into an ensemble dashboard using ArcGIS Insights, which allows not just this team but also the rest of USACE and federal partners to view the analyses for decision-making.
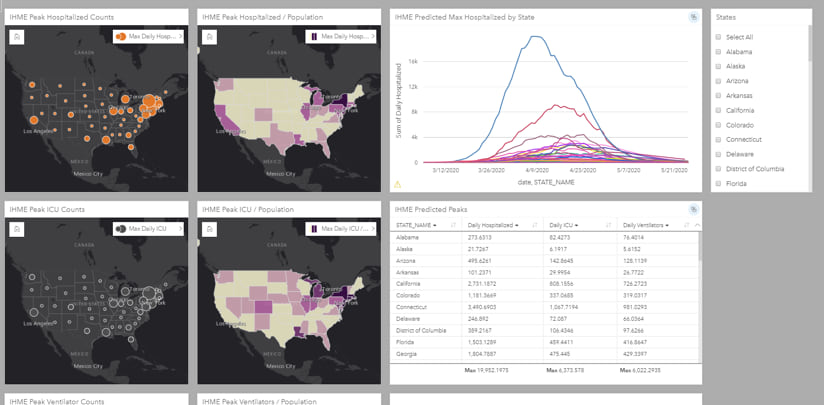
“We’re moving into a very robust dashboard that allows us to slice and dice all of the models at the state and county levels,” Vera said. “We can look at ICU [intensive-care unit] bed predictions across all models rather than one-off queries for each model.”
In early April, there were a lot of projections about the peak of the virus and the impact of social distancing. To take early, decisive action, USACE leadership needed accurate data and analyses quickly.
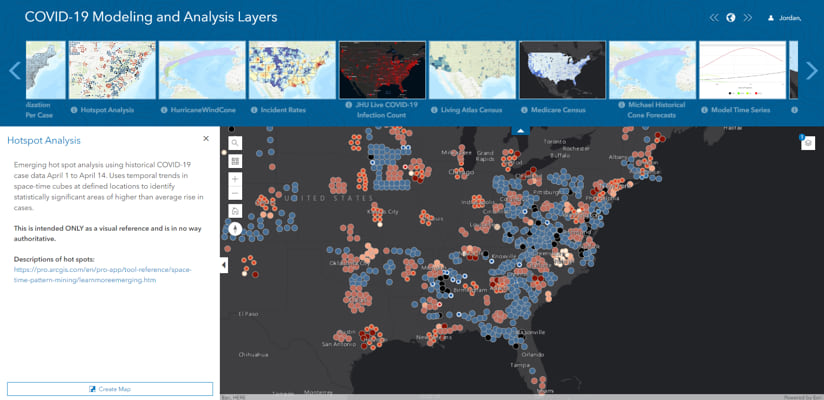
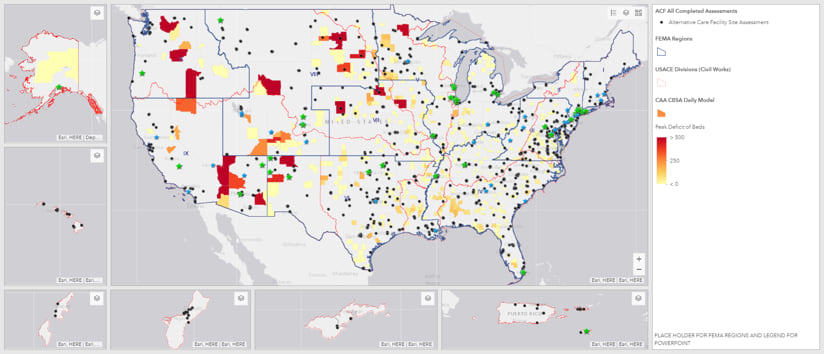
“We started to model the geography and to create a time series hot spot map, and that changed everything,” Vera said.
Within a week, the team developed tools that helped put capacity decisions in motion for alternate care facilities. The team members continue to add daily updates that reflect on-the-ground realities and ensure clean data. Vera said the team is also “providing more analytical products for people to ingest and create their own maps, web apps, and dashboards.”
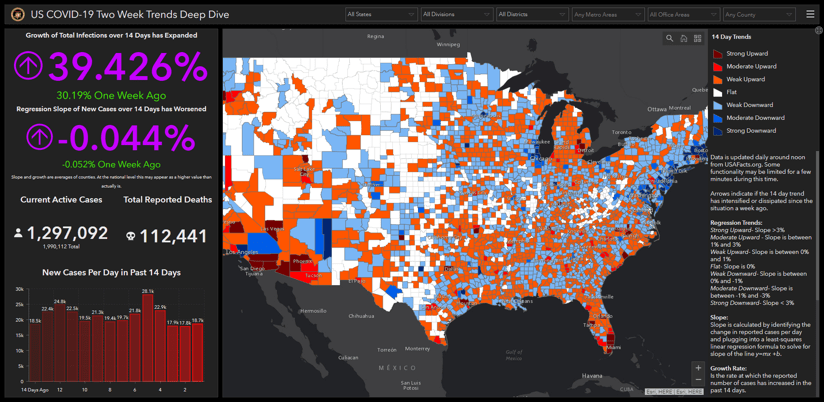
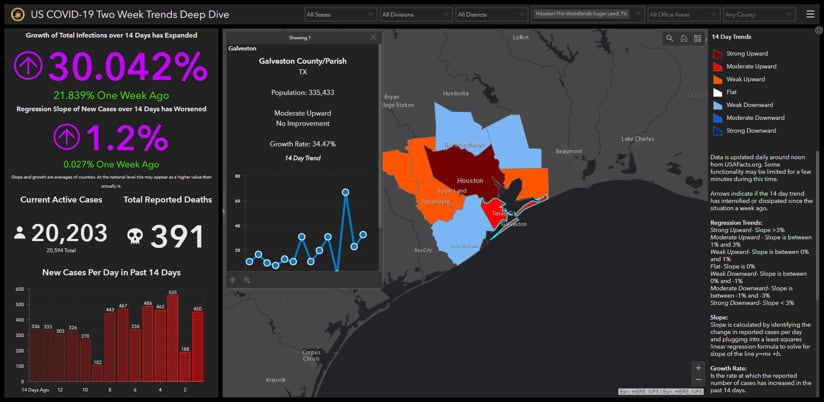
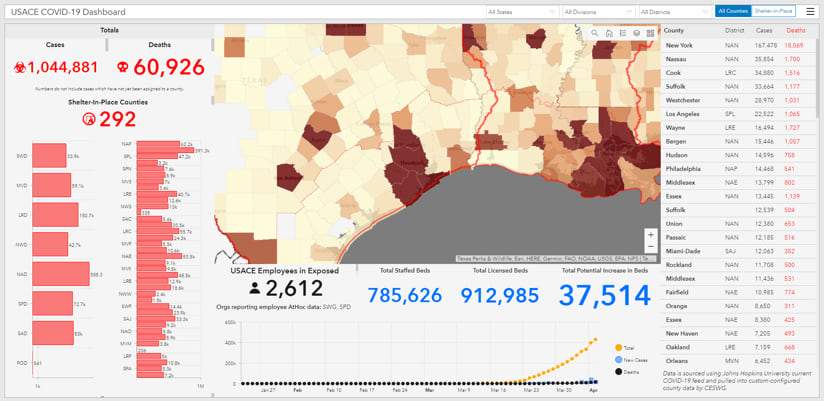
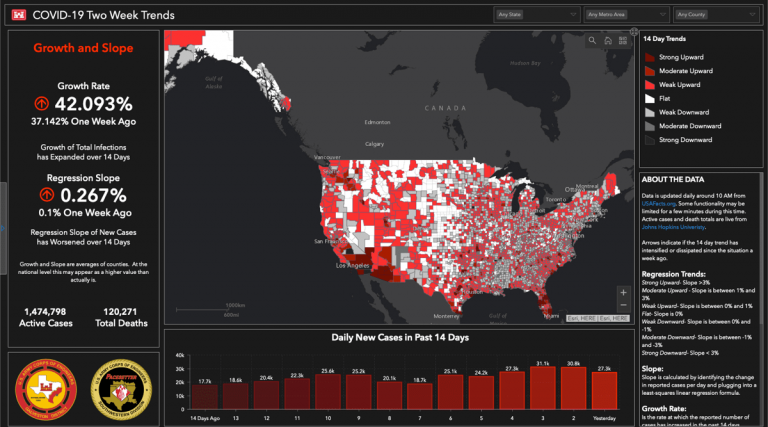
With increasing numbers of dashboards displaying case counts, the USACE modeling team recognized the need to shift the view away from what has happened and toward what is happening.
“We started thinking about new ways to slice and dice the data,” said Jason Jordan, geographer in the Geospatial Branch in USACE’s Galveston District. “We have a script that pulls daily historical data from USAfacts.org and calculates the infection growth rate and linear regression trend of new cases over the last 14 days. This gives us a timeline and a summary of the current data compared to how it was before. Immediately, we can see if things are getting better or worse and at what intensity. The dashboard also allows users to filter by states, divisions, districts, metro areas, office commuting areas, and individual counties so the decision makers can zoom in on their area of interest.”
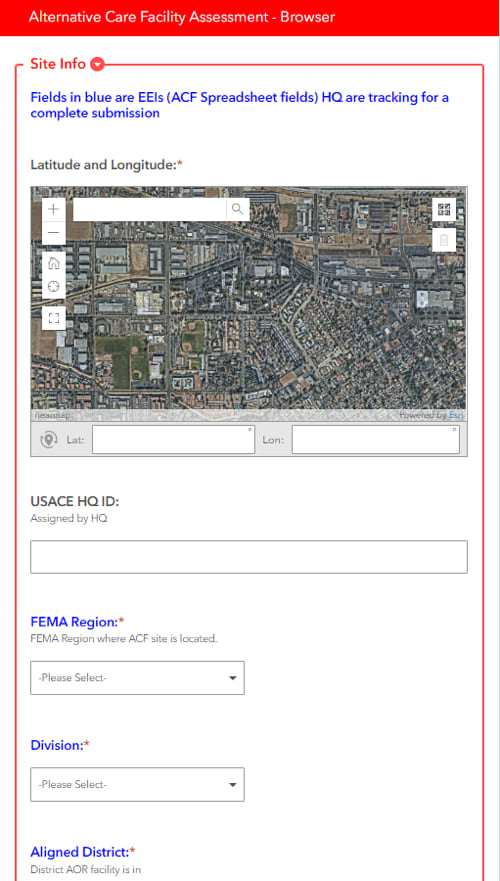
At the start of the effort to determine suitable facilities, individual states used spreadsheets to gather criteria for potential sites. Data collection from spreadsheets quickly became a problem as the number of potential sites increased, making it unwieldy to manage the large volume of tabular data—which could have slowed the inspection process.
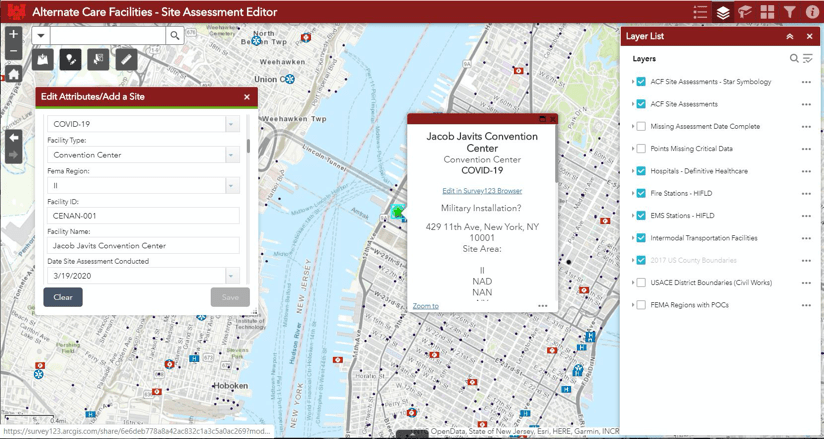
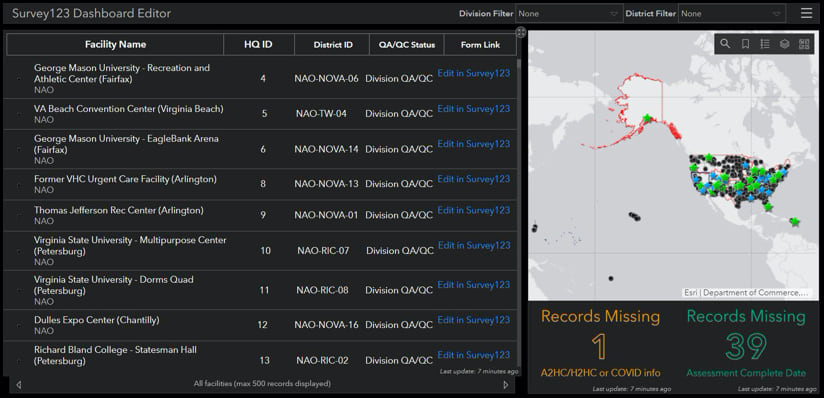
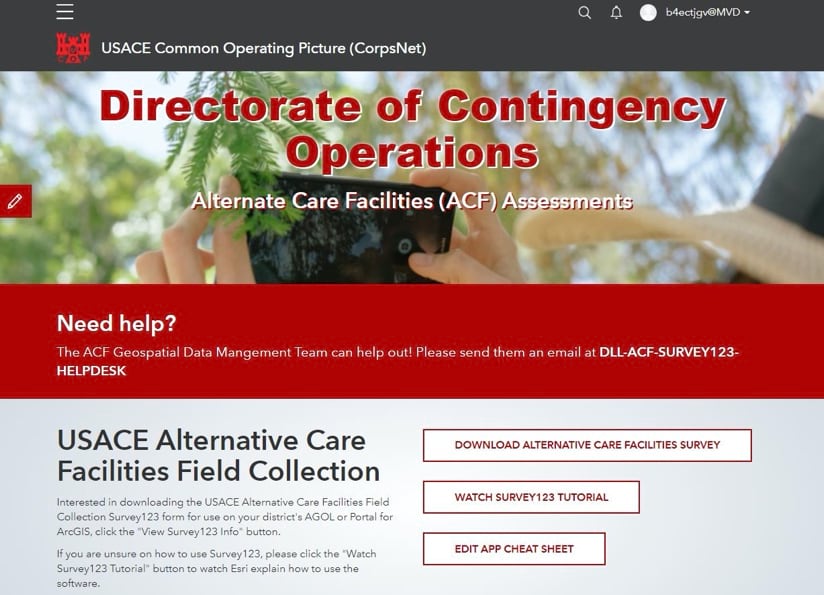
A small team of USACE geospatial professionals devised an app using Esri’s ArcGIS Survey123. They created a standard survey that inspectors could use, with little or no training, to collect data about alternate care facilities during field inspections. The form-based app captured details such as the number of stairwells, the condition of the HVAC system, proximity to active hospitals, concerns about the existence of hazardous waste, and more. The collected data fed into a web-based editor that populated an ArcGIS Dashboards implementation to provide a full enterprise view of facilities across the nation.
“Once it was established and some guidance went out, districts ran with it with no training,” said uCOP manager Vicars, who helped lead the inspection effort. “It was feet to the fire, because the majority using it had little to no experience with the geospatial world.”
At the height of assessment efforts, an average of 450 people per day used the Survey123 data collection app to gather details about potential sites. After a few weeks of initial site assessment, USACE prepared the selected sites for contracting and construction. The geospatial team then added fields in Survey123 to capture additional data and to further guide site development. Preparation work included adding nurse stations, installing call buttons, and piping oxygen to each room.
“Teams would go out to conduct these assessments and you would have a civil engineer looking at one piece, a structural engineer looking at another piece, and an environmentalist looking at another piece,” Vicars said. “Each would add bits of information based on their subject matter expertise.”
An enterprise geospatial infrastructure powered both the forecast models and on-the-ground assessments as the pandemic pushed USACE to a new level of enterprise integration. USACE was able to connect with and engage its 52 districts to collect and share data.
Hospital beds across the country are now ready as a safety net for a COVID-19 surge or other disaster, thanks to USACE, whose mission is to provide engineering solutions for our nation’s toughest challenges.
For more information, see the COVID-19 GIS Hub for location intelligence resources. Also, the Coronavirus Response web page provides a collection of maps and apps that can be used by agencies to understand the virus’s impact and share information about the pandemic with the public.