January 31, 2023 |
John Beck | Public Safety
June 16, 2026
For roughly half a century, the boundaries defining Baltimore’s nine police districts remained the same while the city around them shifted. Some districts fielded hundreds of calls for service every day while neighboring ones were quieter. The map hadn’t kept up. And when a map is wrong, the consequences are operational. If a 911 call for a shooting drops on the wrong side of a boundary, the nearest officer may not be the one who responds. In 2023, a correction to those district lines set a digital transformation in motion that now reaches from the chief’s office to the patrol car.
Data drove every level of it—from the analysts proposing new boundaries to the officer walking the block to confirm them.

Derek Canton, chief technology officer with the Baltimore Police Department (BPD), had a standard for deployment. “We used science to determine what would be best for our agency,” he said, “not just cops on dots, but people who are able to respond in a reasonable time.” The old district boundaries had no systematic measure of workload behind them. Some districts carried significantly more calls than others. Getting the balance right meant building a solution the data could defend.
The push came from multiple directions: active federal court oversight, the operational demands of a city where every patrol assignment carries real stakes, and the belief that better data should determine where officers go. “Redistricting kind of forced our hand,” Canton said, “to make sure we had resources where resources needed to be.”
The effort fell to Rajiv Sharma, geographic information system (GIS) manager for the information technology division. When Sharma joined the department nearly a decade earlier, he and Canton built an enterprise GIS from a standing start. The redistricting would be its most demanding test: data driving the new lines and everyone—from commissioners to council members, from patrol cops to residents—discussing the same maps.
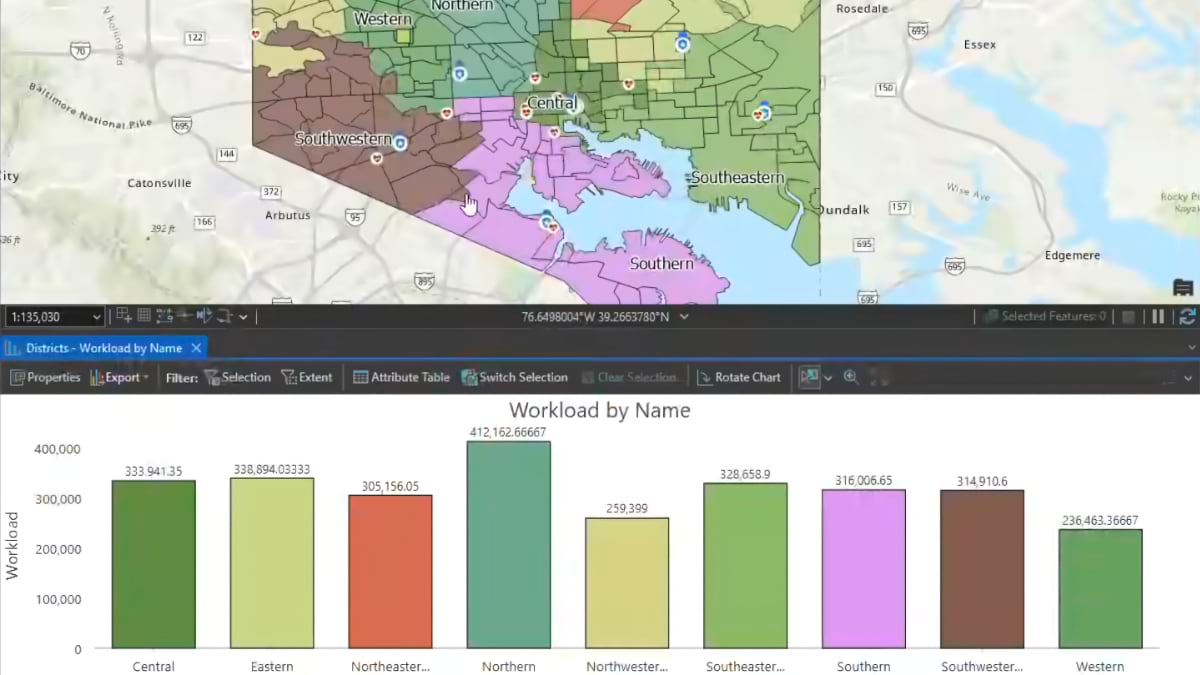
Baltimore police analyzed more than 200,000 crime records and five years of call data before a line was moved on the map. Working with Esri’s territory design tools in ArcGIS Business Analyst, Sharma built the solution around fixed anchors: police stations and hospitals, seeds from which new boundaries grew outward. Into that framework the team fed call volume, unit counts, drive-time approximations, and 2020 census data tracking population shifts across Baltimore’s 278 neighborhoods. From there Sharma’s team ran scenarios, weighed tradeoffs—drive time against crime volume, workload against district size—and adjusted until the boundaries held up on every axis.
Sharma took the analysis to post officers and cops on the beat—people with years on specific blocks whose knowledge the data couldn’t capture. Their input surfaced complications buried in the geography for decades.
Old boundaries had accumulated anomalies, some cutting directly through properties. “Mr. and Mrs. Smith’s bed was cut in half,” Sharma said. “If Mrs. Smith called the police, one post would respond. If Mr. Smith’s side had a problem, he would get a different post.” The same problem scaled to a major trucking facility whose front entrance fell within one district and loading docks in another.
Resolving each anomaly meant going segment by segment, with one governing rule: Every district boundary follows the same side of every road centerline. No street would divide two districts.
The department’s geocoder also had to be aligned with the new district geometry, synchronized with computer-aided dispatch, and coordinated with fire and emergency medical services (EMS)—so that every first responder arrives at the same address. When the geocoder is wrong, a shooting at a busy intersection drops on the wrong side of the line. “If the point drops on the other side, you’re calling for the wrong people to go to the wrong place,” Sharma said. Getting the address right meant aligning the 911 call, the patrol response, and the incident record from the moment someone picked up the phone.
Refinements followed: gaps closed, community concerns were addressed, including a mall and a neighborhood on York Road bisected by the first version. In January 2025, Commissioner Richard Worley approved restructured sectors within each district, improving digital recordkeeping and sharpening supervisory coverage.
Workload balanced across all nine districts. The redistricting also created space for communication. Officers assigned to new territory learned it from colleagues who’d worked it for years. Commanders from adjacent districts sat down and shared what they knew.
“There was greater opportunity for communication,” Canton said. “Commanders were able to have a discussion about who, what, when, where, and how things were happening.” It started around maps and moved to the streets, commanders walking new territory together, pointing out features no dataset could convey.
The new geometry also went public. A find-your-district tool on the BPD website lets any resident enter an address and identify their district commander. Maps of each BPD post—individual patrol beats, with their specific intersections and alleys—went online for the first time.

Violent crime in Baltimore has fallen in recent years. Canton attributes it to a broader set of reforms—resulting in smarter call prioritization, reduced response burden, better data at every level—redistricting among them. “I would like to think the city is safer,” he said, “because we’re able to provide the data that’s necessary to effectively deploy where we need to.”
Canton’s goal was to create a department where any officer could work with spatial data, with GIS training pushed to detectives, patrol officers, and analysts. “We’re pushing the tools down as far as we can get them so that everyone can do it,” he said. “You don’t have to rely on someone from my shop providing information.” Training, he said, creates something else: an environment where officers start asking what’s possible, and the requests come from the ground up.
Om Poudel, a senior application developer Sharma calls his wingman, produces be-on-the-lookout bulletins three times a day—warrant data, mug shots, area-specific crime patterns—giving officers in every district the same picture before they go out.
The same geographic framework underlies Hot Streets, BPD’s block-level analysis of where calls are most heavily concentrated. Each district gets a map showing its 20 highest-call blocks, rendered as red lines—thicker where calls are heaviest—so that a commander can see the weight of a place before deploying anyone to it. Hot Streets applies the redistricting logic at finer resolution: not nine districts to balance, but specific blocks, often just one or two, where proactive patrols will make the most difference.
Sharma’s team also builds ArcGIS StoryMaps briefings for active investigations: shell casings from recent shootings linked forensically to incidents years earlier; ShotSpotter audio tied to precise locations; suspect galleries connected to gang turf and victim networks (see sidebar). Sharma said that when you start building an ArcGIS StoryMaps story, “You get that knowledge graph—from the shell casing to the gun to the criminal who used it, to the gang he belongs to, to the turf area where it happened.”
That geographic awareness extends to the building level. Officers on mobile terminals can see which structures the housing department has condemned and whether a building is known to be occupied. Vacant housing was one of the strongest correlations in the original redistricting analysis—a signal of where workload concentrates, now visible on the screen during a foot pursuit. When a suspect disappears inside, the officer already knows the structure and whether anyone is likely to be in it.
The reach of what Sharma and Canton built extends beyond the city of Baltimore. Departments from Baltimore County to Cary, North Carolina to San Diego have come to study it.
Canton is deliberate about what drives the results. The department’s GIS platform is central, but the transformation depends on integration across systems and partners—housing data from the Baltimore Department of Housing & Community Development, geocoder alignment with fire and EMS, call data from 911, coordination across every agency having the same operational picture. “I will not allow this organization to do something because it’s cool,” he said. “What we do must benefit our officers or the city.” The redistricting qualified. So did the geocoder alignment, the ArcGIS StoryMaps briefings, and the training program that put spatial tools in the hands of officers who, a decade ago, were reading PDF maps pinned to a notice board.
Officers now pull up maps before they start their shifts, checking what happened while they were off duty. The data doesn’t forget those places. Neither does the officer who works the beat.
Learn more about how GIS supports data-driven policing.