

June 6, 2023 |
Carrie Speranza | Public Safety
February 10, 2026
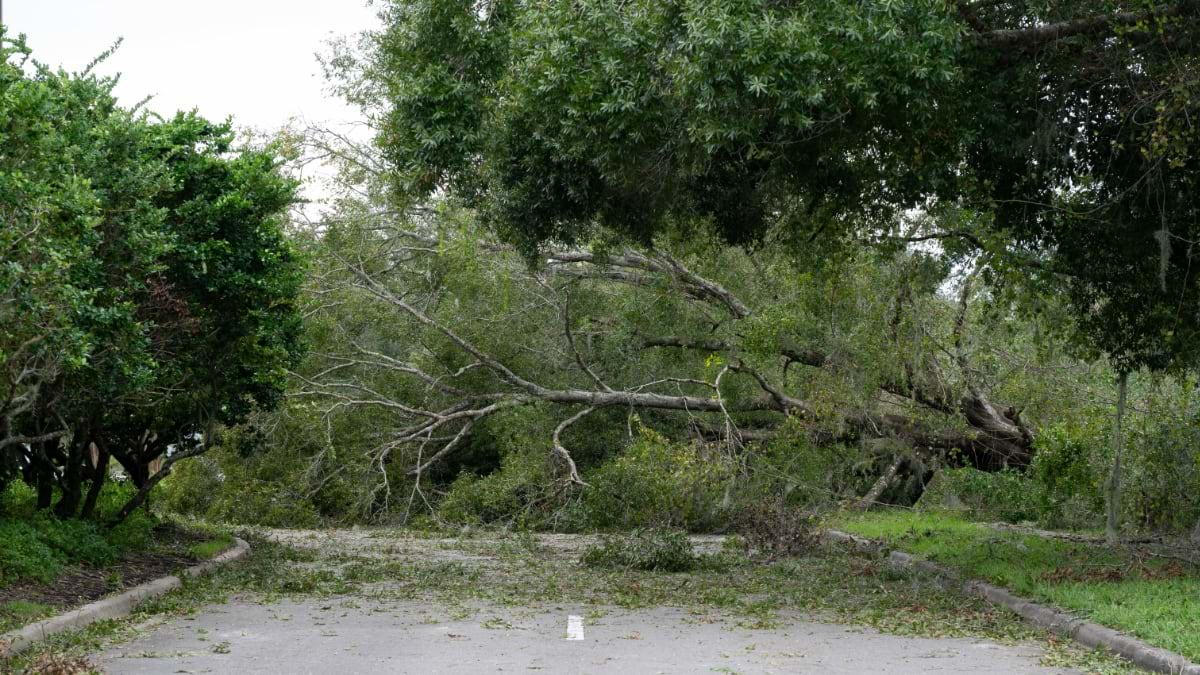
When Hurricanes Helene and Milton struck Florida’s Tampa Bay region just weeks apart in September 2024, Hillsborough County faced a crisis. The region suddenly became the epicenter of back-to-back disasters, forcing emergency teams to respond with rapid precision.
Management and staff from the Geospatial Services Division worked around the clock at the county’s Emergency Operations Center (EOC). Its mission: use geographic information system (GIS) technology to bring clarity to the chaos. The result? GIS powered real-time damage assessments, guided emergency crews, and helped secure federal disaster declarations and recovery funds.
Helene and Milton struck just 14 days apart, creating a compounded challenge. “We were still activated for Helene when Milton came,” said Sara Sillars, the applied GIS manager for the county. She worked 12-hour shifts at the EOC for about a month. “We used all of the data coming in from the field to provide reports, which led to the FEMA [Federal Emergency Management Agency] disaster declaration.”
This wasn’t a typical hurricane season. The storms tested infrastructure, workflows, and communication, requiring teams to adapt under pressure. For Hillsborough County’s GIS team, it meant transitioning from a support role to a central coordinating force.
Each map, dashboard, and dataset guided decisions and shaped outcomes. The benefit of these dynamic systems was twofold. Just as GIS helped emergency managers coordinate resources, it also gave residents the tools to locate shelters, check evacuation zones, and track debris collection.
Hillsborough County’s GIS support for emergency management wasn’t always sophisticated. Just six years ago, the setup was minimal.
“When I came, it was pretty bare bones,” Sillars said. “We had one or two people at the EOC, making sure the shelter information and push routes were updated.”
Today, the county’s Geospatial Services Division operates three specialized sections. The Applied GIS section creates mapping products for all county departments. During major storms the entire team supports emergency management personnel.
This growth reflects a fundamental shift in how the county views emergency preparedness. Instead of scrambling to create maps during disasters, the team has built systems that work continuously, getting stronger and more refined with regular use.
“When we get activated, it’s all hands on deck,” Sillars said. “But we’re busy year-round.”
Much of Hillsborough County’s emergency readiness comes from data-driven projects that happen behind the scenes throughout the year.
The team uses AI deep learning techniques to extract detailed information from aerial photographs. They leveraged this approach to create a countywide 3D tree canopy map that helps the Natural Resources Department identify code violations. Public works teams use the same data to plan tree trimming priorities based on a suitability analysis.
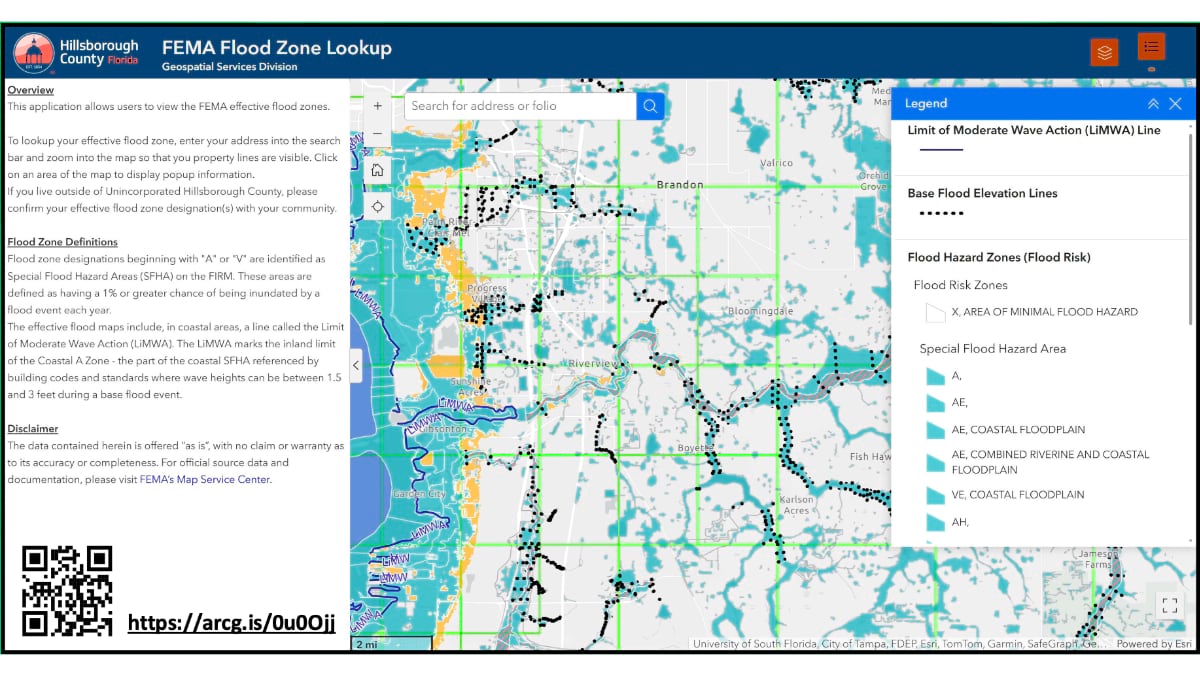
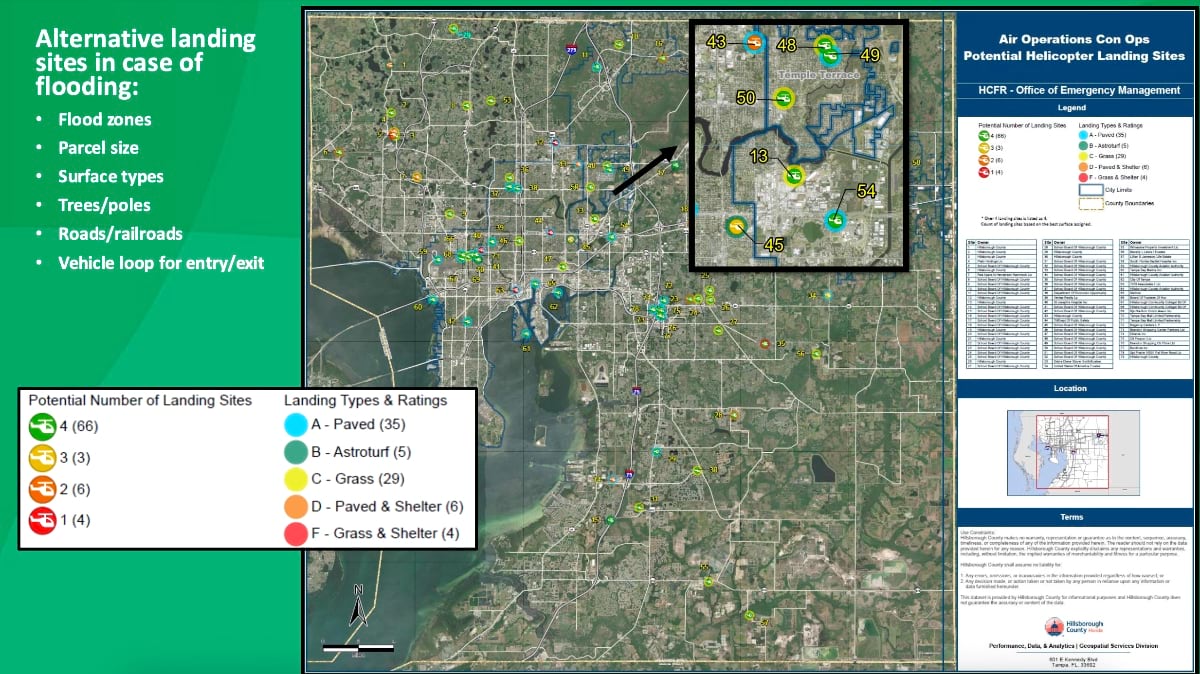
For predictive storm planning, 3D flood models show exactly how storm surge could impact specific buildings. These detailed visualizations provide emergency managers with critical insights.
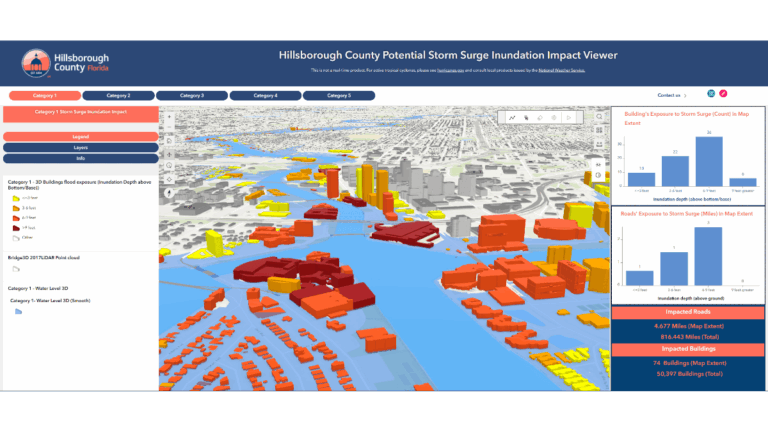
The county’s continuous technical work creates a foundation of detailed, accurate data that becomes invaluable when disasters strike. The team has developed expertise through regular practice, not just during crisis response. GIS tools give them the flexibility to create maps that address day-to-day needs and the urgency of storm response.
“We’ve all become pretty good at figuring things out on the fly because emergency response is not cookie cutter,” Sillars says. “There are a lot of different ways to slice and dice things, given the data available, analysis tools, and the suite of applications we can create.”
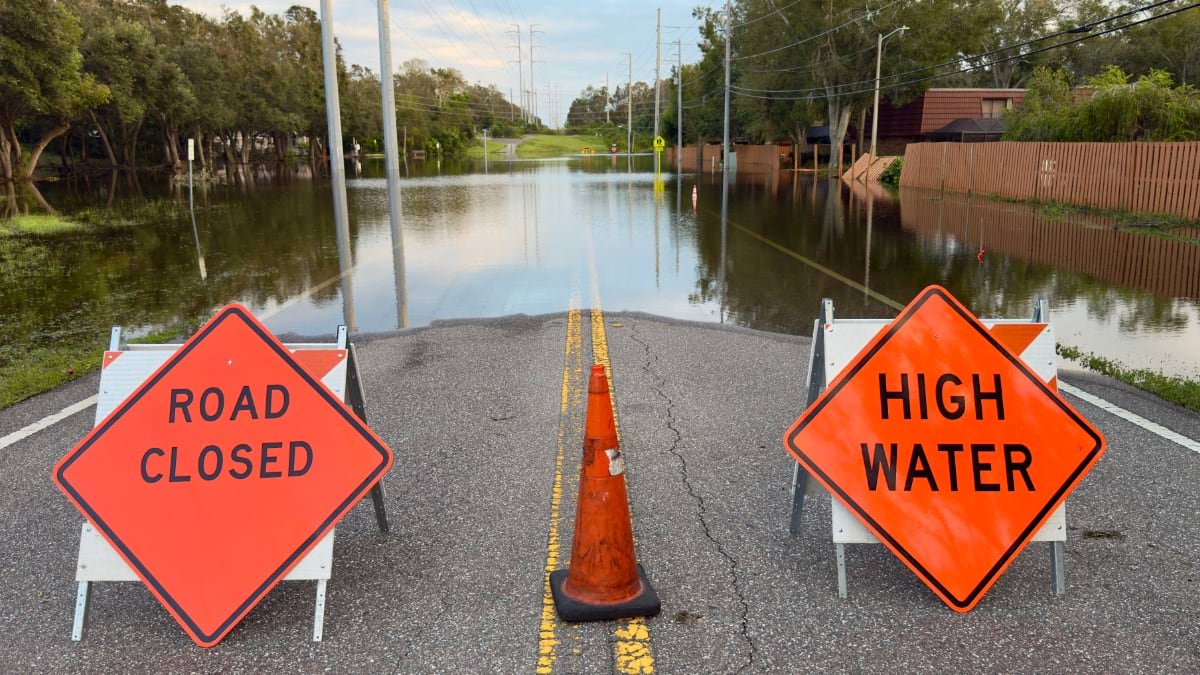
The 2024 storms brought distinctive but equally dangerous conditions. Helene primarily impacted coastal areas with storm surge. But a summer of heavy rains had already saturated the ground when Milton arrived.
“There was flooding in areas that have never flooded before,” Sillars said. An intersection near the University of South Florida was inundated despite being far from the coast and not near any rivers or water features.
These unexpected conditions revealed gaps in existing flood models. “The NOAA [National Oceanic and Atmospheric Administration] storm surge models that we use only contain surge data—they don’t account for rainfall, so inland flooding is less predictable,” Sillars said.
The storms also revealed data gaps the county had never encountered. “When crews were doing debris collection after the storm, they needed to be able to get into the gated communities, and we didn’t have gated community data,” Sillars said.
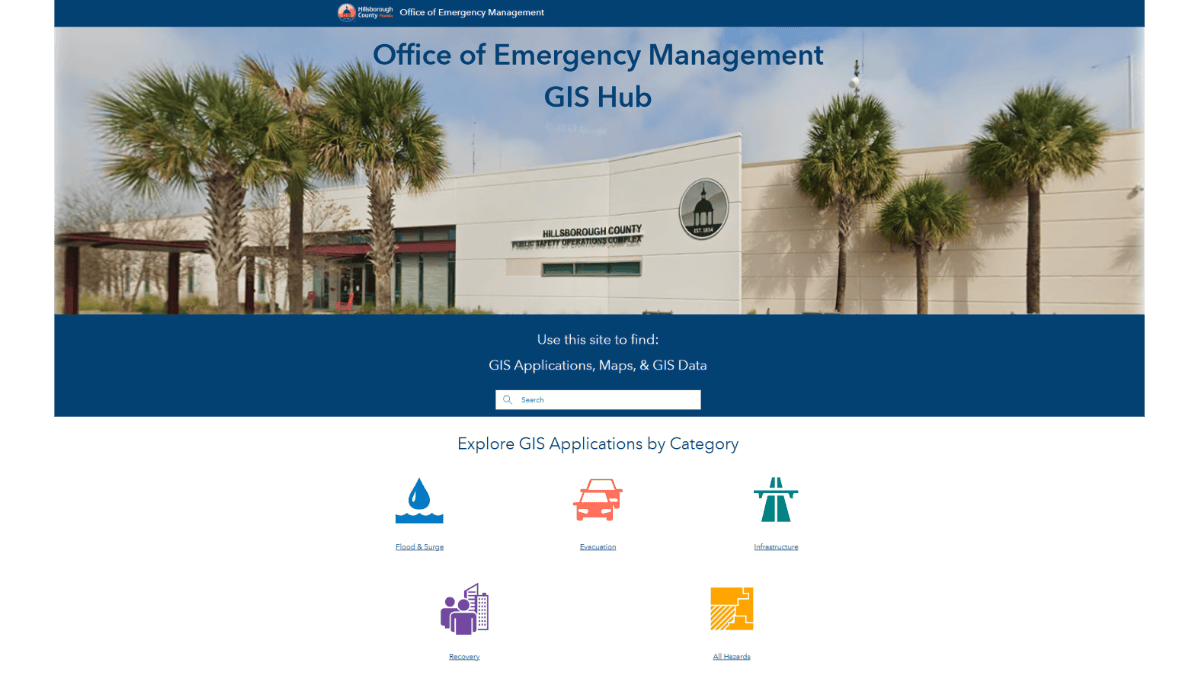
To fix this, the GIS team collaborated with the Sheriff’s Office and worked with a public works analyst who compiled information from subdivision records and homeowner associations. The result was a new map layer identifying both gated communities and single-access neighborhoods. This information is now permanently maintained and available on the county’s internal Emergency Management hub site.
“It took several months to get the data completely compiled and quality checked,” Sillars explained. “That’s something we’ll maintain in the future.”
Despite the challenges, the back-to-back storms represented the most successful activation of Hillsborough County’s GIS systems to date. “It was the most cohesive and seamless experience compared to the other storms,” Sillars said.
The success reflects years of building relationships across departments. “Because we work with these departments on a regular basis, we know the people, we know their operations,” she explained.
During major activations, the GIS team gets dedicated space in the EOC with the monitors, workstations, and equipment they need, including plotters for printing large-format maps.
The hurricane tracking app helps by combining live weather feeds from the National Oceanic and Atmospheric Association (NOAA) and the National Hurricane Center with local data like shelter locations and evacuation zones.
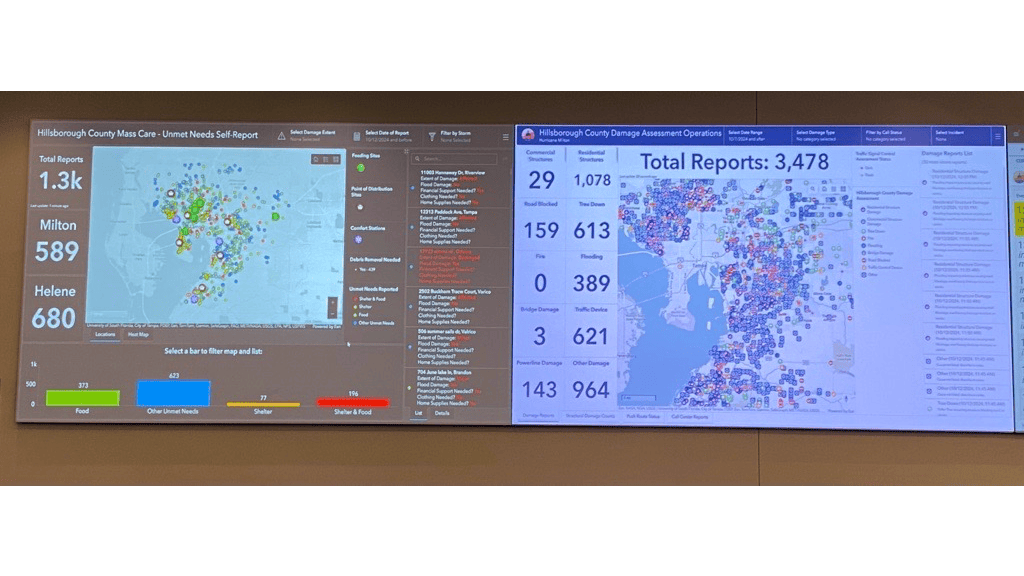
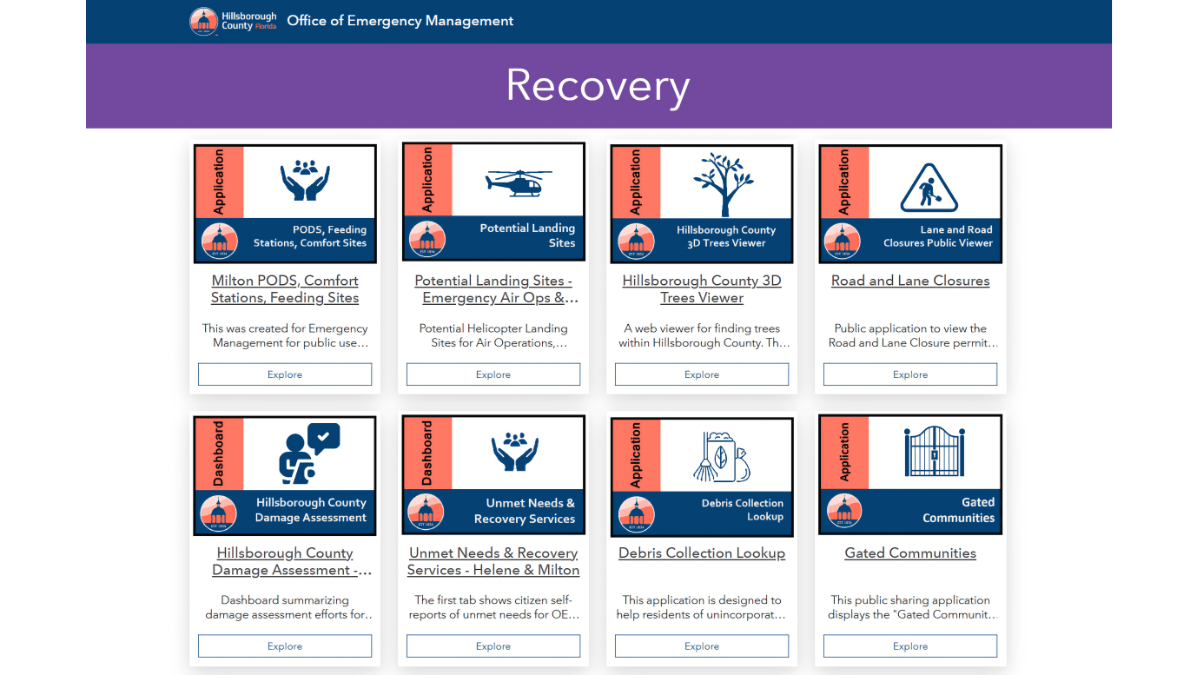
The team also operates an unmet needs dashboard that tracks public requests. Residents fill out online forms reporting damage and needs, which get displayed on maps updated multiple times a day.
Outside the EOC, field teams including fire rescue, code enforcement, and public works use geoenabled apps on mobile devices for tasks such as windshield assessments and damage reports. These inputs feed directly into a centralized damage assessment dashboard, giving emergency managers a live view of conditions across the county. The dashboard tracks damage severity and estimates structural loss at the parcel level.
“During the storms, all of the apps were working in concert, giving us quick reports that made us feel well prepared,” Sillars said. “Emergency management can see where and what kind of help residents need and deploy their resources accordingly.”
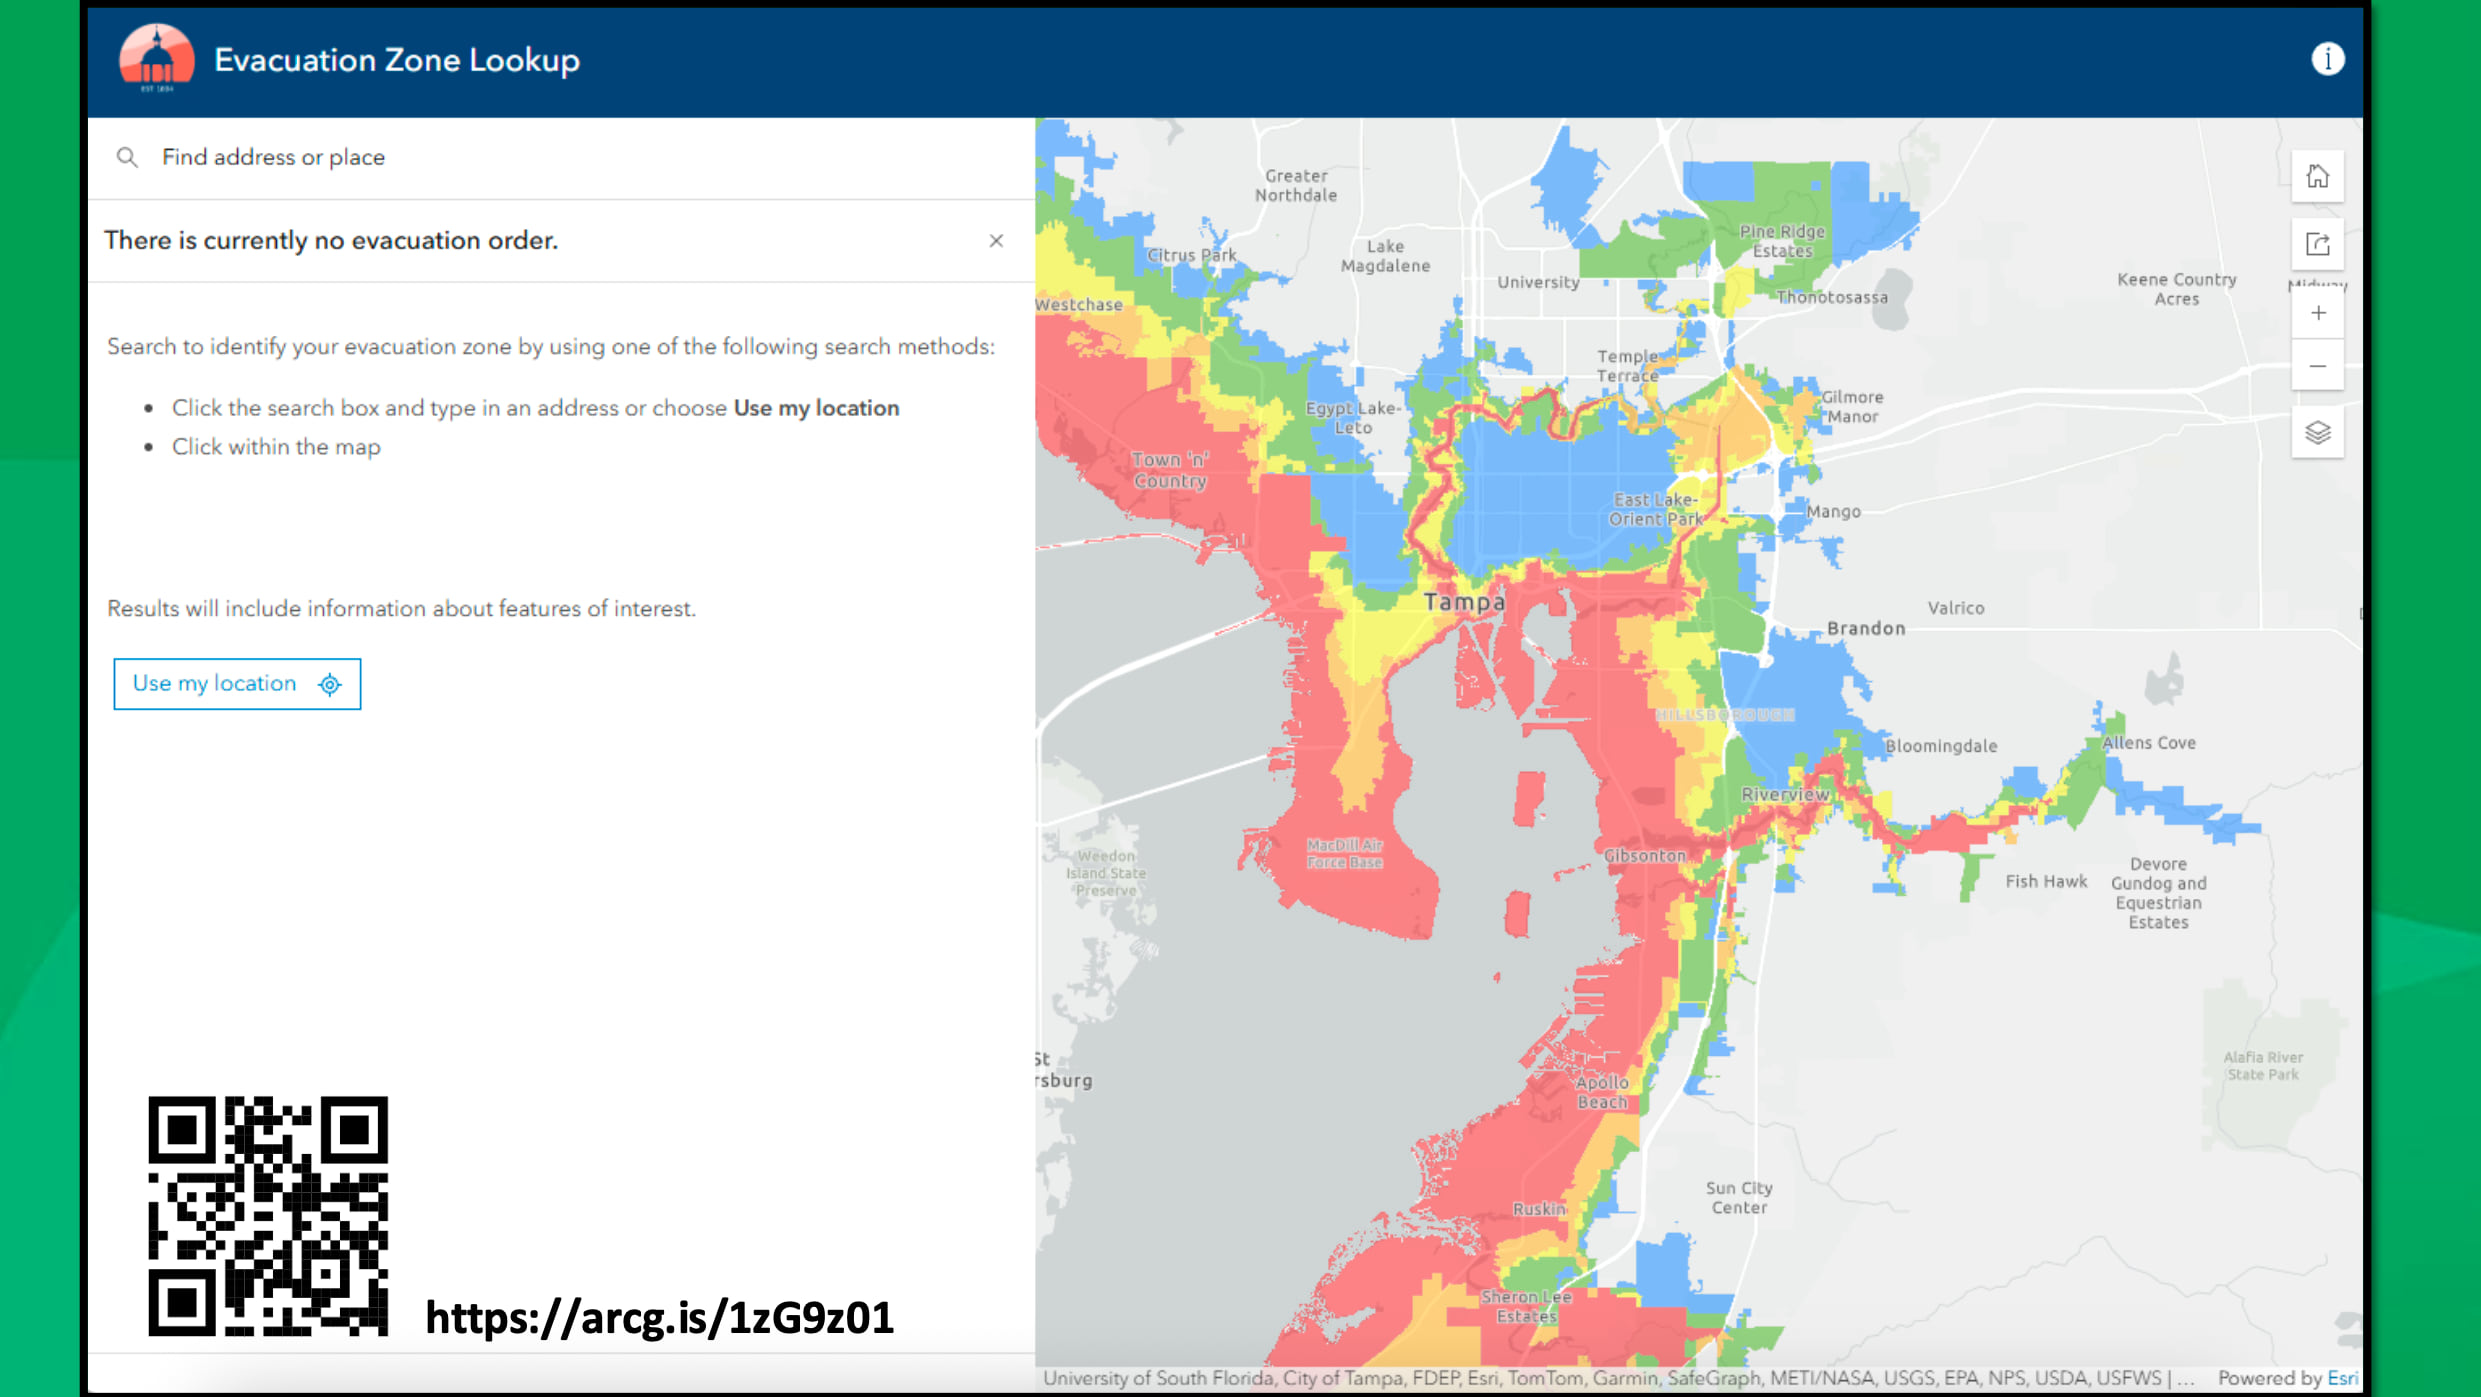
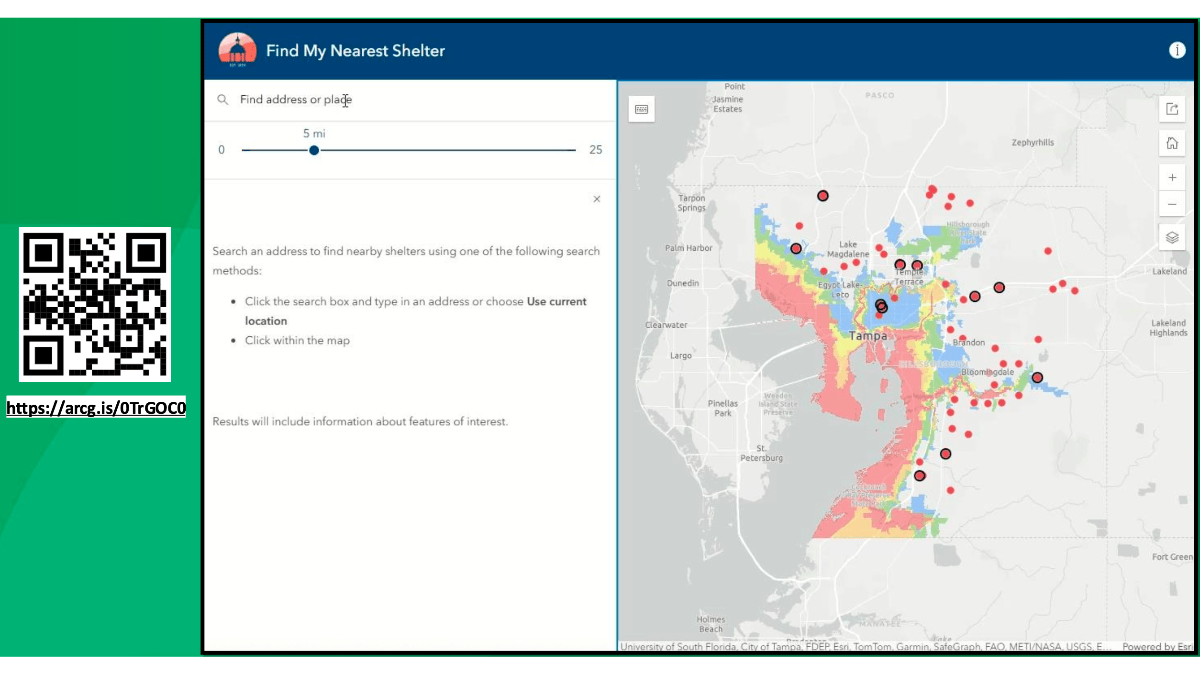
Maps also helped residents navigate uncertainty. Hillsborough County’s public-facing apps—like Evacuation Zone Lookup and Find My Nearest Shelter—are designed to be accessible and easy to use. With these tools, residents can understand their risk and make informed decisions quickly.
“These ArcGIS Instant Apps are great for emergency response—they’re clean, simple, and there’s a very small learning curve. If the public is using it, they don’t need a lengthy help document to figure out where to click,” Sillars said.
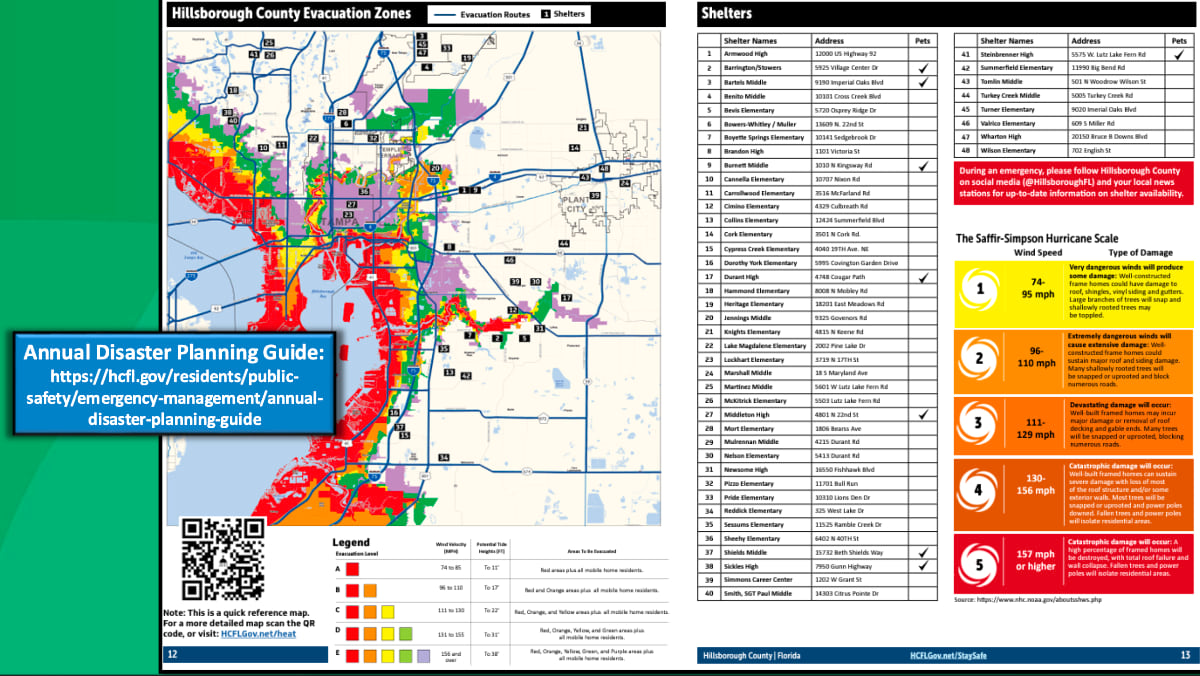
The evacuation zone lookup tool allows residents to quickly determine whether they are in a mandatory evacuation area. The shelter finder helps them locate the nearest open shelter, with updated information provided by emergency management. These tools are especially important for dispelling common misconceptions, like the belief that an evacuation means traveling hundreds of miles.
“A lot of people don’t know that they don’t have to leave the state, or even the county,” Sillars explained. “You could just go 30 or 45 minutes away and be outside the evacuation zone.”
By simplifying this information, the GIS team helps reduce confusion and improve public safety. The tools also support the county’s communications team, which uses them in social media posts and public announcements to guide residents through each phase of the storm.
In Hillsborough County, GIS is more than a technical resource—it’s a strategic partner. Throughout the storm cycle, the Geospatial Services Division works alongside the Office of Emergency Management and other county departments to ensure that data drives every decision, whether it’s coordinating field crews or guiding residents to safety.
The GIS team maintains low turnover because staff see the work as meaningful. And their enterprise approach means emergency management doesn’t need to outsource during crises. “We have the data, and we have the GIS personnel to understand the data and get it to work within the apps and the dashboards,” Sillars said.
The county has transformed from having minimal GIS support during emergencies to operating a comprehensive platform that serves both responders and residents. It’s a model of how communities can build true resilience—not just reacting to disasters but preparing for them.
GIS technology continues to evolve. Every time there’s an activation, the Hillsborough County GIS team improves its tools, strengthens workflows, and deepens collaboration with emergency management and other departments.
Each storm teaches them something new that gets built into permanent operations. Together, they’re building a more flexible system—one that’s ready for whatever comes next.
Explore how GIS supports emergency operations before, during, and after a storm.