
May 6, 2020 |
July 16, 2020
Less than a month into 2020, Ensheng Dong heard the news. A new viral contagion, SARS-CoV-2, had begun to spread in Wuhan, the capital of China’s Hubei Province. Dong, a graduate student at Johns Hopkins University in Baltimore, was thousands of miles away from the outbreak’s epicenter, but he had studied epidemics and knew how fast they can spread.
Taiyuan, another provincial capital and Dong’s hometown, is 600 miles from Wuhan. That’s not exactly next door—it’s the same distance that separates New York City and Detroit—but Dong felt concerned for his family’s safety.
On January 20, the first case of COVID-19 in the United States was confirmed in Washington state. Suddenly, the coronavirus—for Dong—seemed that much closer.
The following day, Dong met with his faculty adviser, Lauren Gardner, co-director of the school’s Center for Systems Science and Engineering. They discussed the emerging epidemic and decided it was worth a closer look.
Gardner suggested that Dong use a geographic information system (GIS) to construct an online dashboard, a visualization tool that uses maps and data to monitor unfolding events.
Dong nodded. “That’s my plan.”
Dong, 30, studies systems engineering, a modernized approach to civil engineering for the complex, interconnected world.
“The emphasis is on civilization engineering,” Dong said. “It’s basically about the interaction of people with the built environment.” For Dong, the discipline allows him to explore ways to combine the objectivity of numeric data with the subjectivity of data visualization.
After completing his undergraduate work in China, Dong earned a master’s degree in geography and statistics at the University of Idaho. While interning at the Idaho Department of Health and Welfare, he helped the agency use GIS to collect health-related data.
When Dong first contacted Gardner about the possibility of pursuing a PhD at Johns Hopkins, she was particularly intrigued by his facility with GIS, a skill Dong had honed during an internship at Esri. He arrived on campus at Johns Hopkins a few months before his program was to start, to assist in a study Gardner was coauthoring on measles vulnerability in the US.
“I immediately jumped into the project and helped her visualize measles risk in a dashboard,” he said. Media outlets, including The New York Times and CNN, featured Dong’s handiwork, a prelude to work that would focus on a much larger health crisis on the horizon.
Dashboards are typically oriented around a map, with accompanying charts, graphs, or other visuals to contextualize map imagery. But first, a dashboard requires data.
Soon after his meeting with Gardner, Dong gathered the data he needed to launch the Johns Hopkins COVID-19 Dashboard. For the rest of January, he worked mostly by himself, driven by a desire to map the outbreak on Taiyuan. “I wanted to see how large the dot was in my hometown and compare it to the dot in the epicenter of the breakout,” he said.

“Ensheng and I were basically the two that started the dashboard, but he was really the mastermind behind it,” Gardner said in a podcast about the science behind the now-famous dashboard. “He’s a total whiz with Esri technology and dashboard development.”
As cases began to multiply around the world, Dong struggled to keep up. He scoured the internet for reliable data, often consulting BNO News, a Dutch website publishing COVID-19 data from several nations in table form. In addition to gathering data, Dong had to synchronize it, accounting for the different ways governments classified cases as “confirmed” or “recovering.”
Twice a day, he would update the dashboard. “For a month, I barely slept—five hours a day or less,” he said.
One reason the work was so labor-intensive was that Dong was inputting all the data manually. In February, Esri’s Living Atlas of the World team helped the team with “data scraping,” automating the process of importing the data from China. A team of volunteers was assembled from Johns Hopkins to help update and maintain the site.
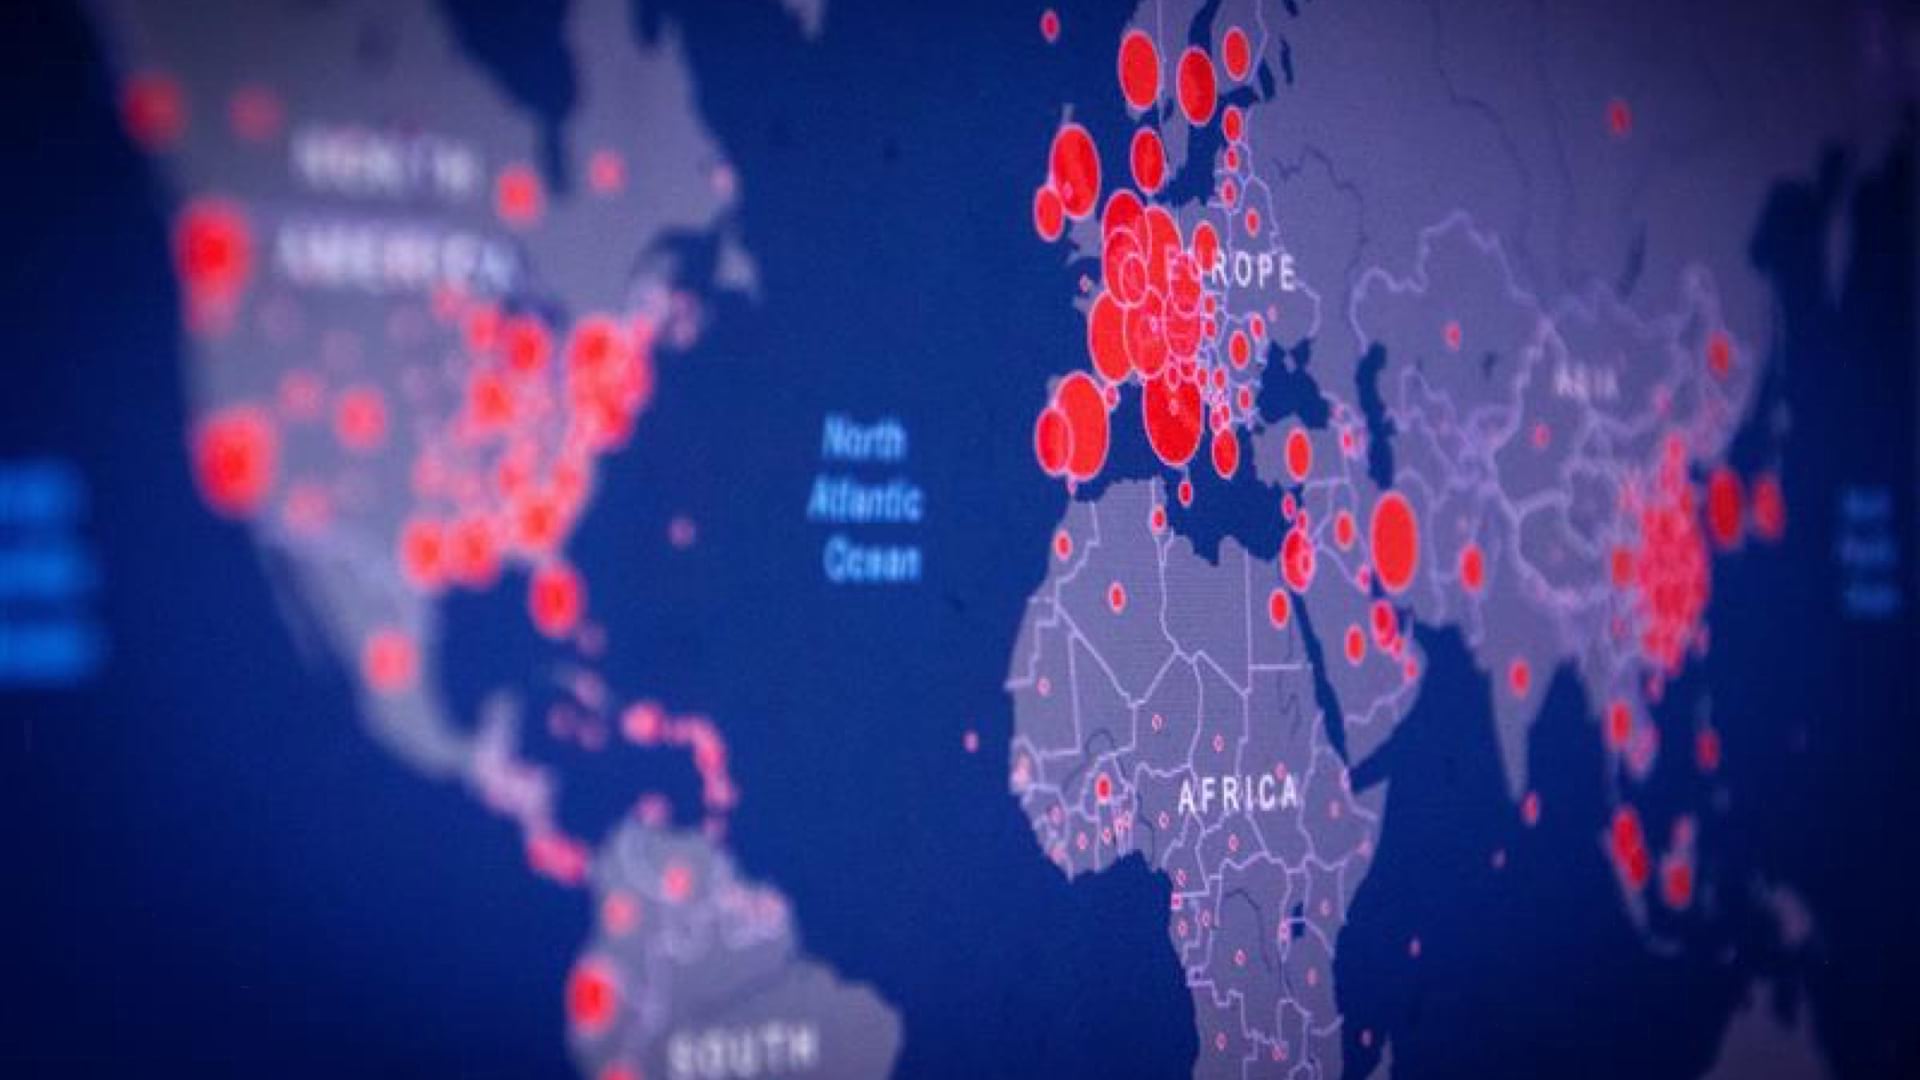
Soon after Dong began to amass data, he had to confront the questions about how to present it. To emphasize the alarming nature of the pandemic, Dong chose to display bright red dots over a stark black background. The larger the dot, the greater the number of COVID-19 cases in that region.
Behind each red dot lurks a plethora of choices. A major decision involved how to break down the data for presentation.
As Dong’s team adapted the map to provide worldwide data by state and province—and, in some countries, such as the United States, by county—these choices multiply. The county-level perspective means the United States is blanketed in red dots while other countries may have one large red dot and a lot of blank space.
“As we get down to the state level, for large countries like Russia, we can spread out that one large dot so you’ll see more distributed dots that aren’t as large,” Dong said. “That’s a tricky thing for geographers—what’s the best size for the dot?”
A map like this needs to inform and empower people to take action, but it also runs the danger of making people lose hope so they see no way out of the crisis.
“We’re constantly adjusting the dot,” Dong said. “We added a few other maps besides the cumulative and confirmed cases, such as active cases, to clearly communicate the data we were collecting and sharing. If more people in your country are recovering, you refer to that map—the dots are smaller and you feel better.”
Increases in dashboard visitor traffic indicated the disease’s progress. “We had at least three crashes,” he said. “Each time, it was because of a surge of cases in new locations. I remember that at the end of February, as Italy and other European countries had more cases, we could see that a lot of Italians were jumping on the site to see what was going on.”
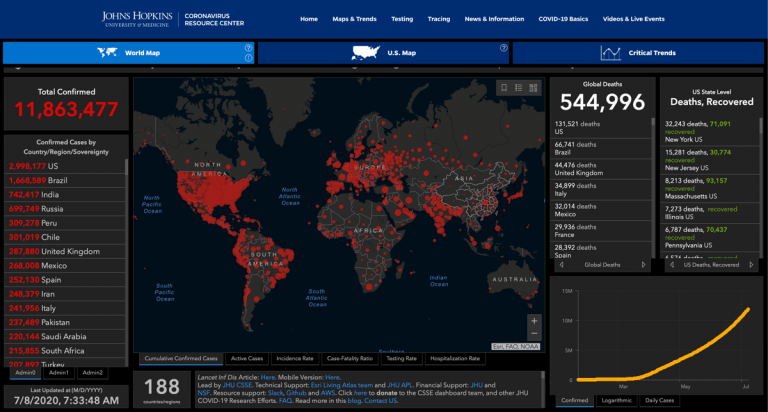
By mid-March, around the time the World Health Organization officially classified COVID-19 as a pandemic, Dong’s team was able to automate updates from all US counties.
What began as an attempt to monitor the outbreak in China has evolved into one of the world’s most trusted sources of information on the pandemic.
“I think we’re now getting somewhere between 3 and 4.5 billion requests a day,” Gardner said. “And they’re coming from everywhere. Most of it is just individuals clicking around on the dashboard, but there are definitely lots of requests for the data that we make available, which other groups are pulling directly into their own internal dashboards and using for policy making.”
With the data gathering mostly automated, Dong can step back a bit from the site and begin to study the epidemic itself, using mobility models as the basis for his doctoral dissertation. But with his adopted country now the pandemic epicenter, he still keeps an eye on the map.
“Initially, dots were mainly located in China and East Asia, and I worried about my family,” he said. “Right now, my hometown has zero new cases, but today there is a large dot near where I live in the US.”

May 6, 2020 |

July 9, 2020 |

April 20, 2020 | Multiple Authors |