April 7, 2026
Mapping Greenland’s Fjords and Glaciers: Three Ice Tongues and the Secrets of the Seafloor
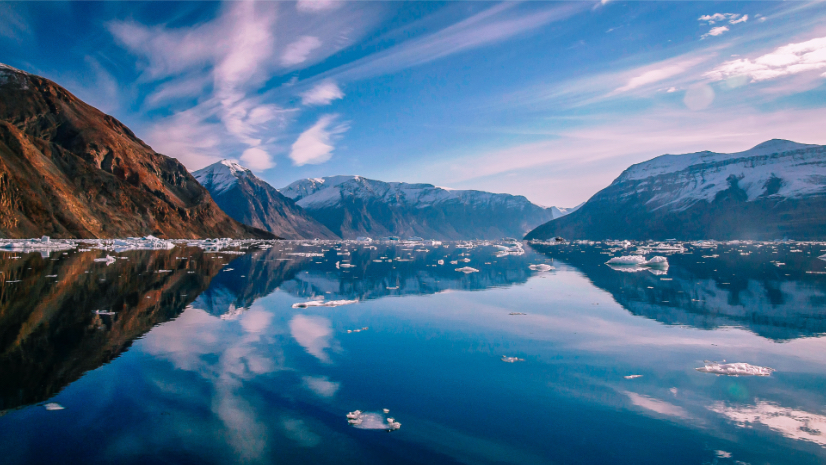
The Swedish icebreaker Oden set a course in summer 2024 through the Nares Strait, a narrow, ice-choked waterway that cleaves Greenland from the Canadian Arctic. The ship was headed for Greenland’s Victoria Fjord, near the world’s northernmost land point—a place so remote, no known ship had ever explored it.
Oden carried a group of 40 scientists who study the Arctic. It marked the third such trip to Greenland fjords since 2015, all organized by the Swedish Polar Research Secretariat. But none had yet attempted to penetrate this far into the thick summer sea ice.
A diesel-powered behemoth, Oden spreads 107 meters from stem to stern and rises six stories above the waterline. The trip would take them farther into the Last Ice Area (LIA) than icebreaker captains like to go. A few of the scientists calculated 20 percent odds of reaching Victoria without turning back.
Onboard, two experts in marine geology and geophysics—Martin Jakobsson, of Stockholm University, and Larry Mayer, of the University of New Hampshire—led a team of mapmakers. They planned to use a geographic information system (GIS) to map the fjord’s seafloor, 400 meters below the ice.
The maps would support the work of all scientists on the expedition and potentially reveal crucial secrets about the rising oceans.
Icy Spatial Context
Mapping underwater topography requires the creation of a bathymetry map, comparable to a topographic map of land. Oden’s acoustic tools—echo sounders for seafloor depth and shape, Doppler profiles for currents, sub-bottom profilers for sediment history—feed the maps with all the details they need.
In turn, the maps provide what Mayer, in a mid-voyage dispatch, called “spatial context” for the biological, oceanographic, and geochemical data being gathered.
The maps also had a more immediate application. Victoria Fjord had been observed through satellite imagery, but never closely mapped at the source.
No known nautical charts existed. The lack of exact knowledge about depth and the presence of small islands, along with the constant presence of sea ice, called for slow movement and extreme caution.
The technology was “essential for determining whether Oden can safely navigate in the uncharted waters in the area,” Mayer wrote.
Ten days and 227 nautical miles later, Oden reached Victoria. The maps made there confirmed one theory—and uncovered an unsolved mystery.
-
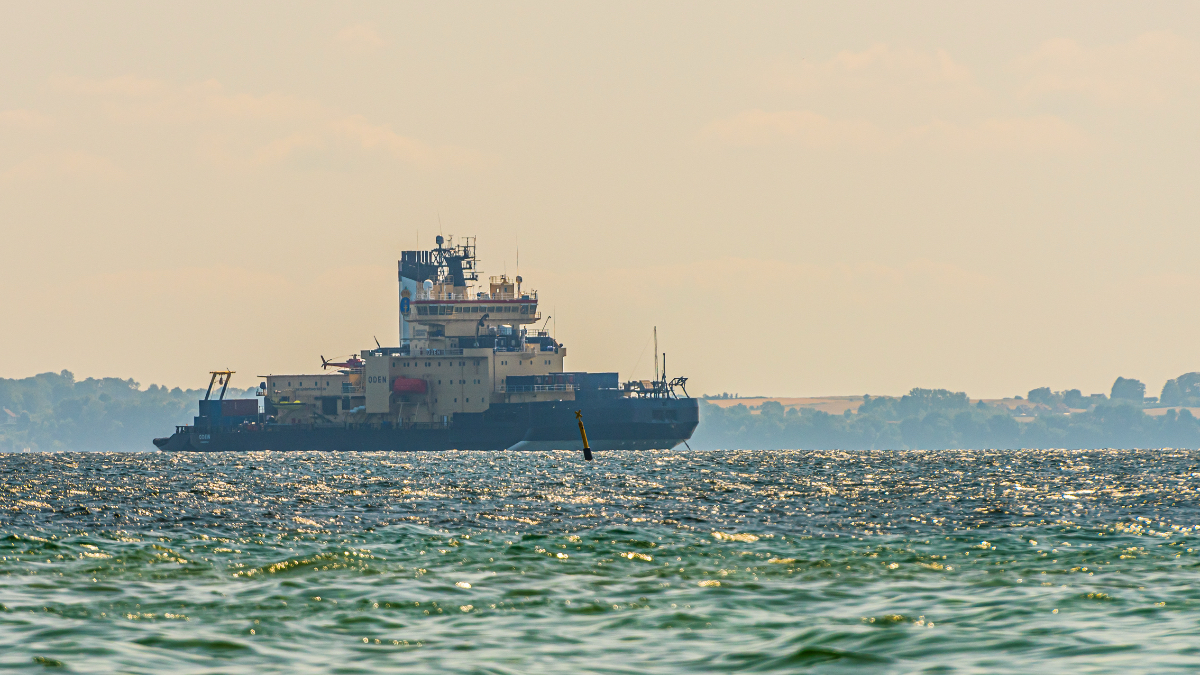
The Swedish icebreaker Oden, a 107-meter-long diesel-powered research vessel, carried 40 scientists through the ice-choked Lincoln Sea to map fjords no ship had explored before.
Modeling the Rising Seas
To understand sea level rise, scientists build predictive models. Planners and policymakers use the models to see where and when municipalities will require evacuations, and which coastlines can be protected by seawalls.
The models affect where houses will be built, and how critical infrastructure will be protected. They also strengthen economic predictions, such as quantifying risks for insurers and underwriters. These decisions have broad implications, directly impacting much of the global population. One billion people worldwide live within 10 kilometers of a coastline. In the US alone, 140 million live in coastal counties.
Without good knowledge of the melting glaciers, predictive sea level models will be inaccurate by between 15 and 20 percent. And because some of the changes are happening below the ocean’s surface, satellite imagery is not enough.
Scientists have no choice but to make slow voyages through the ice, using GIS to make bathymetric maps. The future of sea level modeling demands it.
All Eyes on the Ice Sheet
Around the time of the first of the three Oden voyages, in 2015, the melting of the Greenland ice sheet—a single mass covering 80 percent of the island—was determined to be the biggest driver of sea level rise. It remains so today.
Greenland’s ice sheet includes at least 215 glaciers that terminate at the coastline. The sheer mass of these glaciers leads to their enormous kinetic force. Over time, as snowpack accrues, a glacier slowly turns over on itself, letting gravity carry it to the coast. Imagine a blob of very cold honey on an incline, slowly succumbing to gravity.
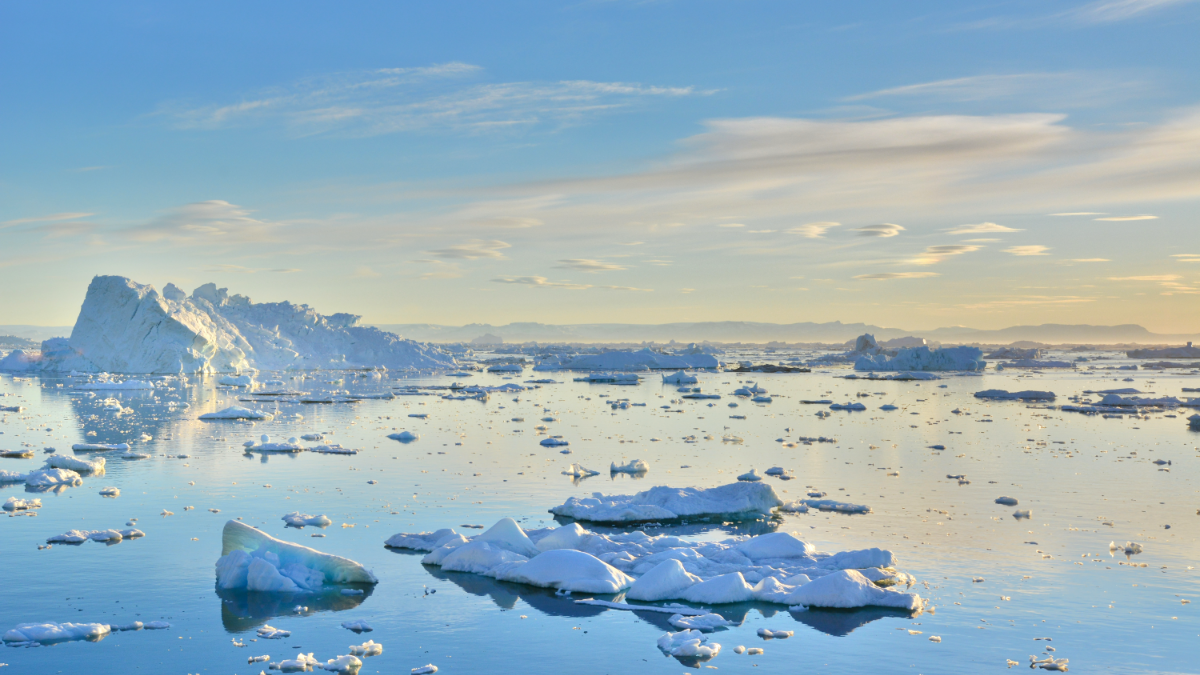
This constant motion puts stress on the glacier, causing fissures to form. When the fissures ripple outward, compromising the glacier’s stability, ice chunks break off the front and into the ocean—a process called calving.
Every year, Greenland’s coastal glaciers calve around 450 gigatons of ice into the ocean, the equivalent mass of the world’s tallest building, Dubai’s Burj Khalifa, every 10 hours.
Absent the warming climate, calving serves a natural purpose, helping a glacier maintain equilibrium over time as its overall mass increases. Today, the melting ice sheet is causing water to run underneath glaciers, accelerating destabilization and increasing the rate of calving.
The Mystery of Northern Greenland’s Glaciers
Most of the calving currently comes from the glaciers on Greenland’s east, west, and south coasts. But there is an important caveat. The northern glaciers drain a total catchment area that is disproportionately large, compared to the giants on the other coasts. And drainage has been a slower process than elsewhere in Greenland.
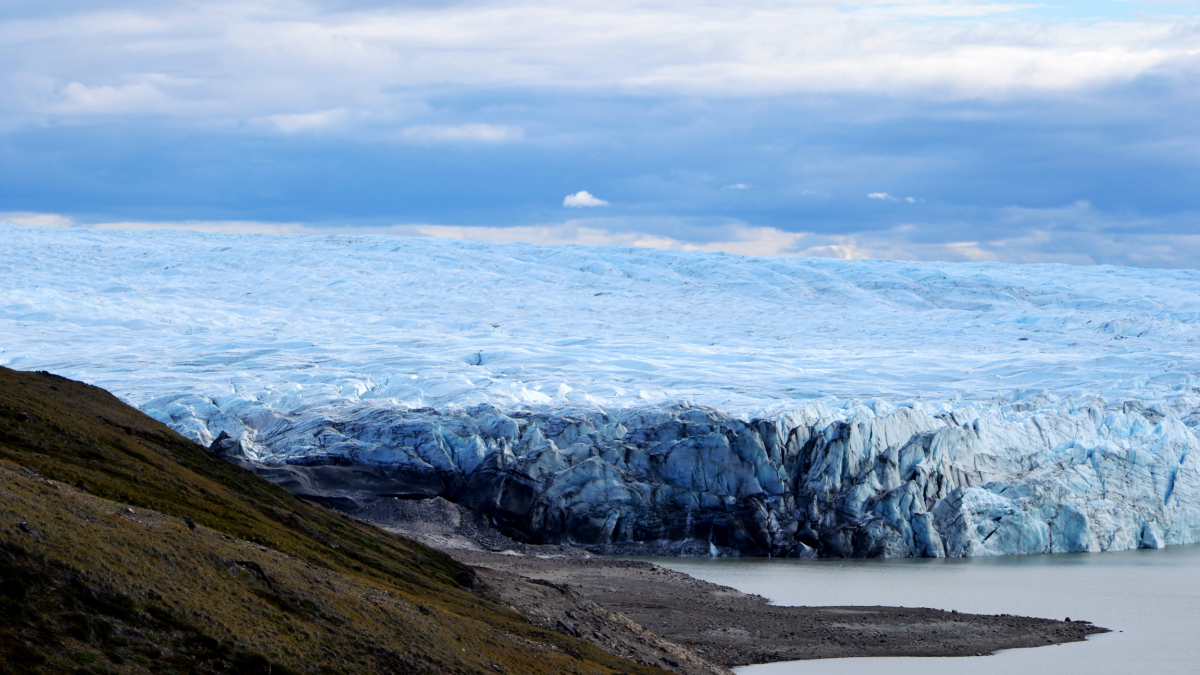
It is the fjords that have slowed calving in the north. Glaciers that drain into fjords develop floating ice tongues that extend out from the water’s edge. Most are between 1 and 40 kilometers long, with a width between 15 and 30 kilometers.
Ice tongues anchor themselves to local topography, such as islands and the sides of the fjords. An ice tongue buttresses its glacier, adding structural integrity that slows down the rate of calving.
For now, northern ice tongues are slowing the drainage. But questions remain about how exactly they’re doing this—and how long they’ll continue, as warmer ocean waters eat away at them.
The Vanishing Ice Tongue
Each of Oden’s voyages has targeted one fjord and the glacier it fronts. Each journey has answered a crucial question, while raising another that the next voyage has tried to answer.
The destination of Oden’s first voyage with the Arctic scientists was the Petermann Fjord, which fronts its namesake glacier. A few years prior, satellite imagery had revealed that the glacier had lost a big chunk of its ice tongue.
Scientists had theorized that warm water from the Atlantic Ocean was flowing up to the Arctic. When the Oden team added oceanographic data to the bathymetry, this revealed that warm water was indeed entering the fjord. The warming ocean was melting Petermann’s ice tongue.
The Growing Ice Tongue
There was just one problem with this conclusion. Further up the Lincoln Sea, something very different was happening to the Ryder Glacier, which drains at Sherard Osborn Fjord, the destination for Oden’s second Lincoln Sea voyage, in 2019.
Satellite imagery of the Ryder Glacier revealed that its ice tongue was not only intact—it was stable and sometimes even growing.
This was a mystery, and it called into question the warm water theory. If warm water from the Atlantic could reach Petermann, what was stopping it from getting to Sherard Osborn?
The maps solved the mystery.
Like many fjords, Petermann contains a sill, a submerged ridge that can restrict the flow of water between fjord and ocean. Petermann’s outer sill sits at 440 meters below the surface, deep enough to allow the warm water to flow over it and enter the fjord.
Sherard Osborn also has an outer sill deep enough for warm water to enter. But an inner sill, just 200 meters down, acts as a second barrier—shallow enough to block the warm water from reaching the glacier.
“And so, there was the proof,” Mayer said.
The warm water theory held.
“Like a Nuclear Bomb Had Gone Off”
Five years later, the 2024 voyage initially sowed new doubt about the sill theory.
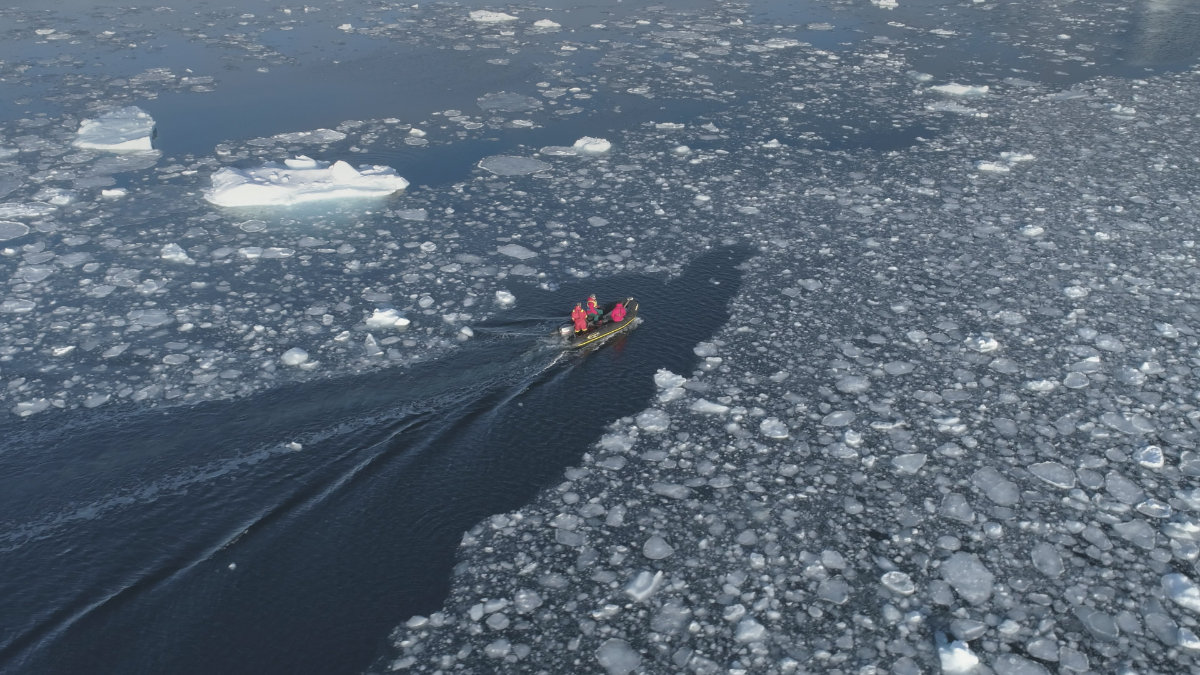
When Oden beat the odds and reached Victoria, it was soon apparent that only about the first one-third of the fjord was accessible. The team could access just part of the fjord’s C. H. Ostenfeld Glacier. Beyond that, huge icebergs blocked the way.
So they hung an echosounder from a cable attached to a helicopter launched from Oden. The pilot flew across the icebergs, dipping low to drop in the echo sounder wherever open water appeared.
They gathered bathymetry from just 19 spots. But along with the good data they had already recorded, it was enough for a decent map.
Still, the results were troubling. The first sounding showed a shallow sill on the seabed. Unlike at Sherard Osborn, the shallow sill was apparently not protecting the ice tongue.
But then they got measurements on the other side of the fjord and found a deep passage allowing warm water to go all the way to the glacier. That was what was melting the ice tongue.
The shallow sill theory of ice tongue protection still held true.
The scientists hoped to get at least a cursory view of the glacier’s face—the place where it met the fjord. Two team members flew over it in the helicopter.
The faces of the Petermann and Ryder Glaciers had appeared smooth and sheer. C. H. Ostenfeld Glacier looked like it was collapsing into the water. Wherever they looked, they saw ice mélange, the chaotic mixture of icebergs, sea ice, and snow created when a glacier sheds large icebergs.
“It looked like a nuclear bomb had gone off,” Mayer said.
Warm water by itself could not cause this level of destruction. “We think it has something to do with the combination of warm water intrusion and bedrock slopes,” Mayer said.
Once again, the solving of one scientific mystery raised another—a puzzle that future bathymetry maps will try to solve.
The Mapping Continues
In 2025, Oden returned to the Arctic—this time joined by a Canadian icebreaker, CCGS Louis S. St-Laurent.
The expanded mission reflects how quickly the stakes have risen. The bathymetric mapping now serves dual purposes: advancing climate science and supporting territorial claims under the UN Convention on the Law of the Sea.
As the Arctic continues to thaw, opening new shipping routes and exposing untapped resources, the maps take on geopolitical weight. The collaboration brings together scientific inquiry, Indigenous sovereignty (Inuit observers regularly sail aboard Canadian vessels), and strategic interests—all guided by what the seafloor reveals.
The warm water still surges north. The ice tongues are still retreating. And now, with two ships cutting through thinning ice, the race is on to map what remains before it’s gone.
Learn how ocean scientists, resource managers, and conservationists apply GIS to map and measure ocean change.