June 27, 2018 |
October 24, 2023
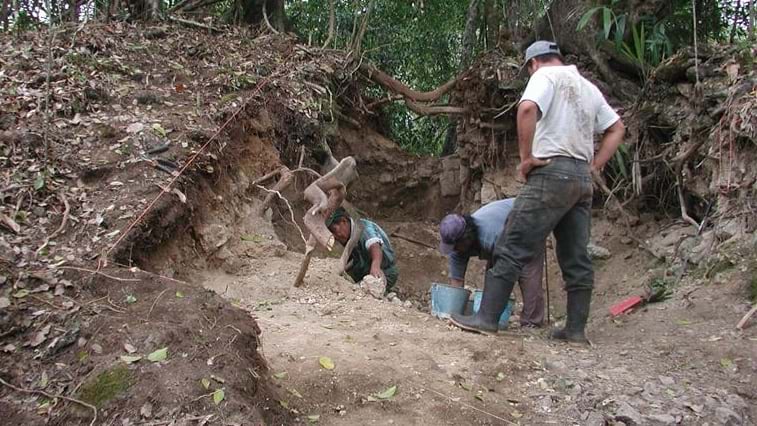
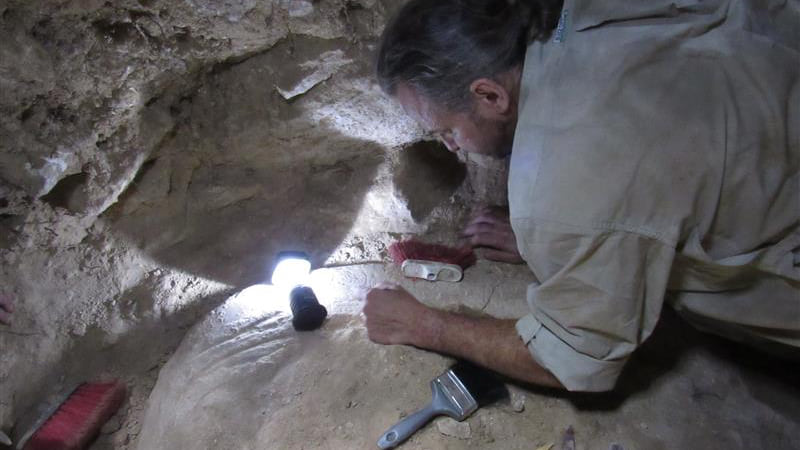
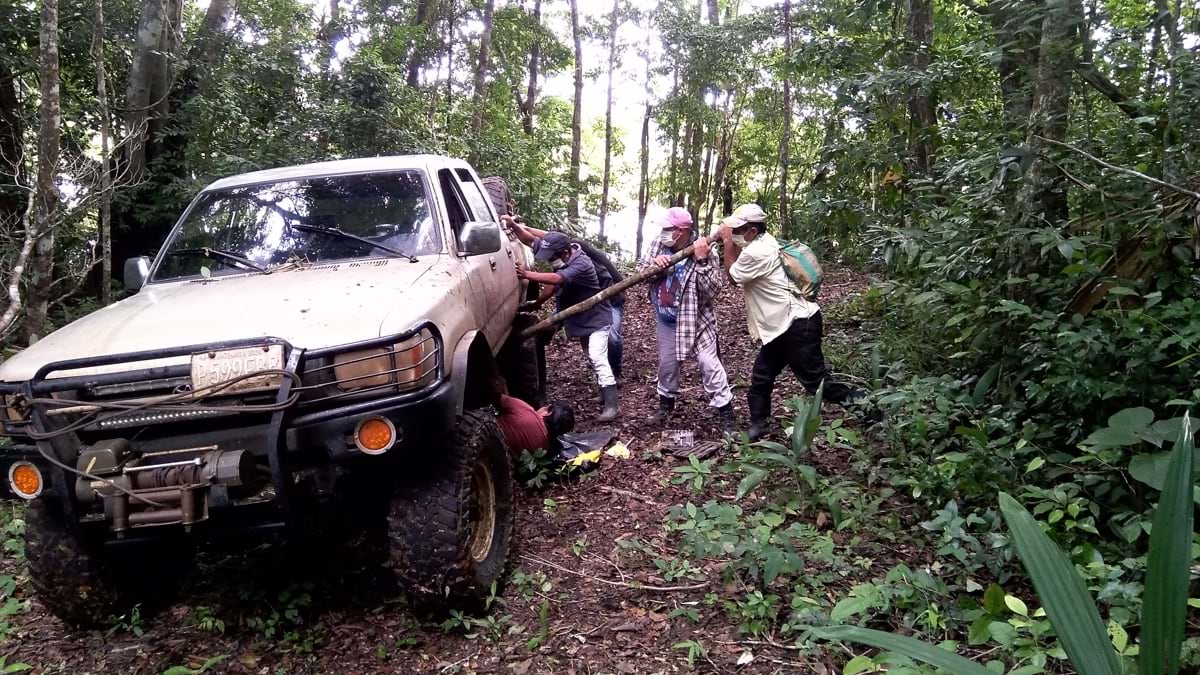
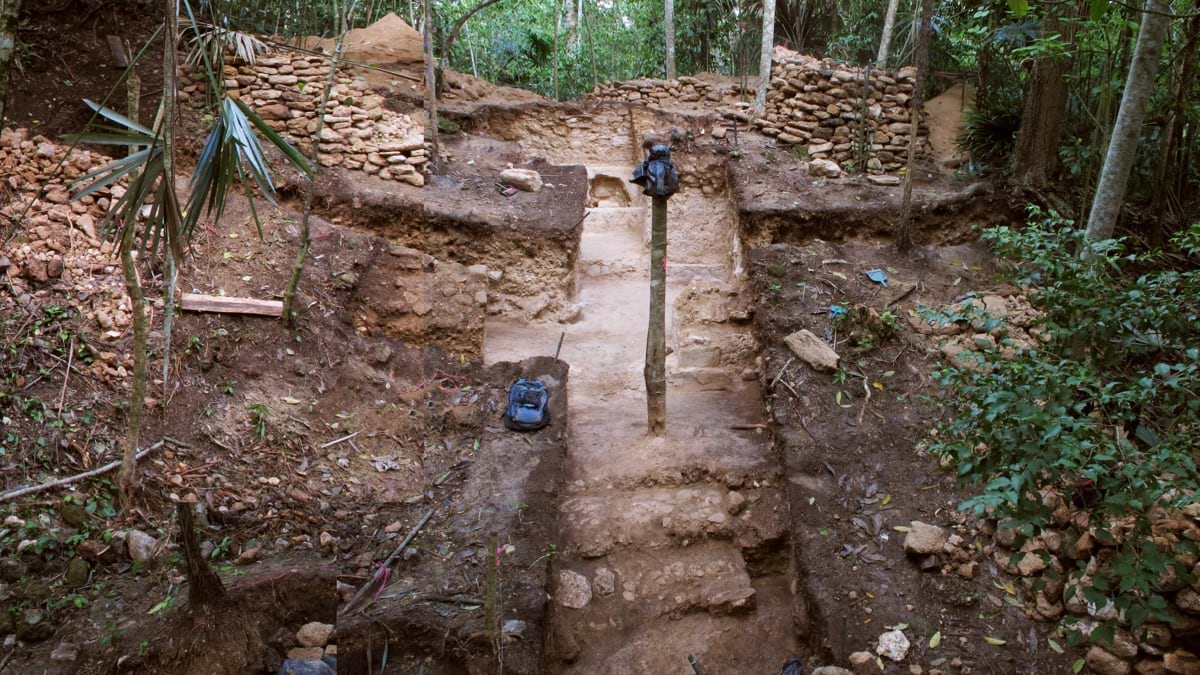
An archaeologist leading a machete-wielding team through the jungle to reveal ancient ruins—it sounds like a movie. But that’s what Marcello Canuto was doing during his 2022 field season in Guatemala’s Petén region. The expedition was guided by a digital map that virtually peeled back rich foliage to reveal likely locations of Maya settlements.
Canuto, who directs the Middle American Research Institute (MARI) at Tulane University, has conducted research using airborne lidar data to map more than 60,000 ancient Maya structures in northern Guatemala. Now equipped with a GPS receiver showing the maps—created with geographic information system (GIS) technology—the team navigates the Maya Biosphere Reserve.
Prior to the summer field season, Canuto and his student, Luke Auld-Thomas, used GIS to analyze existing lidar and satellite imagery to determine the patterns of known Maya sites. They compiled layers of data and classified the terrain into landform types. Then using the advanced analytical capability of random forest regression in ArcGIS Pro, a map was developed of probable settlement sites where they didn’t have lidar data. The mapping exercise made the most of the intelligence they gained from prior lidar data, without the time and expense of capturing more data.
“I would never have risked the effort if I just had a hunch,” Canuto said. The map informed his decision to lead the survey team to a site just eight kilometers from La Corona, where he’s been working since 2008. The 10-hour round-trip trek paid off. There the team found a new site with several structure complexes. “It’s going to be an important site because there aren’t many sites in this area,” Canuto said.
According to Canuto, the GIS maps he took into the jungle using ArcGIS Field Maps have revealed “a level of complexity that we’re just starting to recognize.”
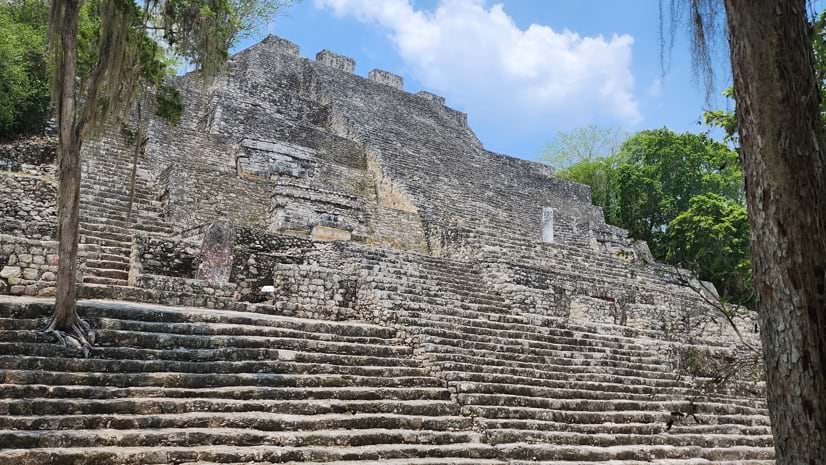
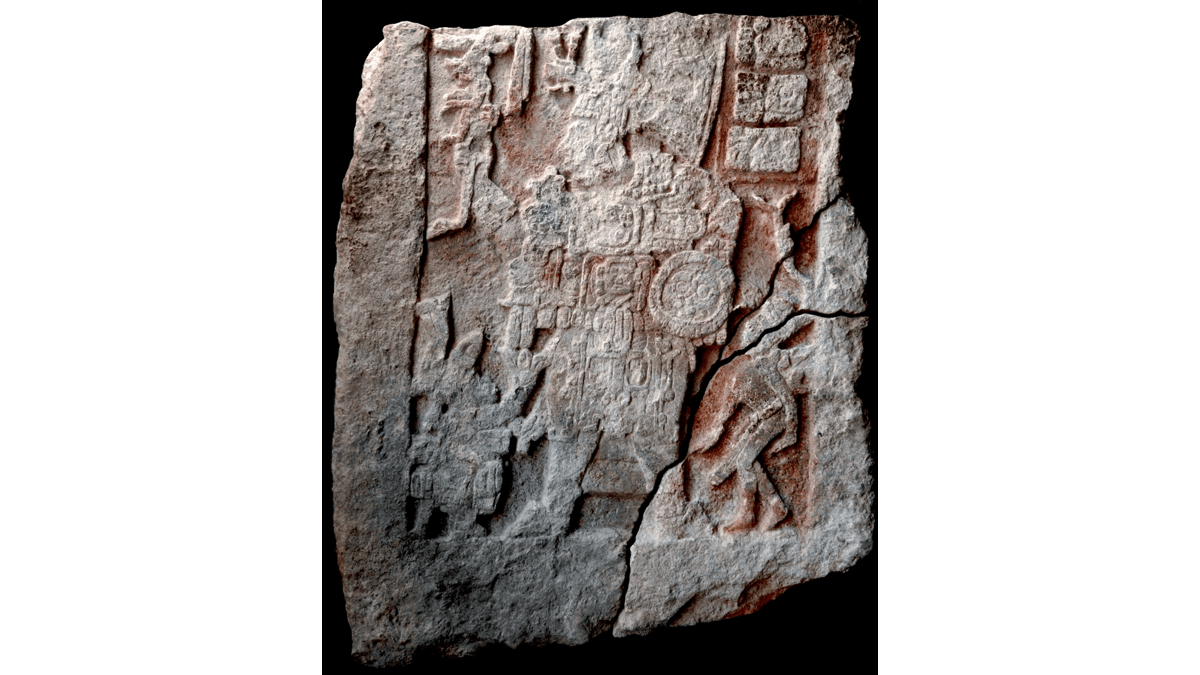
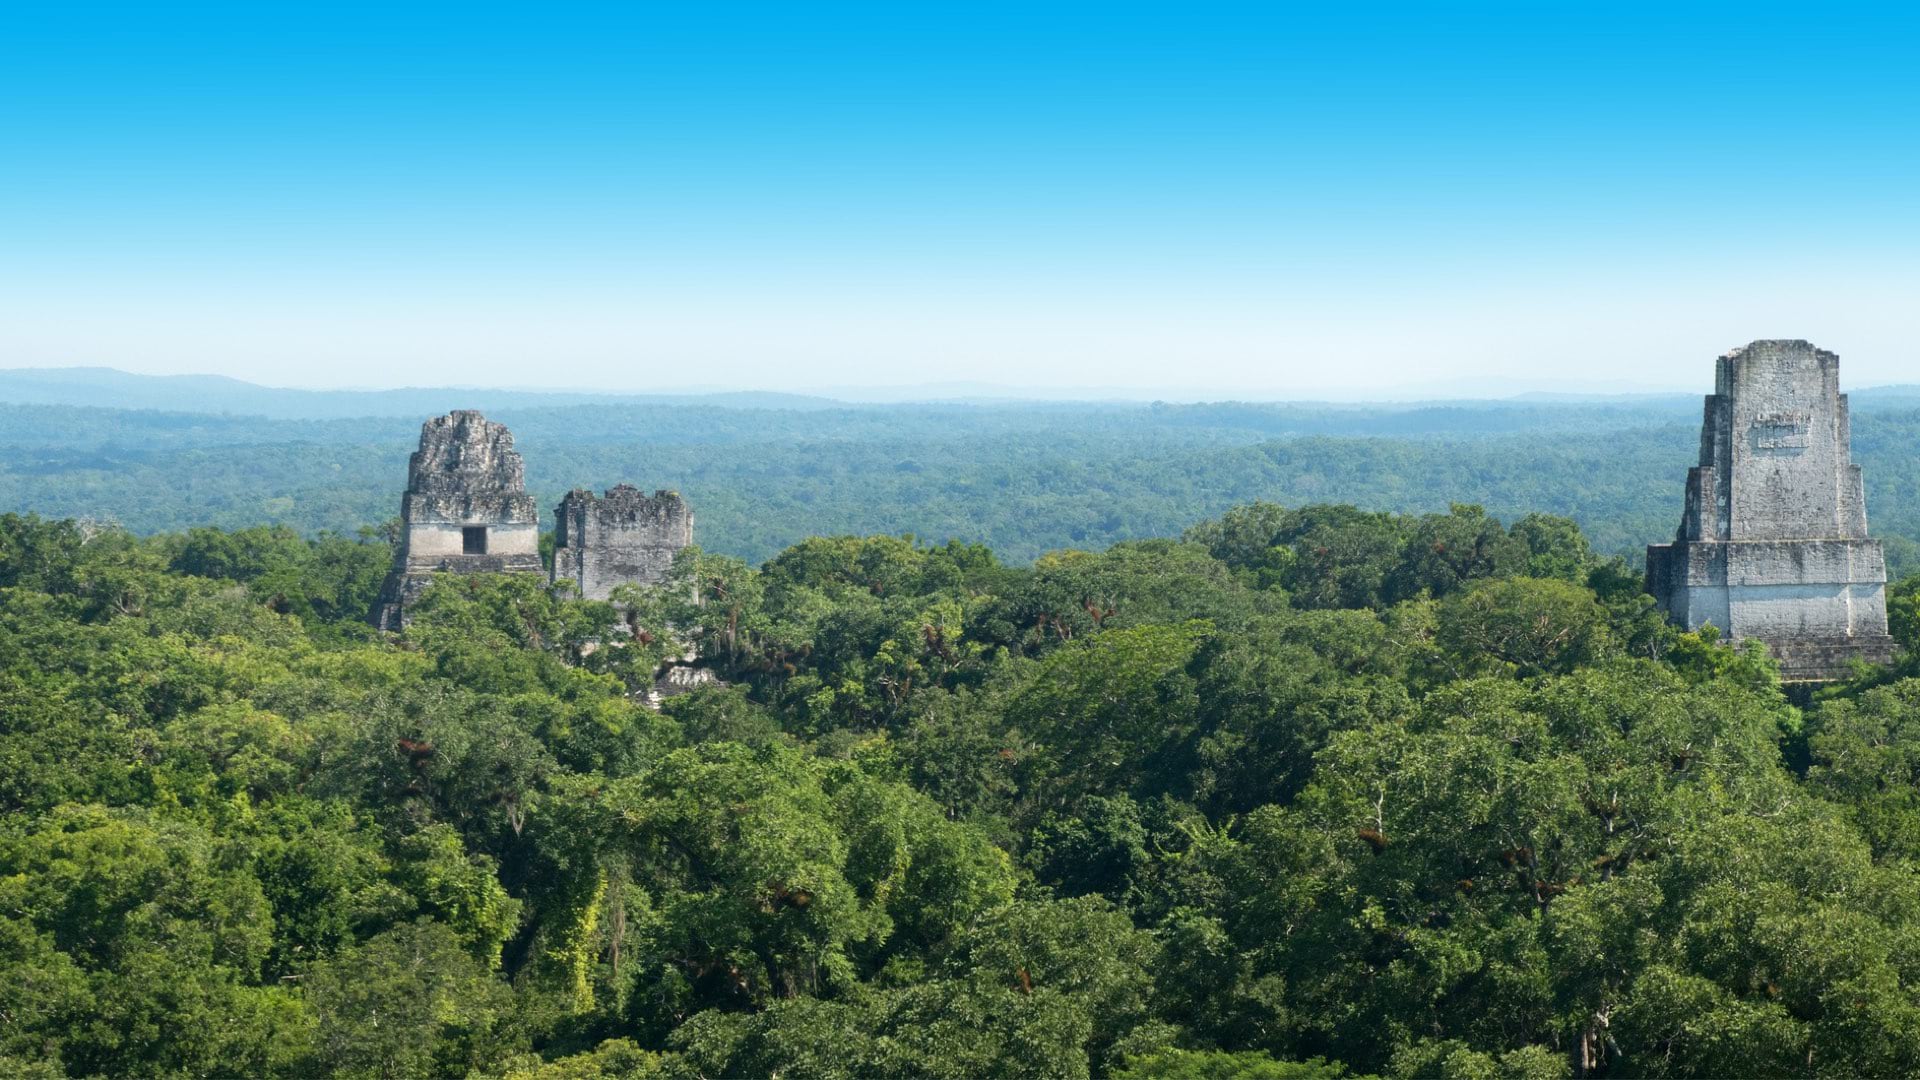
The Maya civilization, a dominant society in Mesoamerica, left quite a legacy: a sophisticated writing and calendar system, imposing architectural structures including pyramids, and advanced agricultural methods. Canuto and his colleagues have been able to map not only the extent of the Maya footprint on the landscape but also the complexity of this ancient society.
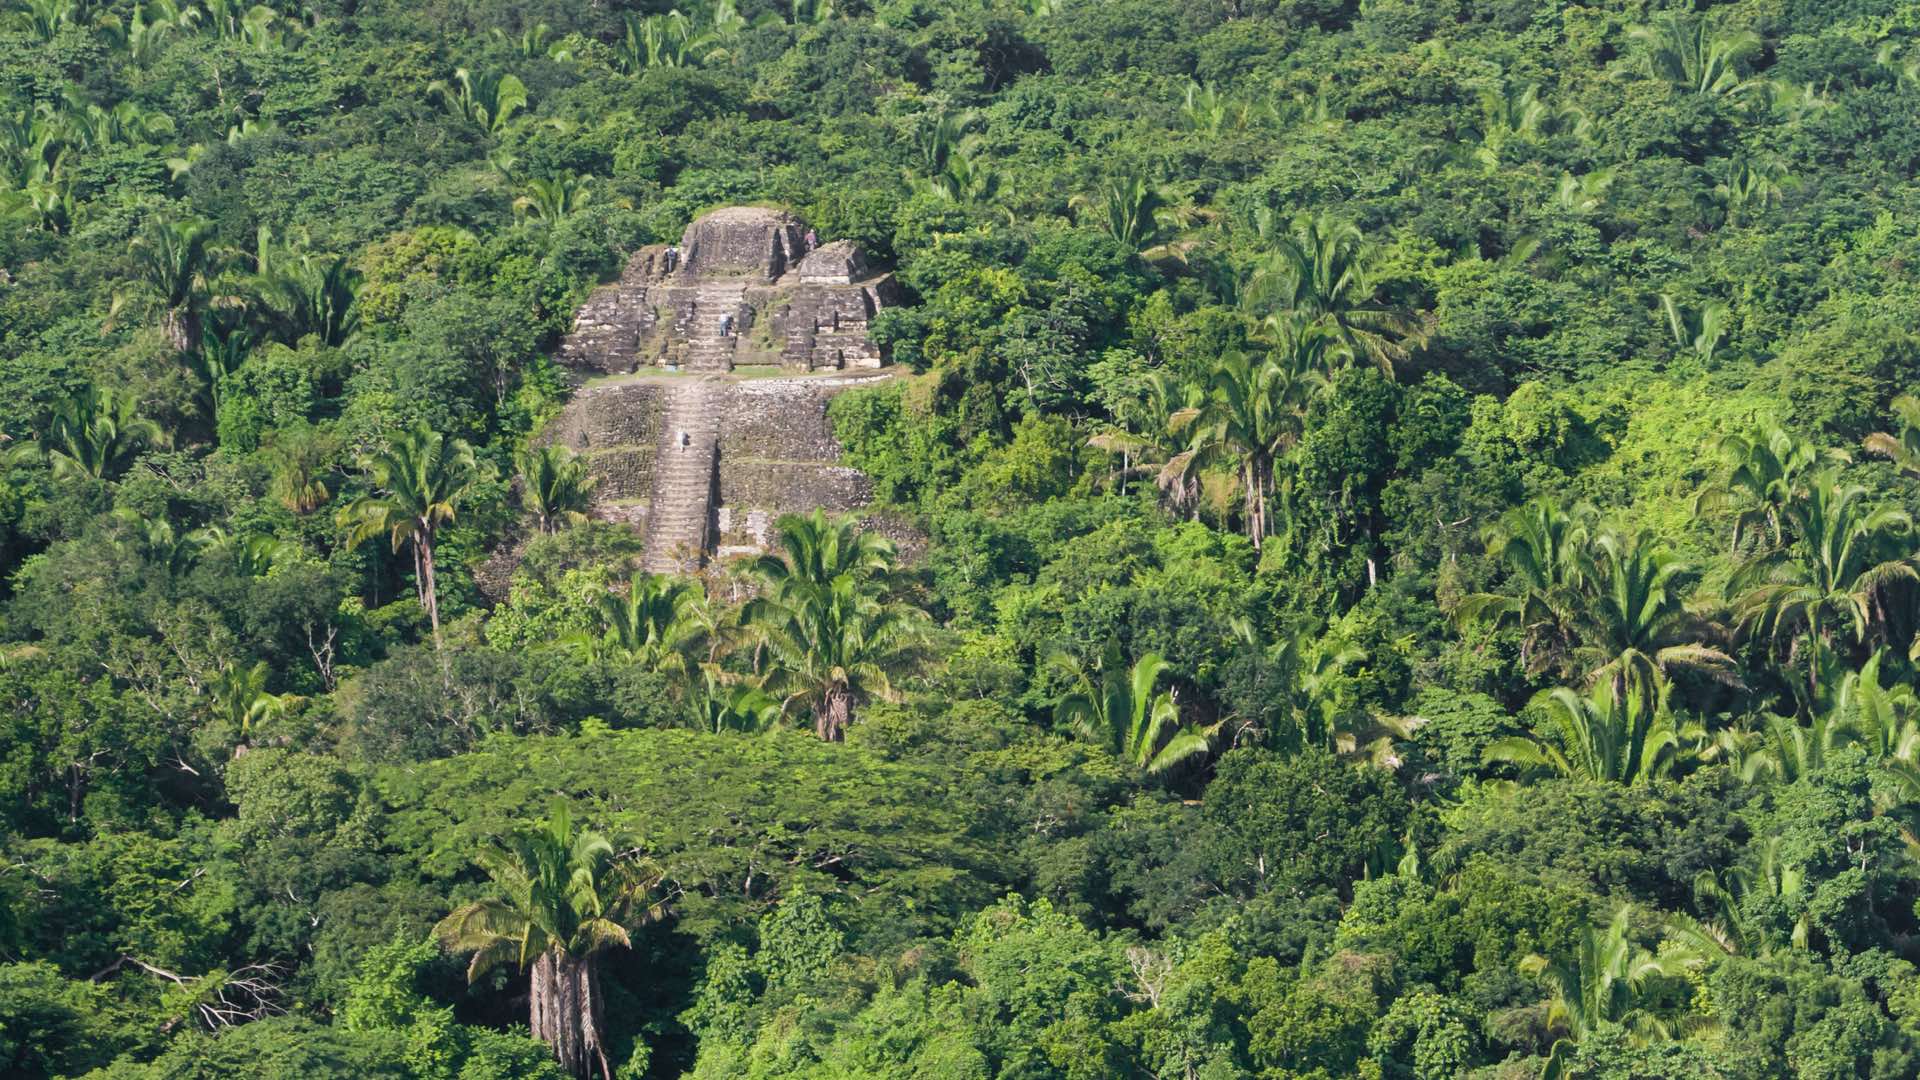
Many large Maya cultural sites had been hiding in plain view. “They’re so big they look like hills, but you can tell these massive platforms are aligned and humanmade,” Canuto said. Archaeologists, such as Ivan Šprajc, studying the structural patterns have realized a relationship between the platforms and the calendar. When the sun passes one corner in February, it’s the start of the corn-growing cycle, and when it passes the other in October, it’s time to harvest.
“The well-designed architecture along with their writing system informs us on their subsistence strategies, which in turn is related to political complexity and development,” Canuto said. “They had a way of coordinating and managing time and people. It’s all neatly tied together.”
Canuto specializes in the Classic Period of Maya culture—roughly 1,200 to 1,500 years ago—an era of big temples and dynamic politics. At La Carona, he has been studying a pivotal shift in which a larger state gained control over a smaller one, using it as a base for expansion. Hieroglyphic texts have helped his team understand that there was a massive alliance and period of stability from 500 to 750 AD.
“We can start to think about the impact of politics and political systems on people’s lives because of these texts,” Canuto said. “We can relate the things in households to see if people were better off before or afterward.”
And the history can be recorded as layers on a map for analysis across space and time to unlock further understanding.
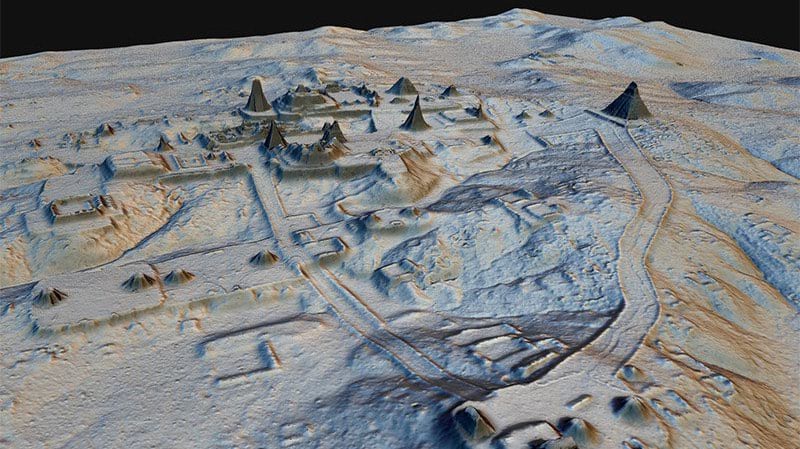
Data collected via lidar, or light detection and ranging, was layered onto a GIS map to show all structures in the region, even those covered by lush forest growth. A lidar sensor sends out billions of light pulses that bounce back to measure vegetation height across wide areas and ultimately detect the contour of the terrain.
“By looking at these data, we can recognize human-made elements such as buildings and therefore learn about where the ancient Maya lived,” Canuto said.
Lidar data is further analyzed and modeled with GIS technology. Comparing the data against the architecture and characteristics of known sites reveals the most likely places of settlement long lost to human memory. The analysis becomes invaluable in learning more about how the Maya civilization lived as they spread across the area starting roughly 3,000 years ago.
“The Classic Maya weren’t conquered by Europeans,” Canuto said. “Their settlements were abandoned long before and in some cases forgotten by those Maya groups who the Spaniards encountered when they first invaded this part of the world.”
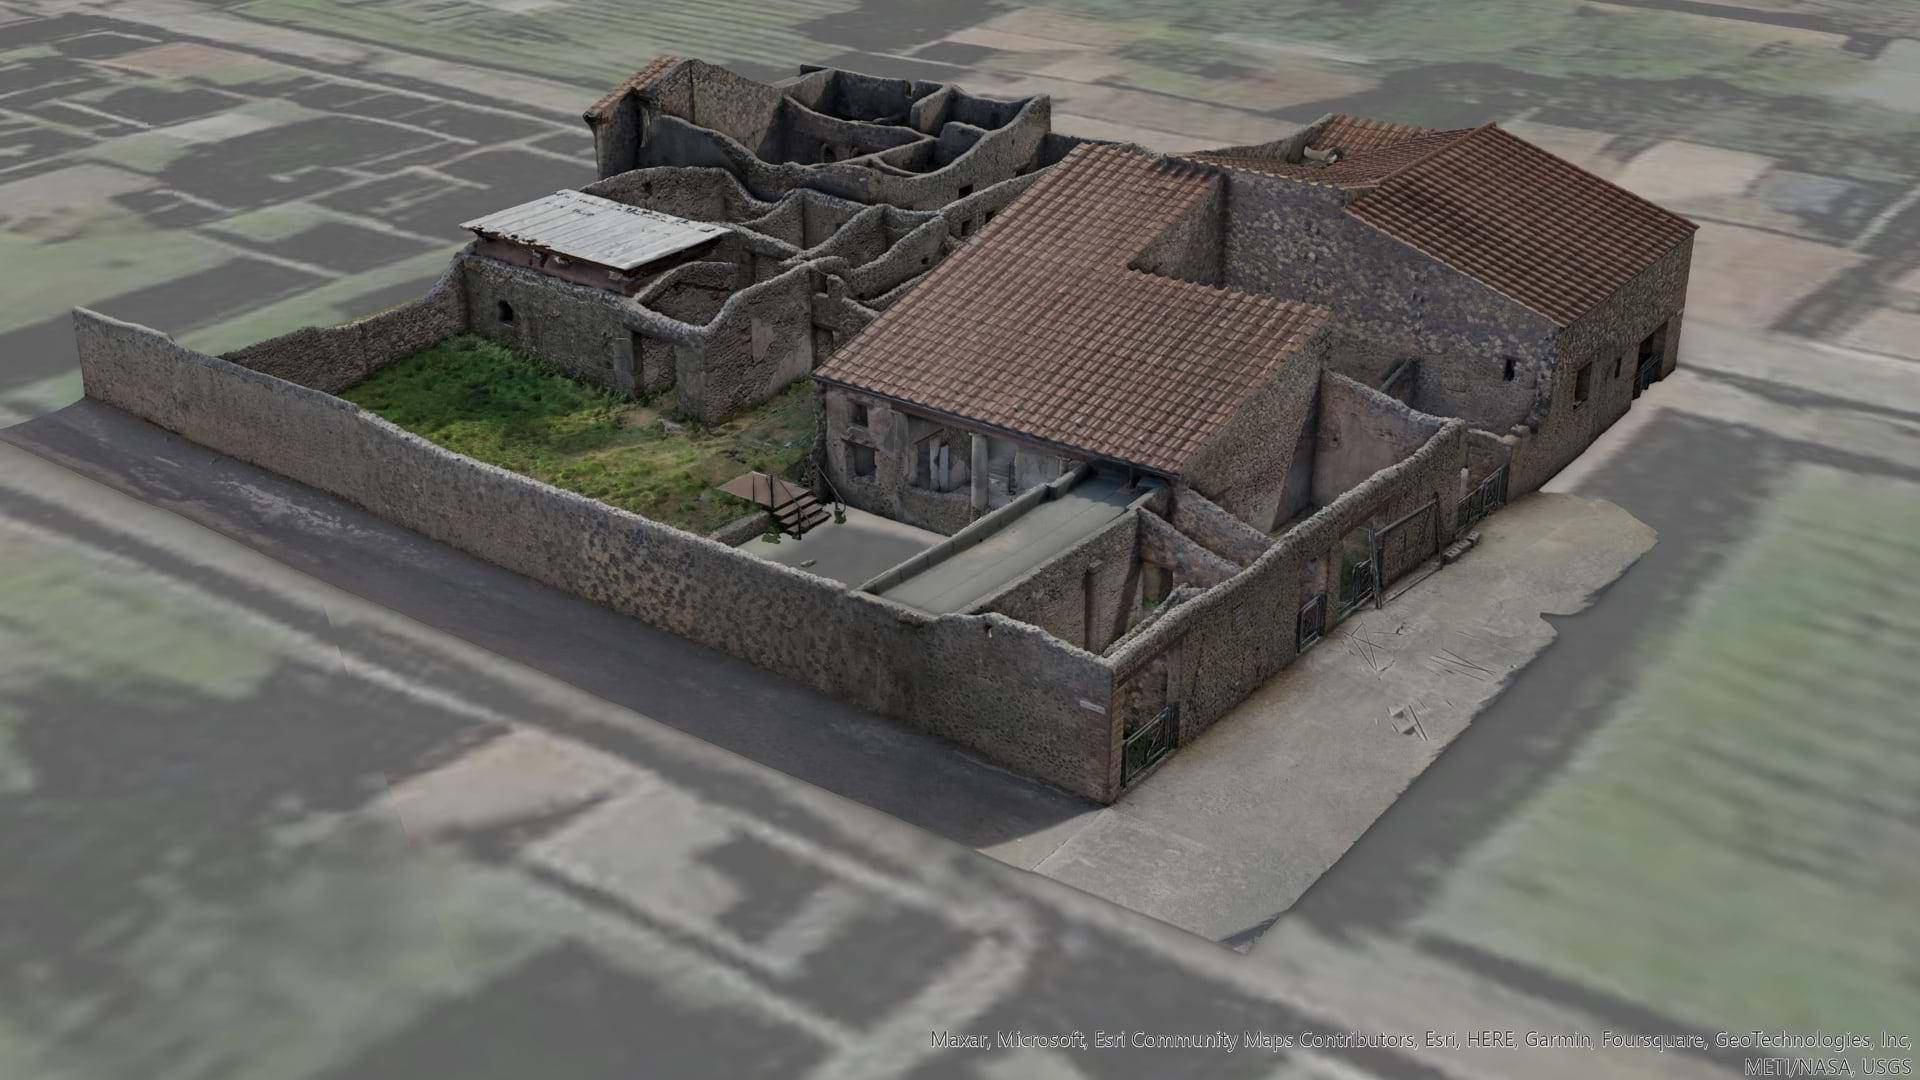
Canuto and his colleagues have been classifying Maya structures on their GIS maps, denoting the location of palaces and temples and where elite residents lived. The map marks ball courts where athletes played and audiences watched. There were markets, roads, highways, and causeways to connect settlements.
“When you look at the landscape, you realize that the society was complex,” Canuto said. “We’re finding places where elites lived, where ceremonies may have taken place, and where the rulers and their courts worked. We’re clarifying our understanding of it all.”
The data-rich interactive maps are also used to ask and answer important questions.
“Did the Maya develop expansive states, were they territorial, or were there a network of states?” Canuto said.
Maya experts continue to ask these and other questions of the data. They have set out to create detailed maps that show all the dimensions of the society in a historical context.
Canuto pointed to the map to show and describe urban centers. “You see this area of Tikal and El Perú?” Canuto said, pointing out an urban area. “It was a hub of activity. They didn’t grow their own food in the center of those cities, and there’s evidence of the movement of bulk goods. A good map tells you much of a society’s story.”
Canuto recently oversaw the expansion of the GIS Lab at MARI, one of the most advanced mapping centers for archaeology, with modernization that included the addition of 10 high-performance computers and the latest GIS technology and remote sensing software. While courses at MARI teach cutting-edge tools and techniques, Canuto likes to remind his students what it was like without them.
“They’re very lucky to see in this way,” Canuto said. “Before, we were racked by doubt about the location of things because we could only see three inches in front of us.”
Now, the GIS Lab builds maps that help researchers understand the region’s indigenous cultures, civilizations, and nature—a focus at MARI since its founding in 1924. At the lab, researchers have high-end computers to analyze lidar, satellite images, and other data to find and assess archaeological sites and natural resources.
Since 2016, when the lab received its first lidar dataset, researchers have surveyed more than 7,000 square kilometers of northern Guatemala. Previous site surveys had covered just 700 square kilometers.
The smart map of the Maya civilization that MARI and its partners are creating will eventually extend to more areas of Mexico and Guatemala, creating an even more holistic picture of ancient societies in the region.
“We now have a map that is way larger than what we could explore in a single field season or even decades,” Canuto said. “This is just a way to get a first draft of what we think is out there. Then with our eyes and legs, we can confirm and map what we find.”
Learn more about how GIS is used to reveal hidden patterns and relationships, applying spatial analytics and data science.

June 27, 2018 |
November 17, 2020 |
January 12, 2023 |