

November 9, 2021 |
Christopher Thomas | GIS for Good
April 6, 2023
Avoiding automobile crashes starts with attentive drivers. But there’s also a growing call to reengineer streets where fatalities and serious injuries chronically occur.
Road safety is a national priority. “Traffic crashes cost tens of thousands of American lives a year—a national crisis on our roadways—and everyone has an important role to play in addressing it,” said US secretary of transportation Pete Buttigieg in February 2023 at the launch of a call to action. “Today we are asking all Americans—including private industry, nonprofit and advocacy organizations, and every level of government—to join us in acting to save lives on our roadways.”
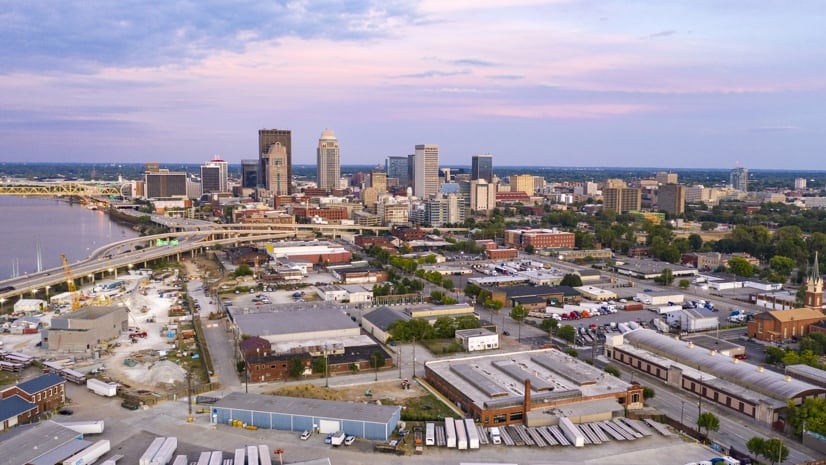
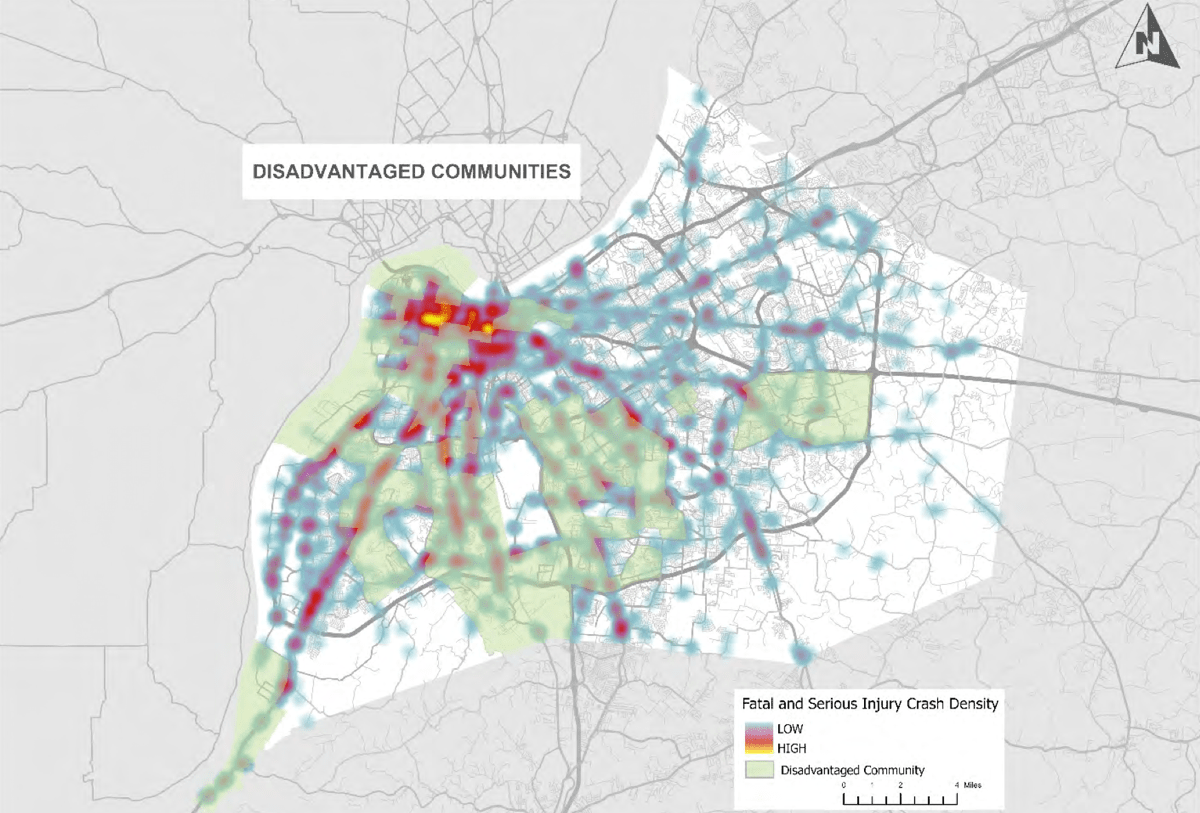
In Louisville, Kentucky, the government has made a commitment to end road fatalities by 2050. To start this initiative, staff used geographic information system (GIS) technology to identify high-risk locations based crash analysis and roadway design. These locations were then compared to data on vulnerabilities in communities. The conclusion is this: Harm has happened at higher rates in disadvantaged areas.
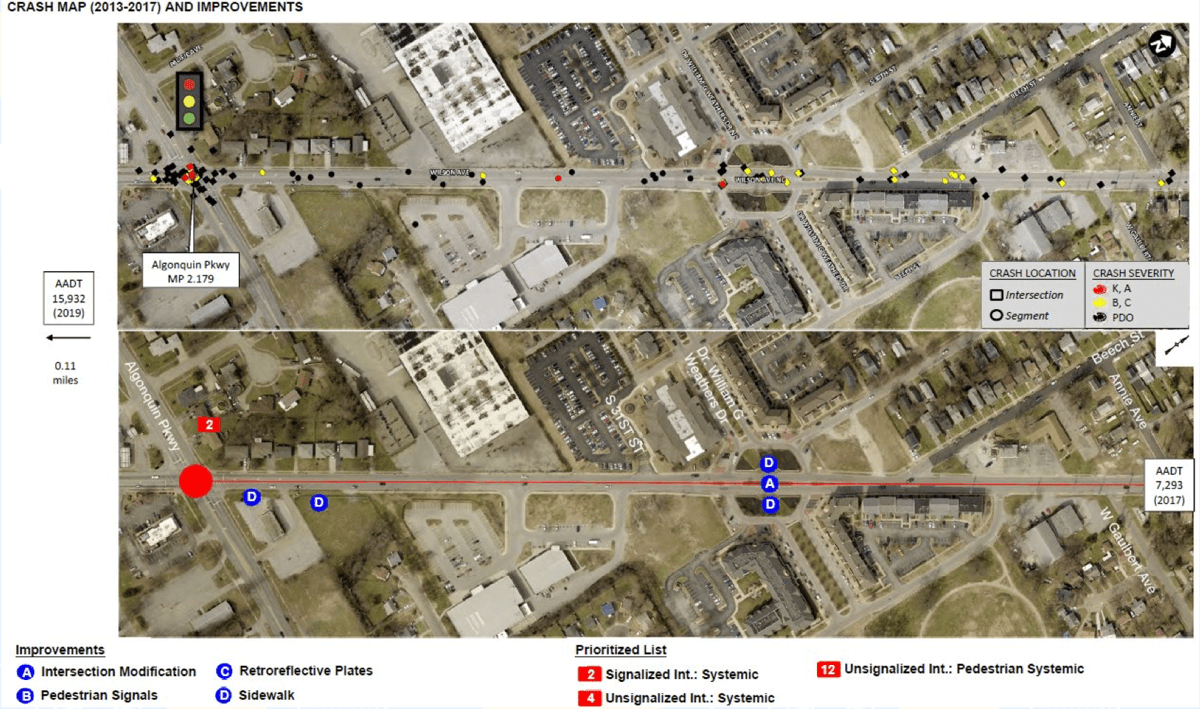
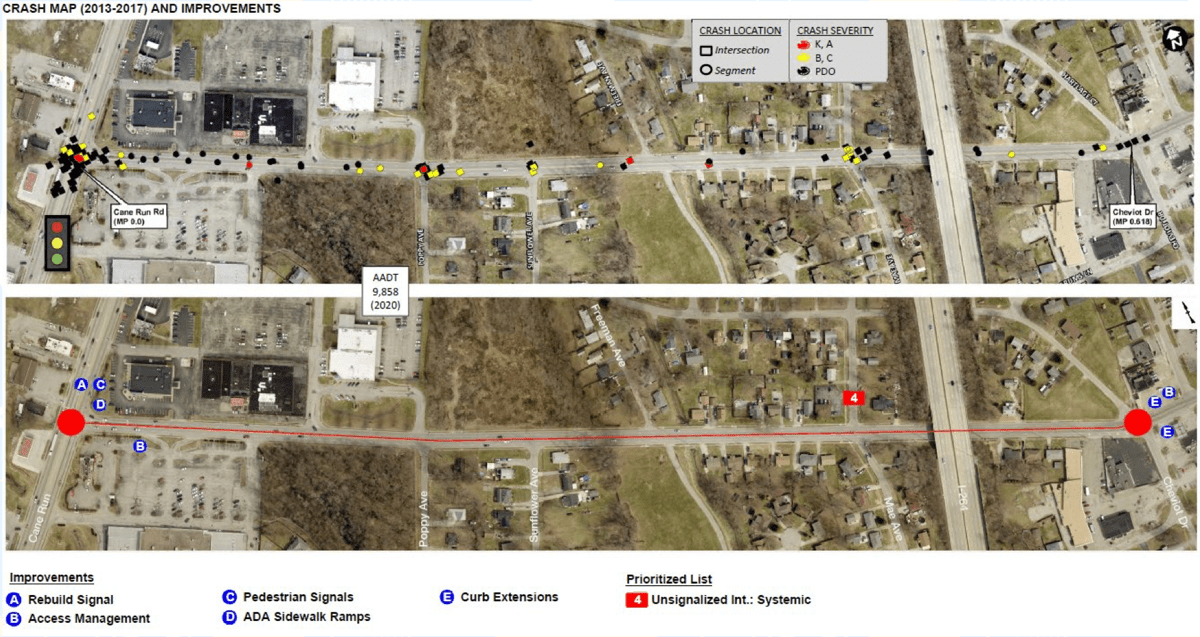
This data and accompanying maps then became Louisville’s call to action. The analysis appeared in the city’s Safe Streets and Roads for All (SS4A) grant application, developed in partnership with the Kentucky Transportation Cabinet and Palmer Engineering. The city now has a $21 million implementation grant from the US Department of Transportation (US DOT) to put planned changes in place.
The projects tackle the 10 corridors where safety improvements will have the greatest impact.
“The work to prioritize those projects was all a GIS exercise,” said Amanda Deatherage, the transportation planner supervisor for Louisville Metro Government. “GIS analysis is woven through the work that we do. It’s the foundation for a lot of our decision-making.”
When Louisville merged with Jefferson County in 2003, Kentucky’s largest city doubled its population, and its area grew sixfold. GIS helped the government come to terms with its larger size. The GIS team gathered data to provide the new picture of residents and services.
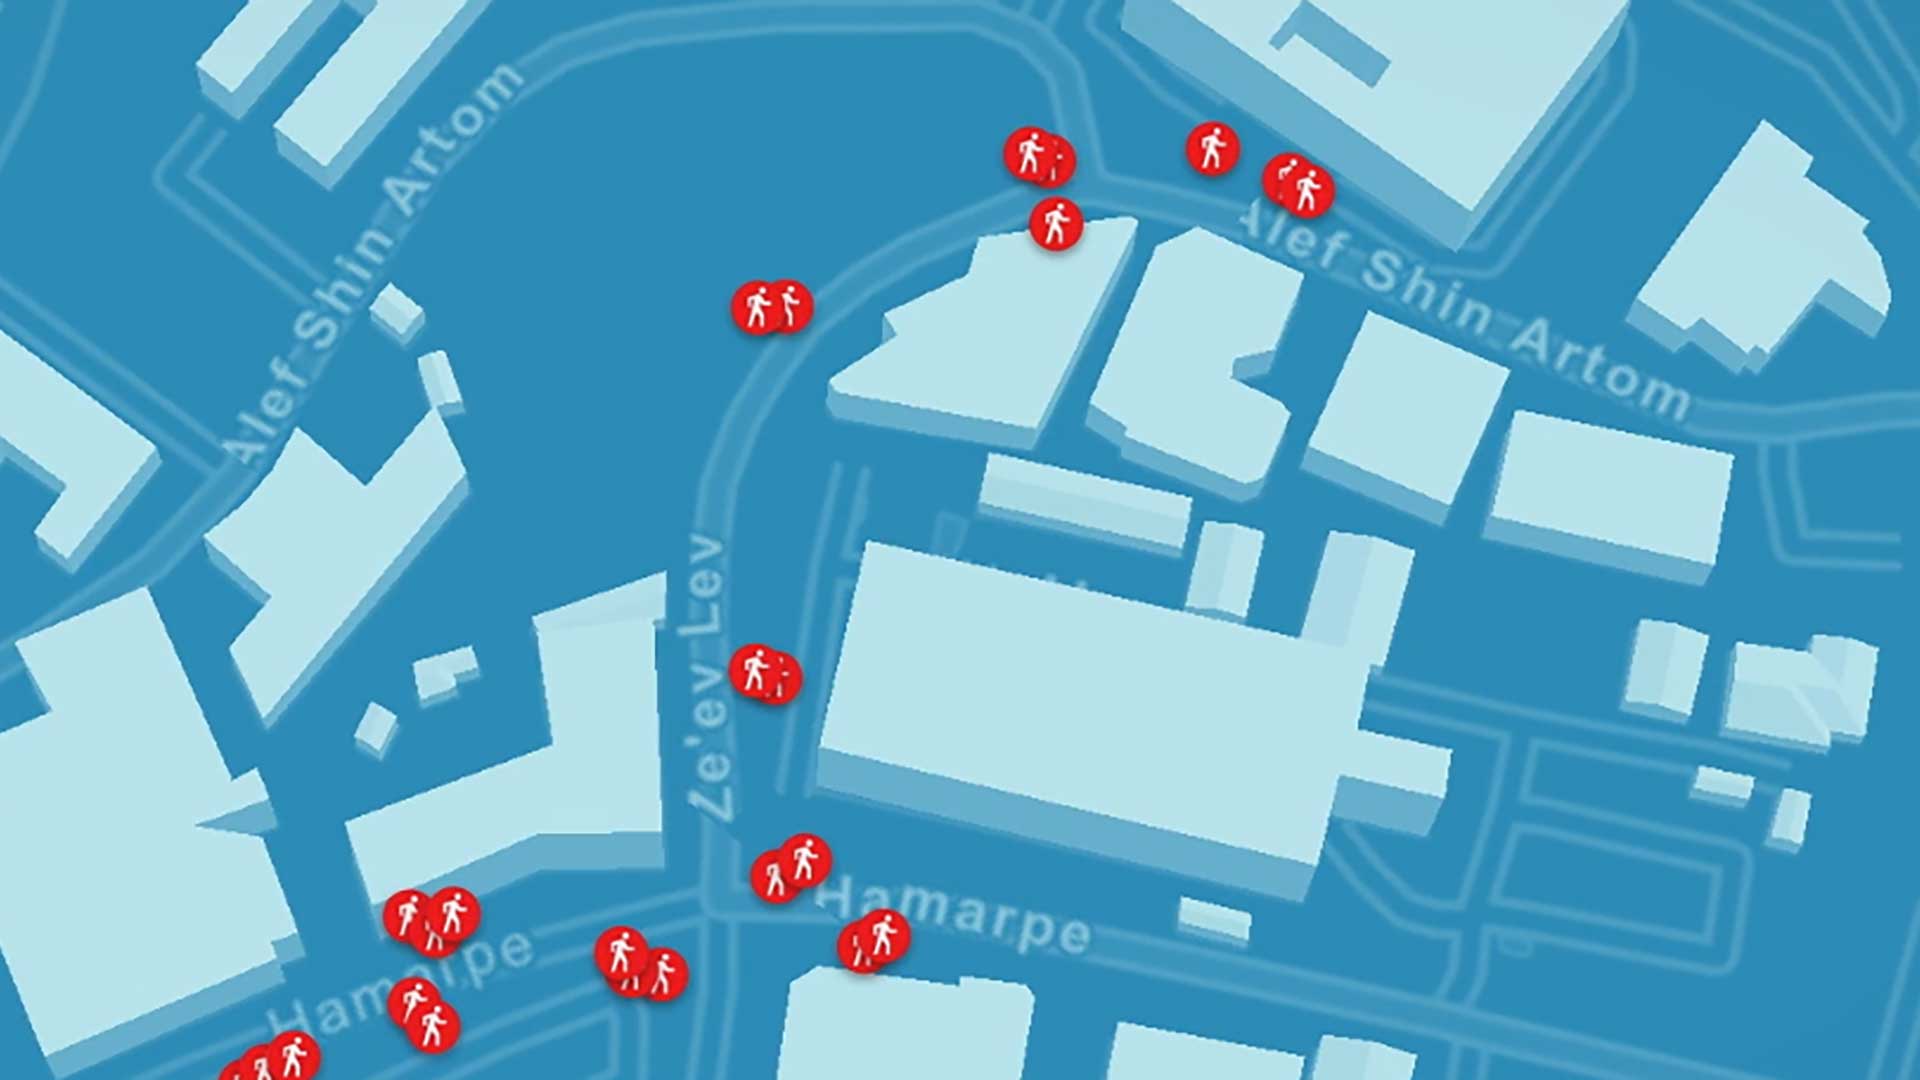
The city’s department of public works mapped traffic fatalities and suspected serious injuries. It found that more than 900 people had lost their lives on Louisville’s roadways since 2014, including 185 pedestrians. Staff then looked at hot spots and patterns.
This awareness of fatalities and serious injuries led the city council to pass its Vision Zero Louisville ordinance. It marked a shift from the conventional reactive approach to traffic incidents. Instead, the city used the ordinance to look at the many layers of protection it could provide to both prevent crashes and reduce injuries.
“Our early Vision Zero work focused on educating the public about where fatalities were happening, using GIS,” Deatherage said. “Now, we want to build support for projects to improve the transportation network and reduce the likelihood of crashes happening at all.”

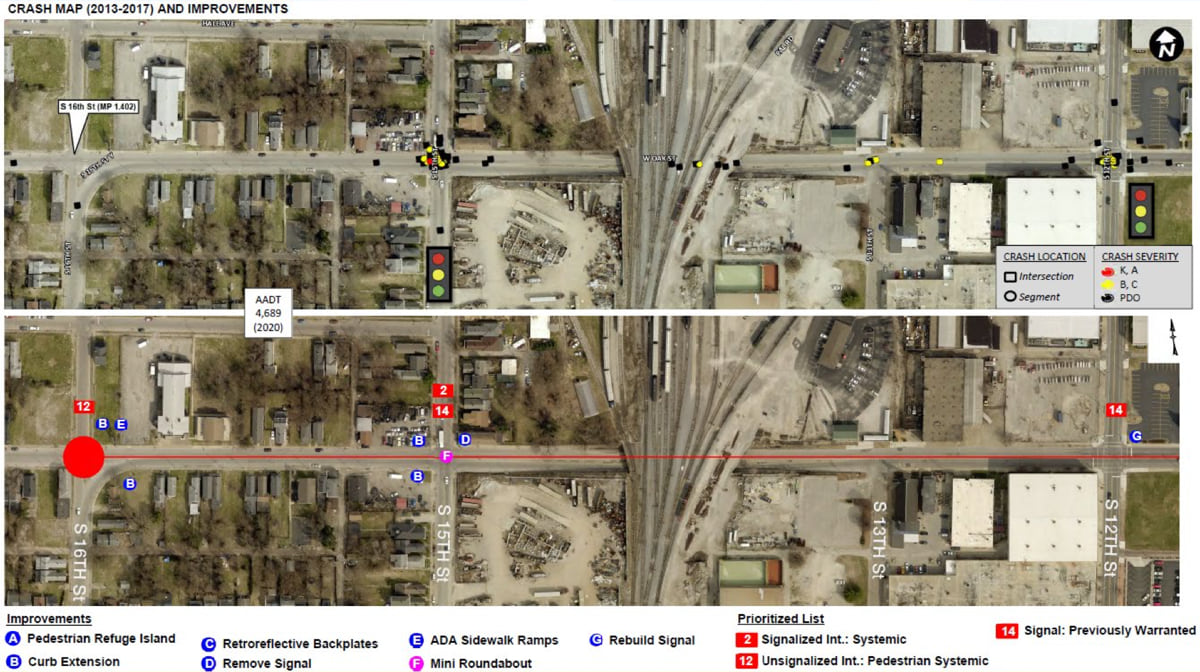
The 10 roadway corridors included in the SS4A-funded project will benefit from an array of safety improvements, including the addition of better lighting, medians, and bicycle lanes. All project locations will be rightsized (e.g., converting a four-lane roadway into a three-lane roadway). Rightsizing is a Federal Highway Administration proven safety countermeasure that promotes safer speeds. It often adds a dedicated left-turn lane and provides enhanced mobility and access for all road users.
When the Vision Zero Louisville ordinance passed in 2022, Claire Yates, a transportation planner, became the first program manager dedicated full-time to Vision Zero. Early on, she placed an emphasis on communicating using maps and visualizations.
She mapped 16 priority locations, using maps to help leadership understand the changes needed. Louisville staff wanted to modernize how they tell the story of where incidents occur. Crash data is critical, but it doesn’t encompass the entire story. GIS seeds solutions by providing greater context.
“We have a lot of elected leaders to answer to and a lot of priorities,” Deatherage said. “We can’t fund everything at once. We’re trying to leverage technology in a way that helps us be more transparent to the public. We also want the public to give input on what we should focus on.”
Data analysis of potential road safety projects incorporated data from US DOT, the Kentucky Transportation Cabinet, and internal sources. Social vulnerability data from the ArcGIS Living Atlas of the World gave Louisville the data it needed to focus on supporting the Justice40 Initiative. The initiative seeks to address chronic underinvestment in disadvantaged communities, with at least 40 percent of federal funding dedicated to closing gaps. Of Louisville’s 10 safety improvement projects, 6 focus on disadvantaged places.
USDOT’s recent call to action comes a year after the National Roadway Safety Strategy was released. This document defined a five-pronged safe system approach to reducing roadway fatalities. It includes safer people, safer vehicles, safer speeds, safer roads, and postcrash care.
“We must do everything in our power to make our roads safer for everyone, regardless of how you travel,” said Louisville mayor Craig Greenberg in a statement. “Vision Zero is a new way of thinking, and it is achievable.”
With projects in place to construct safer roads, Vision Zero Louisville next focused on safer speeds.
“We identified and filtered the highest posted speed limits and evaluated them for crash reduction,” Yates said. A preliminary audit identified seven stretches where the posted speed limit was above 35 miles per hour. From 2016 to 2022, four people were killed and 27 people were seriously injured on those stretches. The city is now going through the process of reducing speeds on those roadways.
As transportation safety advocate Janet Heston of Matthew’s Bridge noted at Louisville’s inaugural commemoration of World Day of Remembrance for Road Traffic Victims, “No reset button can be pressed to bring back those killed. The best way to honor them is by making our streets safer.”
Learn more about how GIS improves transportation and how Esri’s Vision Zero solution helps municipalities deliver safety results.