We're starting to get a strong cadre of scientific engagement to address the broader holistic issues at the study site.
Scripps Institution of Oceanography
Eric Terrill
June 21, 2021
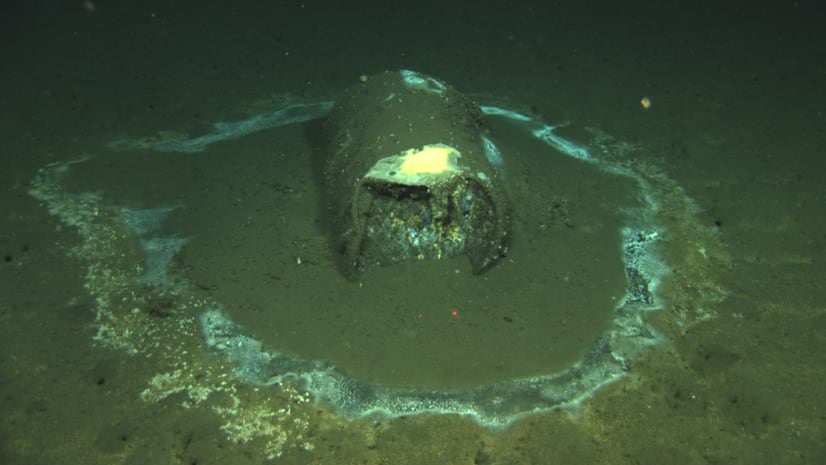
The research crew that had hastily assembled off the coast of Santa Catalina Island in Southern California, some 3,000 feet above the ocean floor, could hardly believe what they were seeing. They knew they would find dumped barrels resting on the seabed, they just didn’t realize how many. Years earlier scientists had detected DDT pesticides seeping into underwater sediment and found traces in the fat of fish. A targeted dive even provided alarming video evidence of barrels degrading, ringed by fluorescent traces of leaked materials.
Now, the technology was available to do a comprehensive survey to determine just how sprawling the toxic graveyard might be, using a geographic information system (GIS) to lay it out for anyone to see on a map.
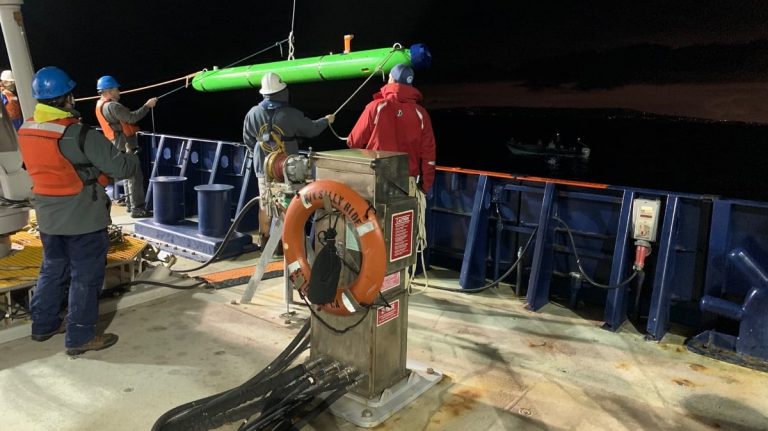
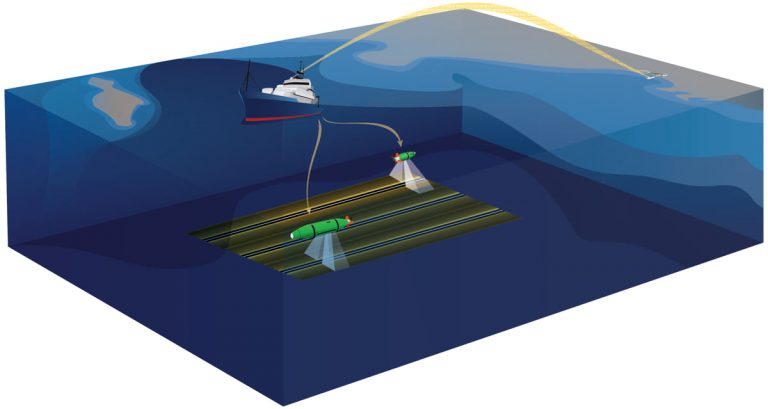
For two weeks in March, researchers from the Scripps Institution of Oceanography at UC San Diego worked day and night mapping 46 square miles of the ocean floor between the island and the coast of Los Angeles with the help of two underwater autonomous vehicles equipped with sidescan sonar that could skim the bottom of the sea, emitting sound waves and using acoustics to detect any sign of barrel-shaped objects on the sea floor.
What they found: more than 27,000 of the metal cylinders resting on the sea floor. That figure included many arrayed in a line as far as 11 miles between San Pedro Harbor and the island, indicating that the barrels may have been methodically dropped off a barge or moving boat.
“In hindsight, we shouldn’t have been surprised,” said Eric Terrill, who led the mission as chief scientist and directs the Marine Physical Laboratory (MPL) at Scripps Institution of Oceanography. “But it’s one thing to read historical reports that there may be tens if not hundreds of thousands of barrels on the seabed. It’s another one to start counting those in acoustic sidescan data,” he said.
That large number represents only what they were able to map in a short window of time.
While 46 square miles may sound like a significant area to cover, and it is, “there’s a lot more area of the San Pedro Basin to go,” said Heidi Batchelor, a GIS analyst at Scripps who participated in data processing on the expedition. In the end, the crew ran out of time funded and allocated to them for use of the ship, “not out of debris.”
Montrose Chemical Corporation was the United States’ largest manufacturer of DDT pesticide, and for years it was suspected of dumping barrels in addition to the chemicals it sent into the ocean via sewer pipes. The popular assumption, at the time, was that the pesticide would be diluted and dissipate in the water. It didn’t.
In a sprawling Los Angeles Times investigation last year, the newspaper’s journalists discovered the existence of shipping logs showing the company had dumped more than 2,000 barrels a month into the Santa Monica Basin in the years following World War II, estimating there could be as many as half a million on the sea floor.
In less than five months of preparation, researchers boarded the R/V Sally Ride, the newest addition to Scripps’ fleet of research vessels, to see what was below, at the urging of federal lawmakers and the National Oceanic and Atmospheric Administration (NOAA). NOAA’s Office of Marine and Aviation Operations and the National Oceanographic Partnership Program collaborated on the project.
“Normally, these vessels are distributed across the world doing global oceanographic science. So we were fortunate to actually have the R/V Sally Ride available to us in Southern California,” Terrill said.
Even as DDT’s popularity for combatting mosquitoes and agricultural pests remained strong, there were stark reminders from scientists that no one really knew the long-lasting effects of the chemical on the natural world. Biologist Rachel Carson’s “Silent Spring” warned of a future without songbirds and other species as the chemical wreaked havoc on a world not properly protected. The book helped usher in the modern environmental movement in the 1960s. By 1972, the US had banned DDT’s use. However, there was still demand from other parts of the world and Montrose kept operating until 1982.
Years later, first in 2011 and again in 2013, UC Santa Barbara Professor David Valentine discovered concentrated levels of DDT, or dichlorodiphenyltrichloroethane, in ocean sediments between Los Angeles and Santa Catalina Island, and cameras captured images of at least 60 leaking barrels at the site where Scripps researchers focused their search. They set sail in mid-March to see how many barrels they could find.
“10 years ago, it would have been impossible to do the type of work we did on this expedition because the technology just wasn’t there,” Terrill said.

Despite amassing more than 100 gigabytes of sonar data, the data set itself wasn’t so big it couldn’t be managed. The challenge was that there were a tremendous number of barrel-like objects in a relatively small area, Batchelor said. Researchers didn’t want to overlook anything or risk counting the same barrel twice. They also wanted to ensure that they counted and mapped just what were barrels and not other objects. They sought help from Scripps colleague Dr. Sophia Merrifield, an associate researcher who specializes in machine learning, to accurately characterize objects in imagery. And with her help their results greatly reduced anomalies.
“We were able to immediately rule out any kind of electrical noise, computer glitch, or issue with sensor settings in the data,” Batchelor said of their confidence in the results. “There’s no gray area there. There are objects on the bottom.” And those objects are all consistent with the size and shape of barrels such as used for dumping of DDT. Exactly what the barrels contain, whether DDT or something else, will require separate research.
While the search for barrels turned out to be far less of a hunt since there were simply so many, mapping them still proved challenging because of the need for accurate results.
“Resolution often matches to the scale of map you might be using. If you’re looking at a map of the US, you aren’t looking at individual street signs. But in this case, we needed to actually get that granularity to be able to map out objects that were just a few feet in size,” Terrill said.
That meant as much as two-to-three-centimeter resolution in portions of their survey area, a uniquely high level of resolution given the large area mapped, to ensure the accuracy needed for the work they were doing, Batchelor said.
There was a heightened sense among the crew that the expedition would require solid analytic tools to defend the provenance and quality of the data.
“One thing we wanted to be very careful about is not alarming the public. As scientists, it’s our responsibility to have defensible data provided to the public and the decision-makers,” Terrill said.
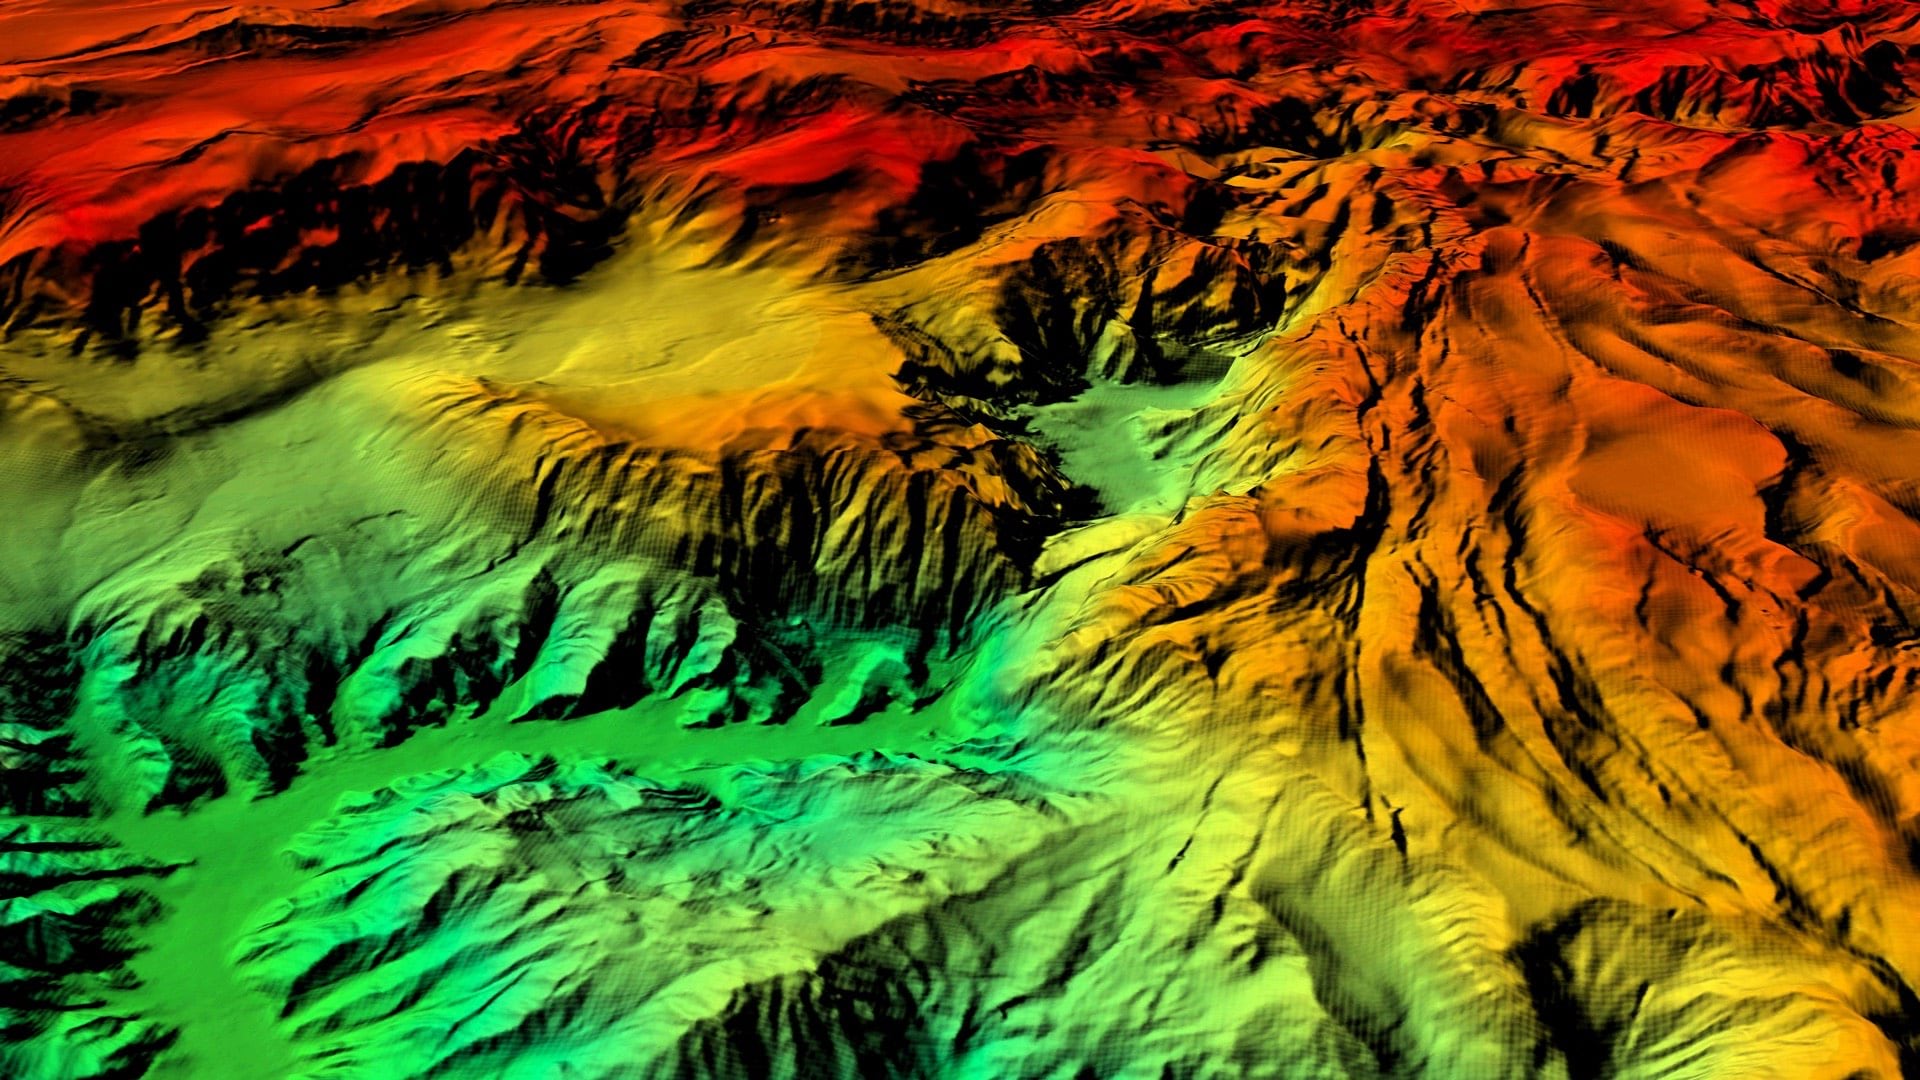
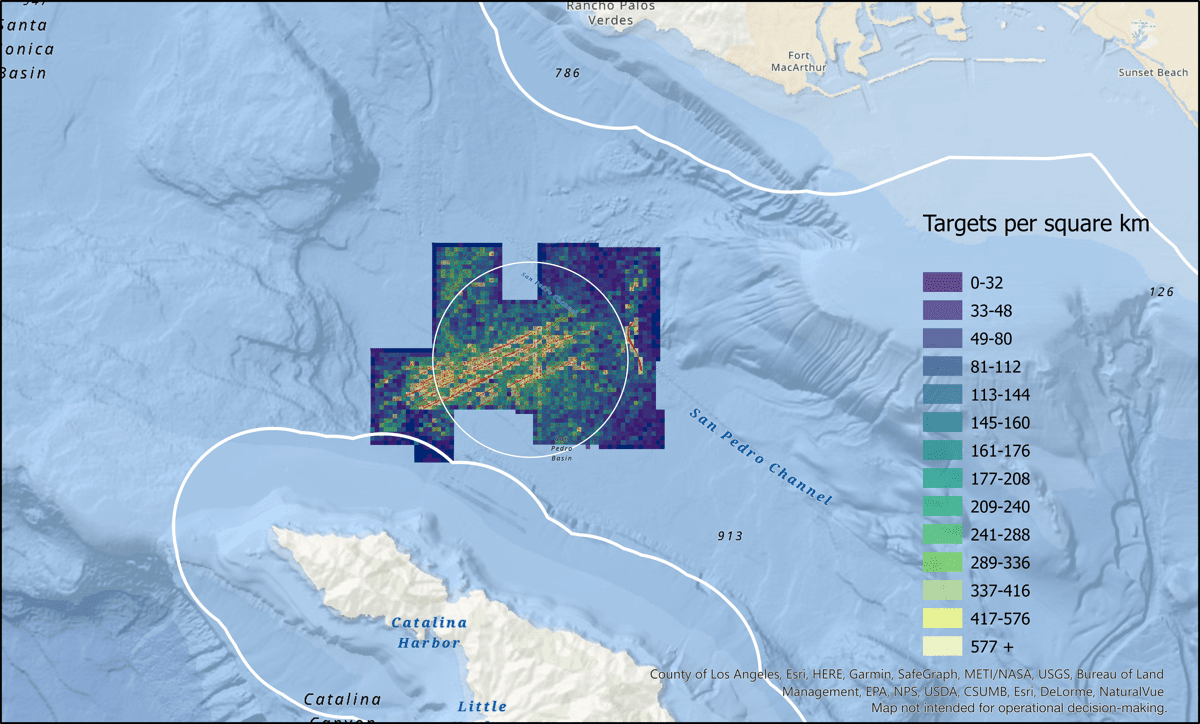
“Really understanding the spatial distribution of the dumpsite was very important to us here,” Terrill said, as was communicating the findings. That included a GIS heat map of barrel locations providing an accessible depiction of where the highest density of debris existed.
We're starting to get a strong cadre of scientific engagement to address the broader holistic issues at the study site.
The first step was a typical spatial analysis, using the “nearest neighbor” test to see if the barrels were clustered together or not.
“They were very clustered,” Batchelor said. “They’re in linear batch areas and big concentrations, but we needed to prove it, so we ran the data through some spatial statistics.”
When you have more than 25,000 potential objects to plot, though, it can be difficult to see, so Scripps analysts made a grid.
“Then we were able to do count per fishnet grid cell. And then once you have that, you have free reign to visualize it however you like,” Batchelor said.
“In the end you get one picture.”
That picture, in the form of a map the team created with GIS, has helped the public understand the magnitude of the problem.
As for the problem itself, it won’t be solved overnight. Scientists are still in the early stages of understanding what lays in front of them and what will need to be done, including how or if any of the toxic contents on the seafloor will be exhumed and determining the contents of the barrels. “We’re starting to get a strong cadre of scientific engagement to address the broader holistic issues at the study site,” Terrill said.
“All along, we went into this trip knowing that the data we collected would inform a broader strategy of response to the area. And so, what we have in hand now is the ability to know where to go next.”
Learn more about the ocean science capabilities of GIS.