State and Local Government Open Data Sites Share COVID-19 News, Resources
By Cassandra Perez and Maria Jordan
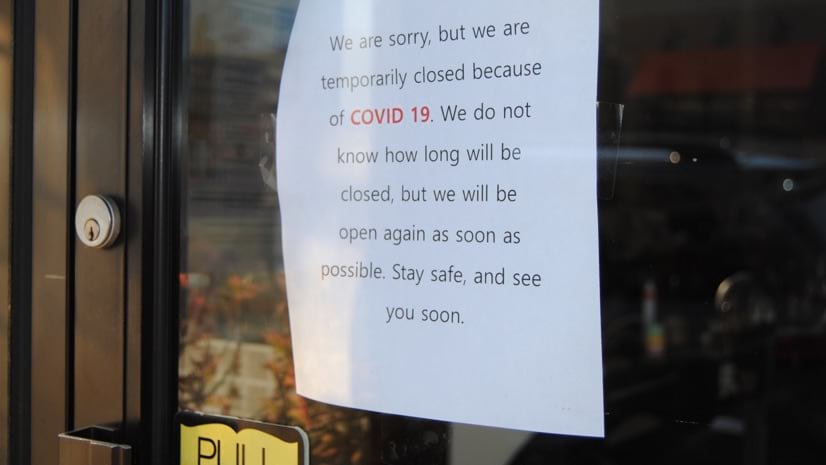
While many are tuning into news stories about the global spread of coronavirus disease 2019 (COVID-19), they also need to know how the pandemic is affecting their neighborhoods and cities.
In response, many state and local governments and agencies are creating open data sites to share maps and information about community spread, hospital occupancy and nearby testing stations, school closures, childcare facilities for essential workers, food banks and grocery stores, as well as social distancing updates.
Even in ordinary times, open data sites increase transparency with the public and help build trust in local governments. They are especially important now, giving leaders a way to communicate up-to-the-moment news and resources, and interact with residents.
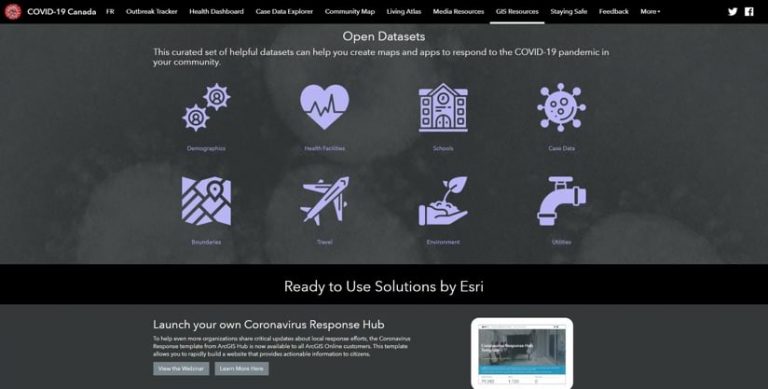
Across the country, we are seeing hundreds of examples of open data sites built using ArcGIS—the platform used to create the first COVID-19 dashboards including those from the World Health Organization and Johns Hopkins University.
Officials in Montgomery County, Pennsylvania, established its hub site when the county had its first case of COVID-19 in early March. This initiative began with a simple story map showing the location of COVID-19 cases in the state and county, and then evolved into a full hub site with maps, resources, and information on the pandemic.
It’s turned into an information platform with a lot of links to resources and information, especially as we've gotten more cases. Our residents want to see maps and data. So, the goal of our site is to put information out in a timely manner and showcase the power of our GIS program.
GIS manager, Montgomery County, Pennsylvania
David Long
The Montgomery County ArcGIS Hub site includes vital information about COVID-19, such as what the virus is, prevention tips, and symptoms of the disease. The site also contains county-specific statistics, such as age, gender, race, and the municipalities of COVID-19 cases, local county news, and updates from Governor Tom Wolf. The hub hosts public testing registration forms to pre-register for testing at the county drive-thru COVID-19 testing site that’s open daily.
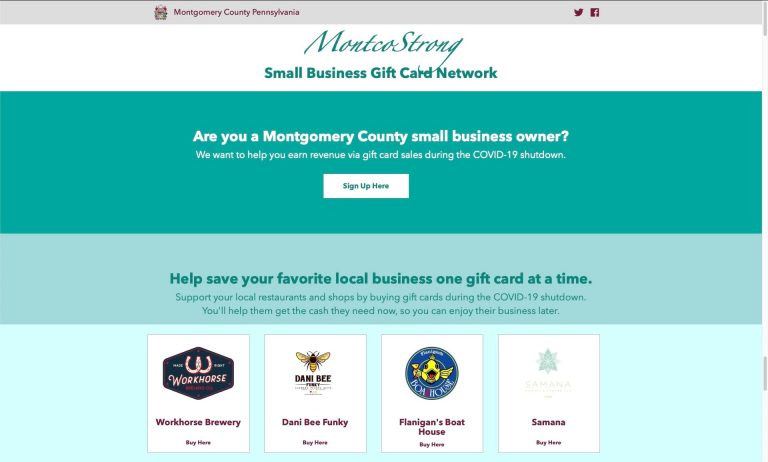
A standalone business page, accessible from the site, was created for the Montgomery County business community to share information about business loans and enable businesses to indicate whether they’re open or closed or have discounts available.
Since its launch on March 7, the site has received 1.8 million page views. Long and his team plan to launch additional mapping content and data for the site that includes COVID-19 case statistics from other Pennsylvania counties.
Maryland Opens Data to Instill Public Confidence
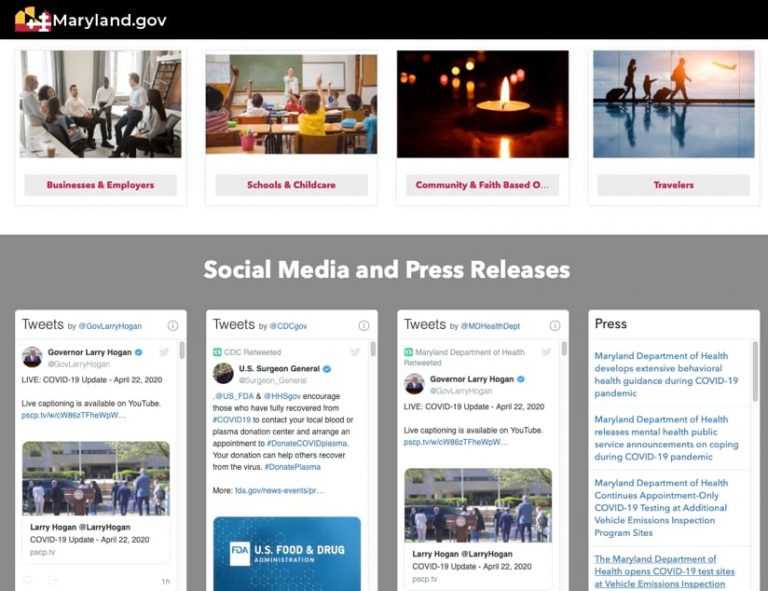
In just a few hours, staff from the Maryland Department of Information Technology were able to build an open data site using ArcGIS Hub that features a dashboard with vital statistics including the location of cases by county. The site also provides details regarding symptoms, how to best practice social distancing, links to local health departments, and practical resources such as links to information from the Centers for Disease Control and Prevention and resources highlighted by Governor Larry Hogan through his official website. The site now includes numbers regarding ICU and Acute Hospital Beds for COVID-19 patients and will continue to track this and add other key statistics throughout the duration of the event.
I want to instill confidence in Marylanders that their state government is providing accurate and timely data. The data is accessible to all Marylanders and is providing a clear and definitive picture of the state’s response to the unprecedented events occurring right now.
director, Geospatial Services, Maryland Department of Information Technology
Julia Fischer
The site is updated daily and as of late April had almost 13 million-page views and more than 3 million users since it launched in mid-March.
Work was done in partnership with several agencies including the Maryland Governor’s Office, the Maryland Department of Health, and the Maryland Emergency Management Agency.
Florida University Serves Open Data to Researchers
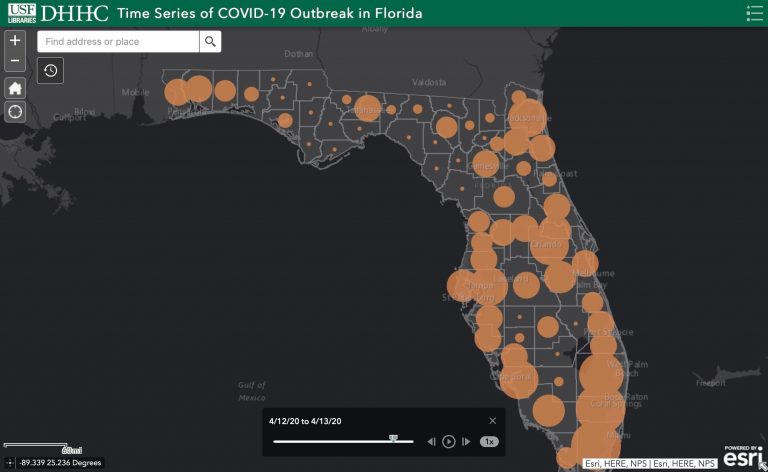
At the University of South Florida in Tampa, a GIS team developed the Florida COVID19 Hub site with real-time updates on a regional and statewide scale, and customized and curated applications for their local Greater Tampa Bay area. The site pulls state-level data from the Florida Department of Health and global data from the Johns Hopkins University dashboard. It also archives daily datasets for state, national, and international scales with the intent to surface temporal trends that hold valuable lessons.
There are sections for statistics, social media, and custom maps displaying counts of cases in each Florida county, including the number of deaths, percent positive tests, and percent of hospitalizations. In addition, the site drills into ZIP code-level analysis for the Tampa Bay region. A time series application shows the spread through time across counties in Florida and is updated automatically.
We are trying to help serve our campus researchers and engaged community of learners and educators, as well as the broader local and regional areas. At this time, spatial data and its relationships to societal function and news are of vital importance.
research associate professor and director of the Digital Heritage and Humanities Collections in the University of South Florida Libraries
Lori Collins
As of the first week in April, the Florida COVID-19 site has been viewed more than 400,000 times and has received positive public response. University research connectivity includes serving as a spatial foundation for grant research and helping researchers connect to funding and collaboration opportunities.
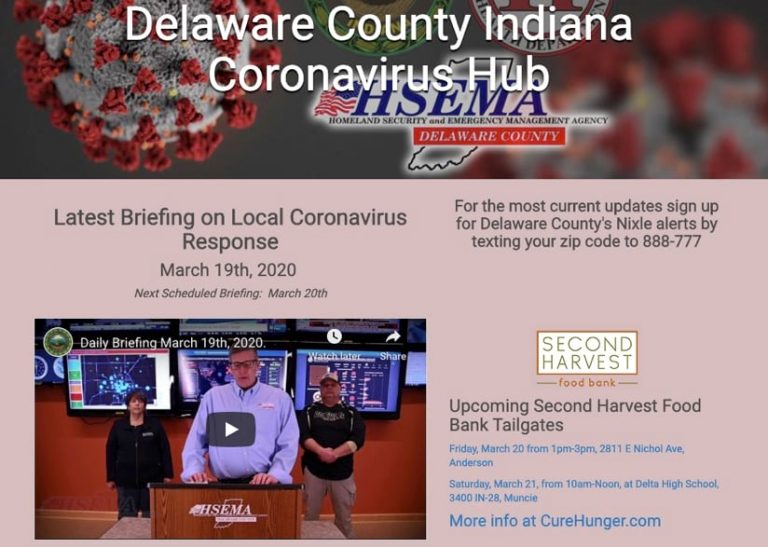
The GIS department in Delaware County, Indiana, produced a COVID-19 ArcGIS Hub site featuring current local cases as well as self-reported illnesses and recoveries. Additional pages focus on food distribution centers, school closures, business and employment resources, neighborhood-level resources, and daily briefing videos from county emergency management. The site also shared data and resources with local public safety agencies.
The site pulls data from both the Health Department and Emergency Management Agency in Delaware County, which have been tracking self-reported illnesses and recoveries. It incorporates State of Indiana Department of Health content which includes state maps and statistics. All information is summarized in graphs, maps and a dashboard.
The main purpose of our local coronavirus hub site is to be the official source for our community’s response to the COVID-19 epidemic. Having a one-stop-shop for all the most important local information was very important to local officials and residents.
GIS Coordinator, Delaware County GIS Department
Kyle Johnson, GISP
Johnson says the initial implementation was very simple, and nearly 2,000 residents access the site each day with more than 60,000 site views so far.
Across the country and around the world, map-based apps and dashboards are communicating important details about the COVID-19 crisis, informing citizens about status and government actions to stop its spread.
See the COVID-19 GIS Hub for location intelligence resources. The Coronavirus Response solutions page provides a collection of maps and apps that can be used by agencies to understand the virus’s impact and share information about the pandemic with the public.
Share this article:
ArcGIS Hubopen datacommunicationCOVID-19dashboardshealthlocal government
Cassandra Perez
Esri's ArcWatch editor since 2025, Cassandra Perez joined Esri in 2018 as a content marketing writer. She received a master’s degree in mass communications from California State University, Northridge, and has almost 10 years of experience in writing and producing content for digital and print channels.
Maria Jordan
Maria Jordan is a product marketer at Esri specializing in ArcGIS products and apps designed to help improve community engagement and collaboration. Maria is passionate about empowering governments, nonprofits, journalists, educators, and businesses alike to effectively communicate with their audiences and stakeholders. She promotes Esri's platforms and tools designed to help share data and tell stories to support better decision making. Maria has been at Esri for more than 20 years in a variety of marketing roles, including managing Esri’s worldwide GIS Day celebration. Maria holds a degree in political science with a business minor and can watch CNN or listen to NPR for hours. When she is not watching or listening to the news, she enjoys traveling, visiting museums, and seeing musicals.