


June 25, 2019 |
Brooks Patrick | Urban Planning
July 10, 2025
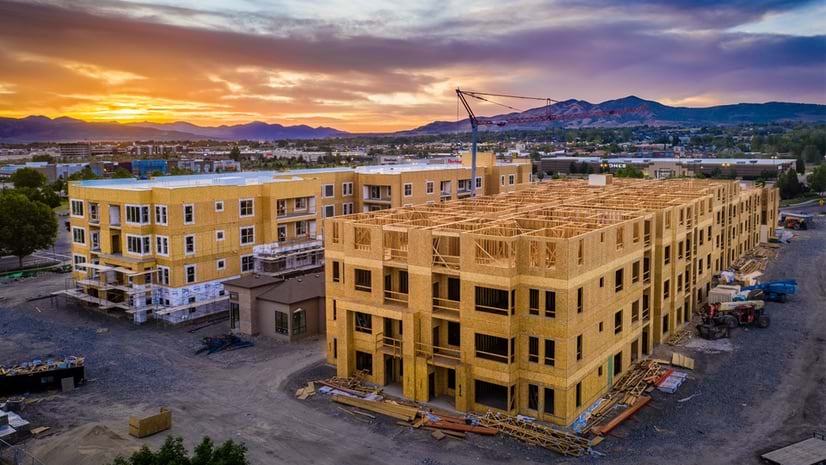
Homeownership, once the cornerstone of US middle-class identity, has become a fantasy for millions of millennials caught in the affordable housing crisis that circles the globe.
An estimated 4 million homes are needed in the US, contributing to soaring housing prices.
Innovative governors are prioritizing housing starts and affordability, mapping ways to increase construction and reduce costs. Maps created with geographic information system (GIS) technology reveal hidden opportunities while helping policymakers approach the problem, communicate with residents, and empower developers.
In Oregon, Utah, and Colorado, governors are embracing mapping technology to cut through red tape and fast-track affordable housing development in ways previously unimaginable.
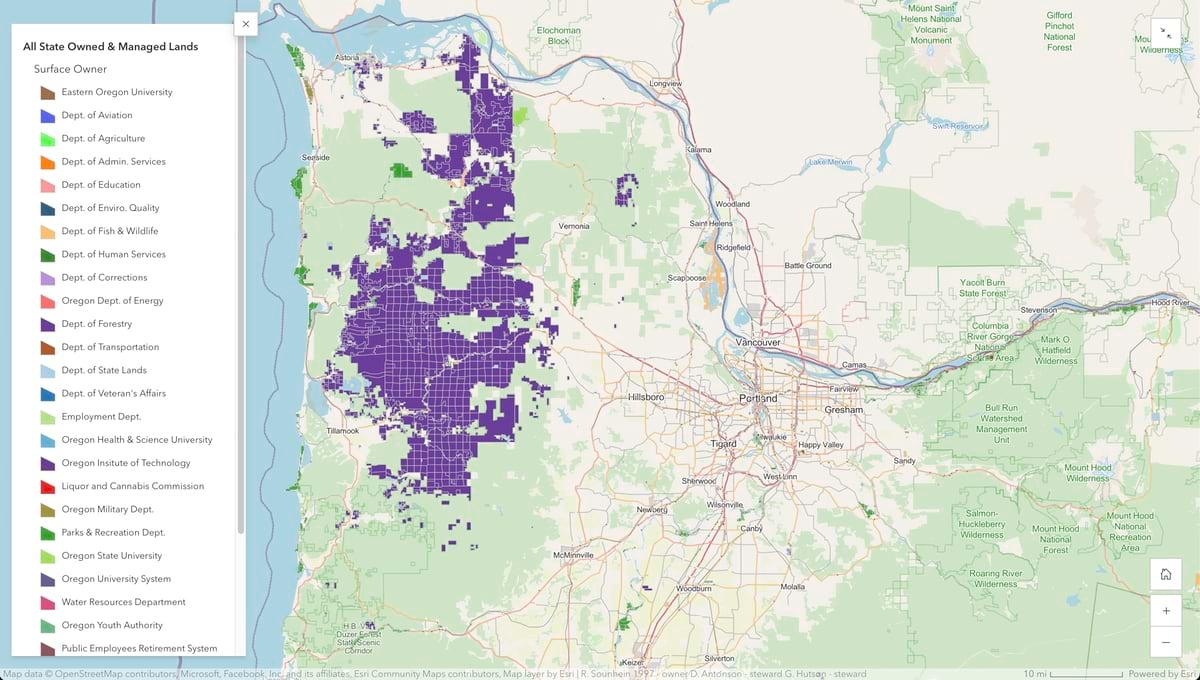
In March 2025, Oregon Governor Tina Kotek unveiled an ambitious initiative to turn state-owned land into more housing units. A comprehensive GIS map identifies state-owned properties ripe for housing development, creating an instant visual inventory.
This mapping initiative does more than identify vacant lots; it layers critical data about transportation access, utilities, environmental concerns, and proximity to jobs and services. By making this information publicly accessible, Oregon has democratized the development process, showing residents, developers, and policymakers prime housing opportunities.
“Families struggling with the high cost of housing are forced to make impossible choices – between staying in the communities they love and finding a place they can afford. This affordability crisis deepens our homelessness crisis,”said Governor Kotek in a statement. “It demands creative, practical solutions to increase the supply of homes quickly.”

The governor is also championing housing choice and cutting red tape to build more housing, with maps serving as evidence for policy decisions. When people see the concentration of opportunities in transit-rich corridors or the abundance of underused state properties, opposition to housing development becomes harder to justify.
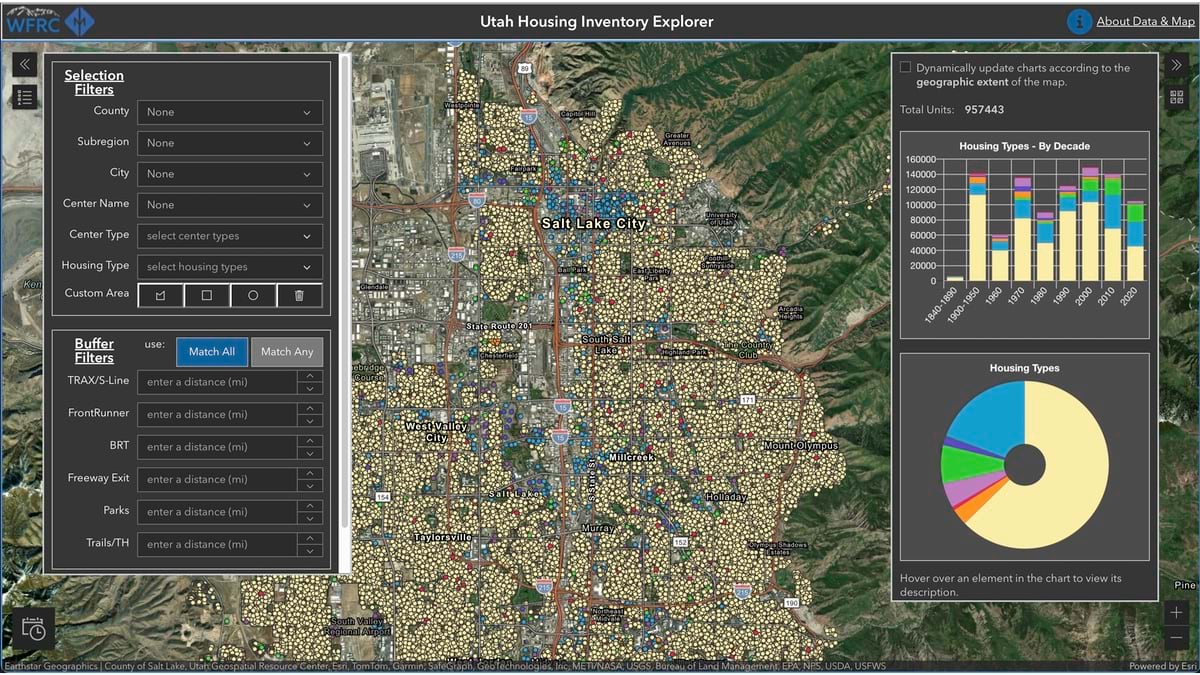
Utah faces one of the nation’s most severe housing shortages due in large part to its popularity. Population growth, combined with a strong economy, has created affordability concerns and a need for thousands of homes.
The state’s Governor Spencer Cox outlined a plan to create 35,000 new starter homes by 2028. To achieve this goal, Utah created a map to reveal the possibilities. The Utah Housing Unit Inventory (HUI) adds housing characteristics to County Assessor tax parcel data. This mapping system shows housing types, numbers of units, and both short-term and long-term trends.
“For 180 years and counting, Utahns have been building our way out of problems, even when things looked impossible,” said Governor Cox in a statement. “Utah is not done dreaming. We’re not done doing big things. And we’re not done building.”
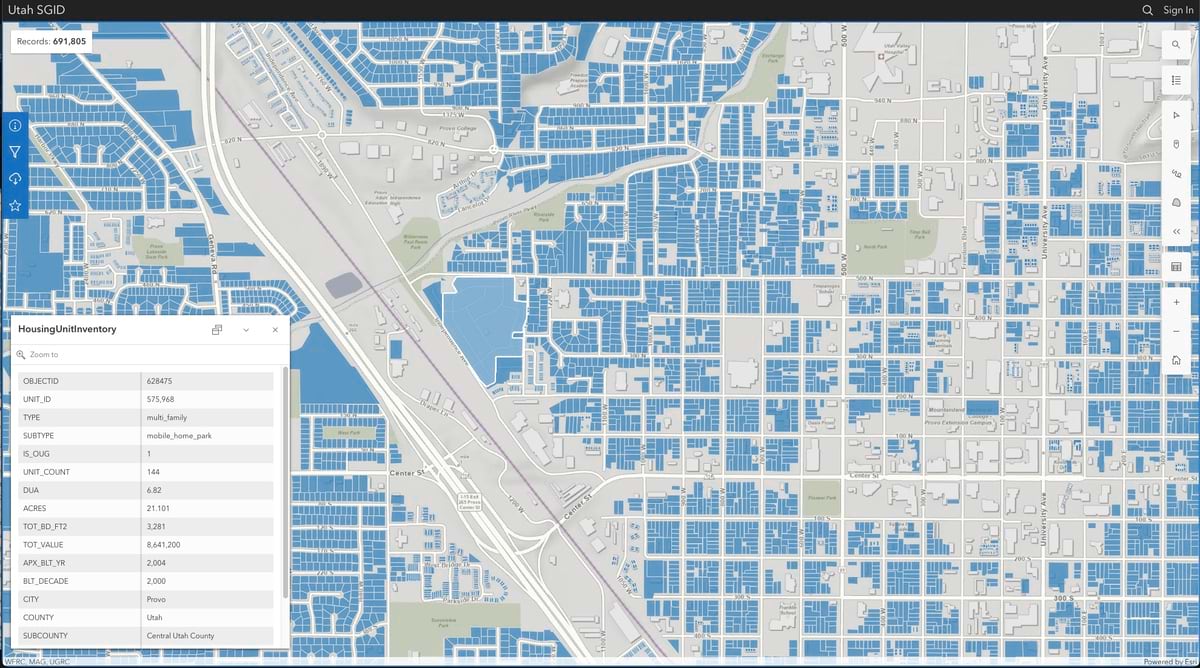
The Transparent Utah mapping portal and the Housing Inventory Explorer from the Wasatch Front Regional Council give planners, developers, and residents unprecedented access to information about what exists today and what could be built tomorrow. This visual approach has changed the conversation from abstract numbers to concrete opportunities, helping Utah’s housing program make headway.
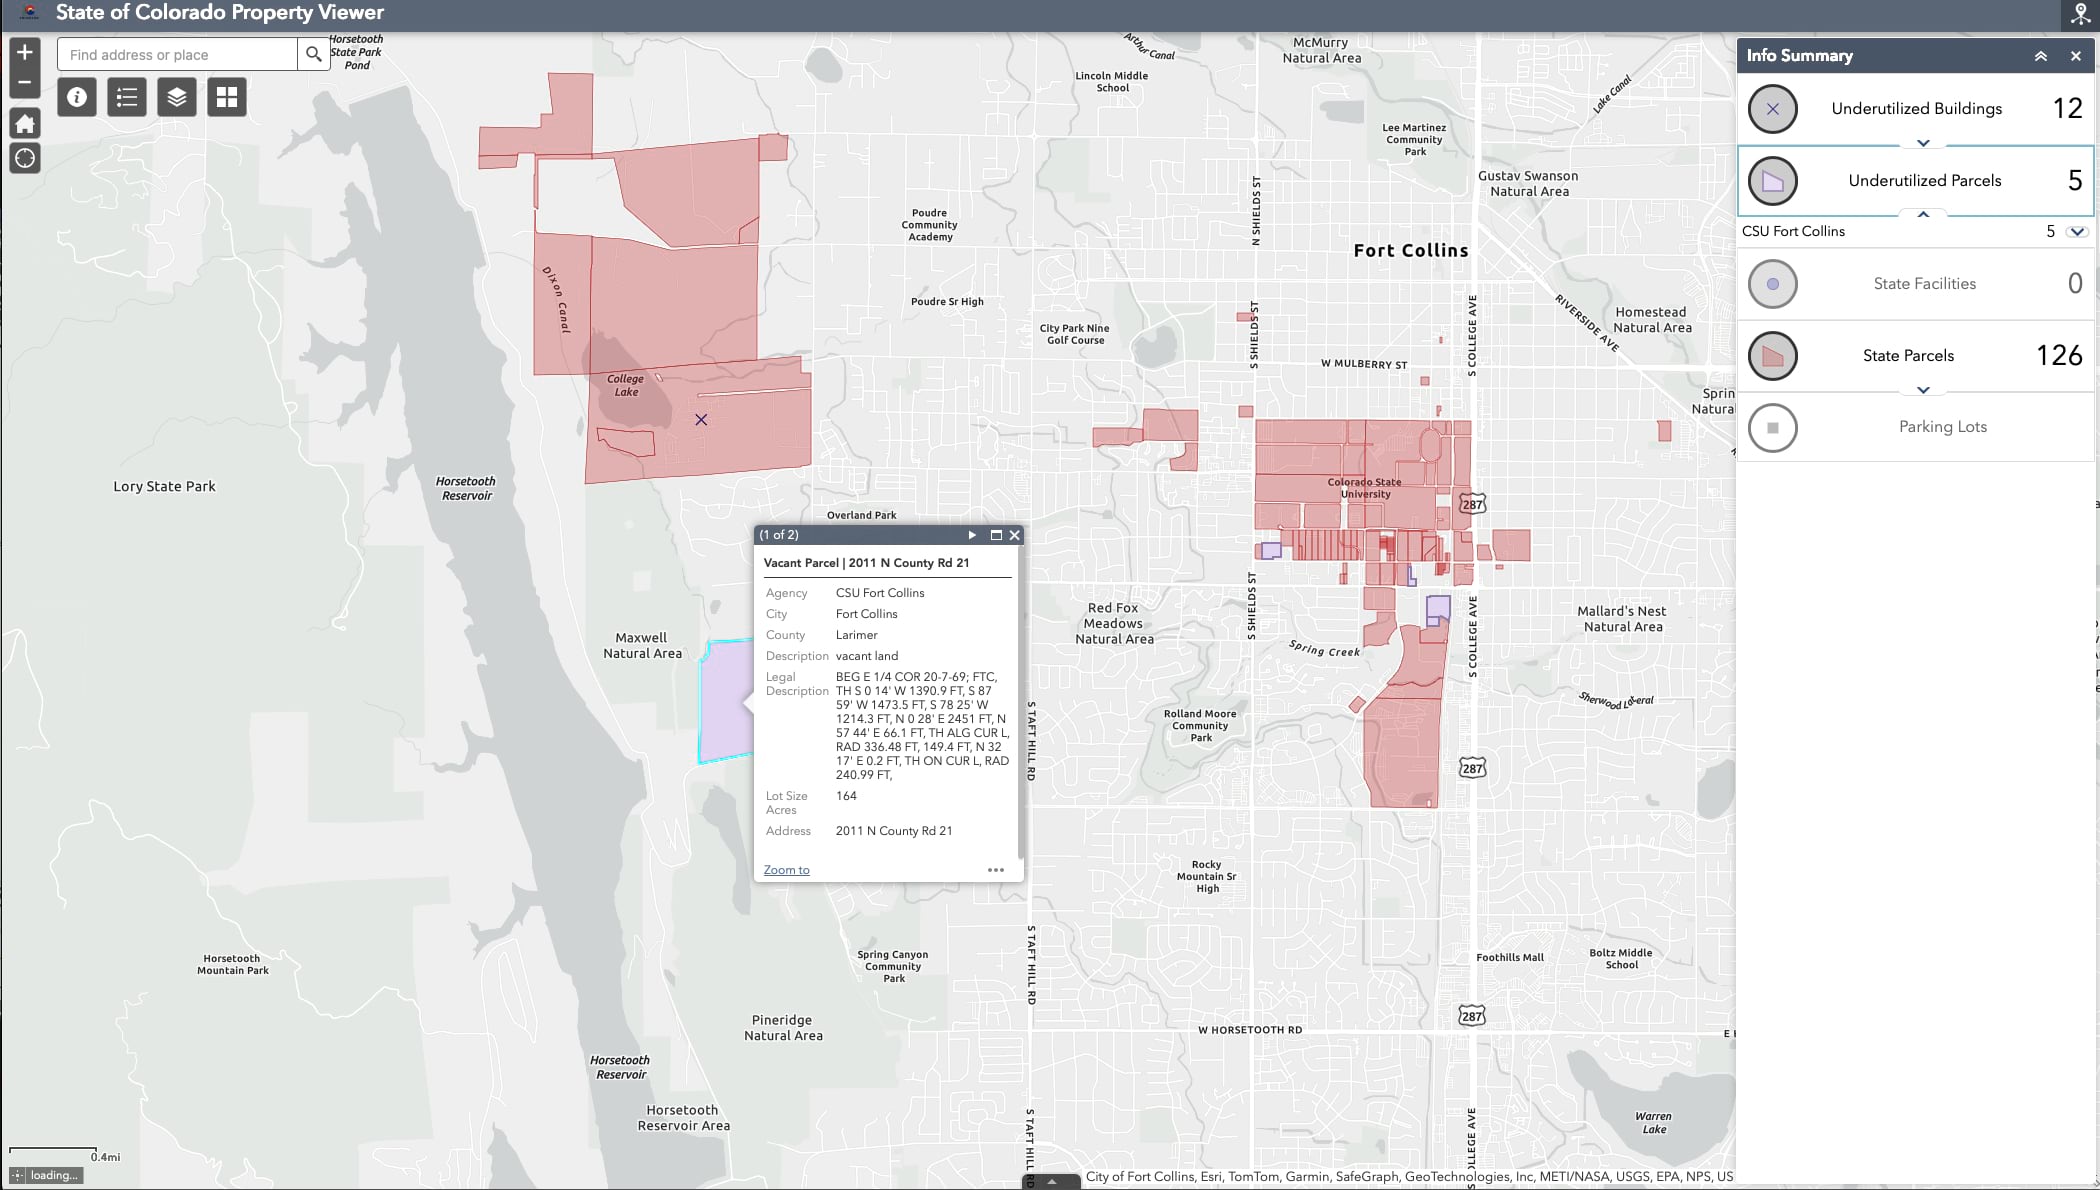
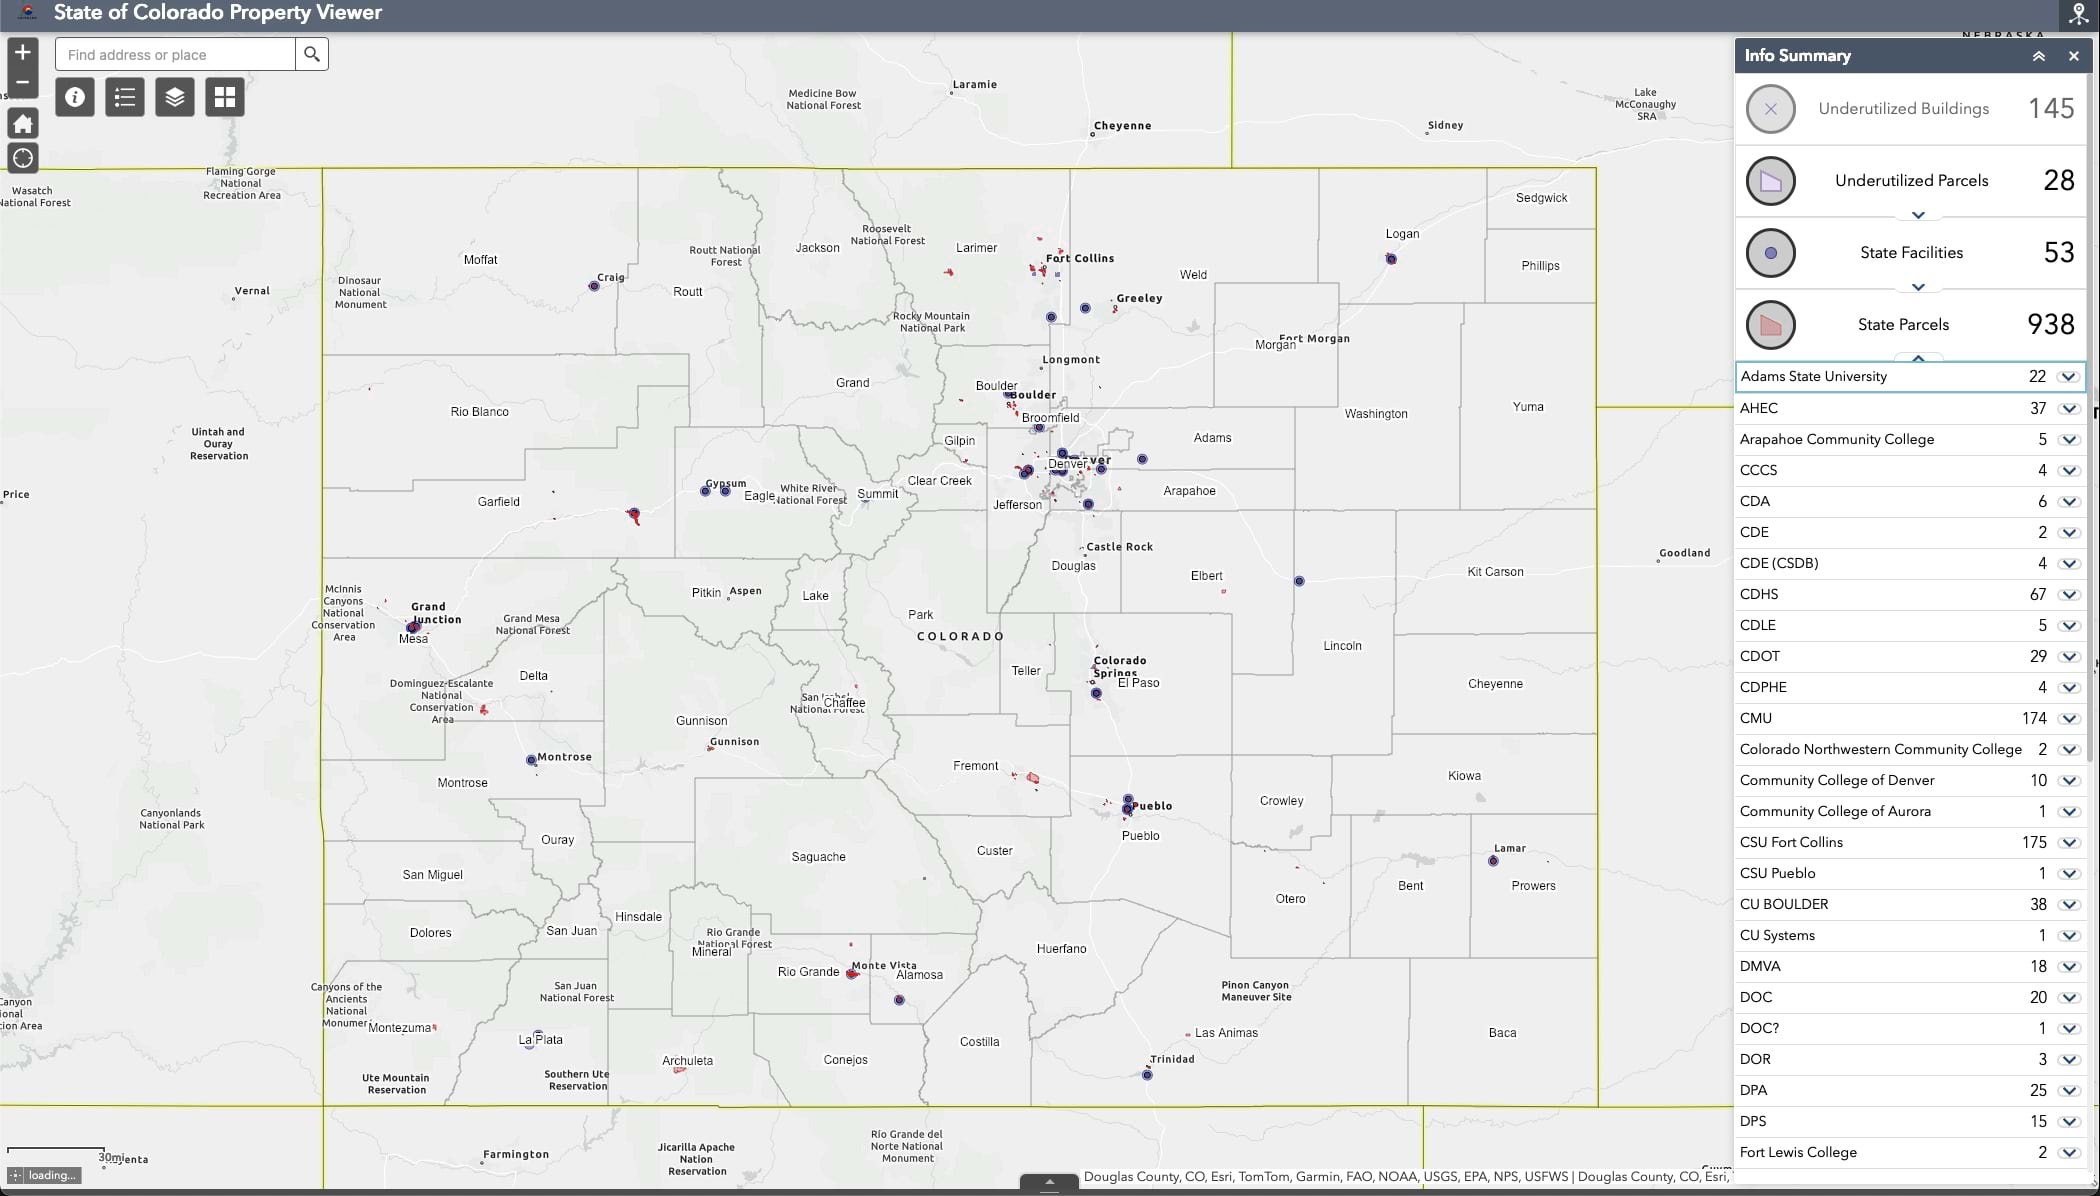
Colorado has established a dedicated State Office to tackle its housing crisis. The office coordinates efforts across multiple agencies to increase affordable housing production and has implemented public-private partnerships to accelerate building. By mapping housing needs and opportunities throughout the state, with the State of Colorado Property Viewer, Colorado is creating a data-driven approach to affordability challenges.
The state is short 127,000 housing units according to an Up for Growth report. While a surge in apartment and home construction chipped away at the deficit, the state’s continuing popularity means it must build indefinitely to catch up with demand.
Colorado Governor Jared Polis championed a four-bill affordable housing package that became law in 2024. The laws create a roadmap to boost construction and limit land-use restrictions, particularly around transit stations. House Bill 1313 requires 31 cities and counties with frequent transit service to boost density near transit to 40 units per acre. It requires local governments to map out plans and adjust zoning to meet housing needs.
“Houses cost too much in Colorado, and we need to be bold and do even more to make Colorado more livable,” said Governor Polis in a statement. “This package will help bring about a future with more housing that people can actually afford to buy or rent, reduce the cost of first-time homeownership, and help Coloradans save money with shorter commute to work or school.”
Colorado’s public-private partnerships provide a way to speed building without a big outlay of funds. This approach uses maps to facilitate collaboration between government agencies and private developers. By identifying specific areas where housing is most needed and where it can be built most efficiently, these partnerships fast-track production.
What makes these mapping initiatives so effective isn’t just the data they contain—it’s how they communicate that data. As architect Paul Kardous observed about his GIS work studying affordable housing in Charlotte, North Carolina, maps are “more persuasive communication means than ordinary numbers on a spreadsheet . . . making things clear for people to understand.”
Maps speak a universal language that bridges political divides. When people see information about housing, transportation, jobs, and services layered on a map of their own community, they understand how and where everything is related. That understanding turns abstract policy debates into concrete discussions.
The value of GIS comes from its ability to show these relationships and correct misconceptions about affordable housing. In Massachusetts, a GIS tool uncovered where land is being used efficiently and identified areas that could benefit form higher-density developments. In Arizona, another GIS tool revealed which areas of Tucson suffer from poverty and lack access to healthcare, jobs, and education—critical information for targeted investment.
Every city facing a housing crisis has the opportunity to build better communities, to connect people to jobs and services, and to create places that meet the needs of its residents. That’s where GIS becomes essential. GIS maps transform complex housing challenges into visible, solvable problems and engage people in finding solutions.
The visual power of GIS can identify where to build, but more than that, it reveals how communities will flourish with thoughtful development. When governors apply GIS tools, they create a shared visual language that cuts through political rhetoric and NIMBYism to uncover possibilities.
The housing crisis demands urgent action, but the right kind of action. When cities map their communities and understand what people actually need, they can build more than just homes. They can create better places to live. A simple map might be our best tool for turning this crisis into real opportunity.
Learn more about how GIS helps communities develop strategies to provide affordable, accessible, and attainable housing options for every resident.