The software experts had to admit—they’d been warned.
In 2013, two geospatial technology companies were competing to build an application that would map infrastructure and operations at the Port of Rotterdam, creating a digital twin of Europe’s largest port.
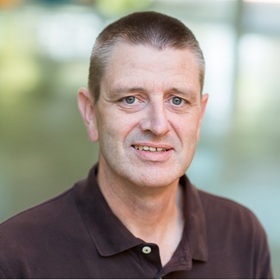
For weeks, Port of Rotterdam program manager Erwin Rademaker had been telling the companies that the smart infrastructure platform he envisioned, powered by geographic information system (GIS) technology, had to be so simple that a 12-year-old could figure it out.
They failed to guess that Rademaker—a salty-tongued visionary and conceptual artist—might mean that literally. When the GIS teams assembled on the 30th floor of a Port of Rotterdam building to unveil their proofs of concept, they were stunned to meet their testers: a group of smiling 12-to-18-year-olds.
“Literally, the guys were numb,” Rademaker says, laughing at the memory.
The Port of Rotterdam App That Had to Be Simple Enough for a 12-Year-Old
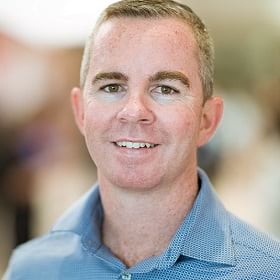
One of the GIS testers that day was a middle schooler named Marcus. Years after that Saturday session, he still remembers the instruction Erwin gave to the software teams: “Within three clicks, everyone should have access to the right data.”
That might sound impossible for a port that spans 42 kilometers and receives 28,000 seagoing vessels and 91,000 inland vessels every year. But it was the simplicity the port needed to help businesses move goods faster and more efficiently around the world.
Marcus remembers it well for two reasons—because he now uses that GIS software to drive operational efficiency as an employee at the Port of Rotterdam. And because it was his father who said it.
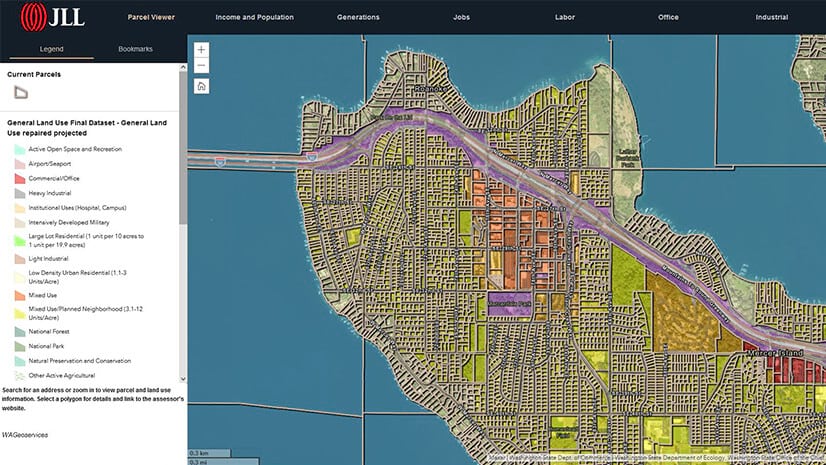
Today, Rademaker senior and junior are shaping the enterprise GIS technology known as PortMaps into a living digital twin of the port: an online simulacrum of operations fed with real-time data from sensors on quay walls, weather meters, embankments, cranes, and even sewer gullies.
This smart infrastructure moves information faster through the port, which in turn speeds the movement of port partners like ship owners, dry bulk businesses, energy enterprises, and logistics providers.
A Generational Inheritance at the Port of Rotterdam
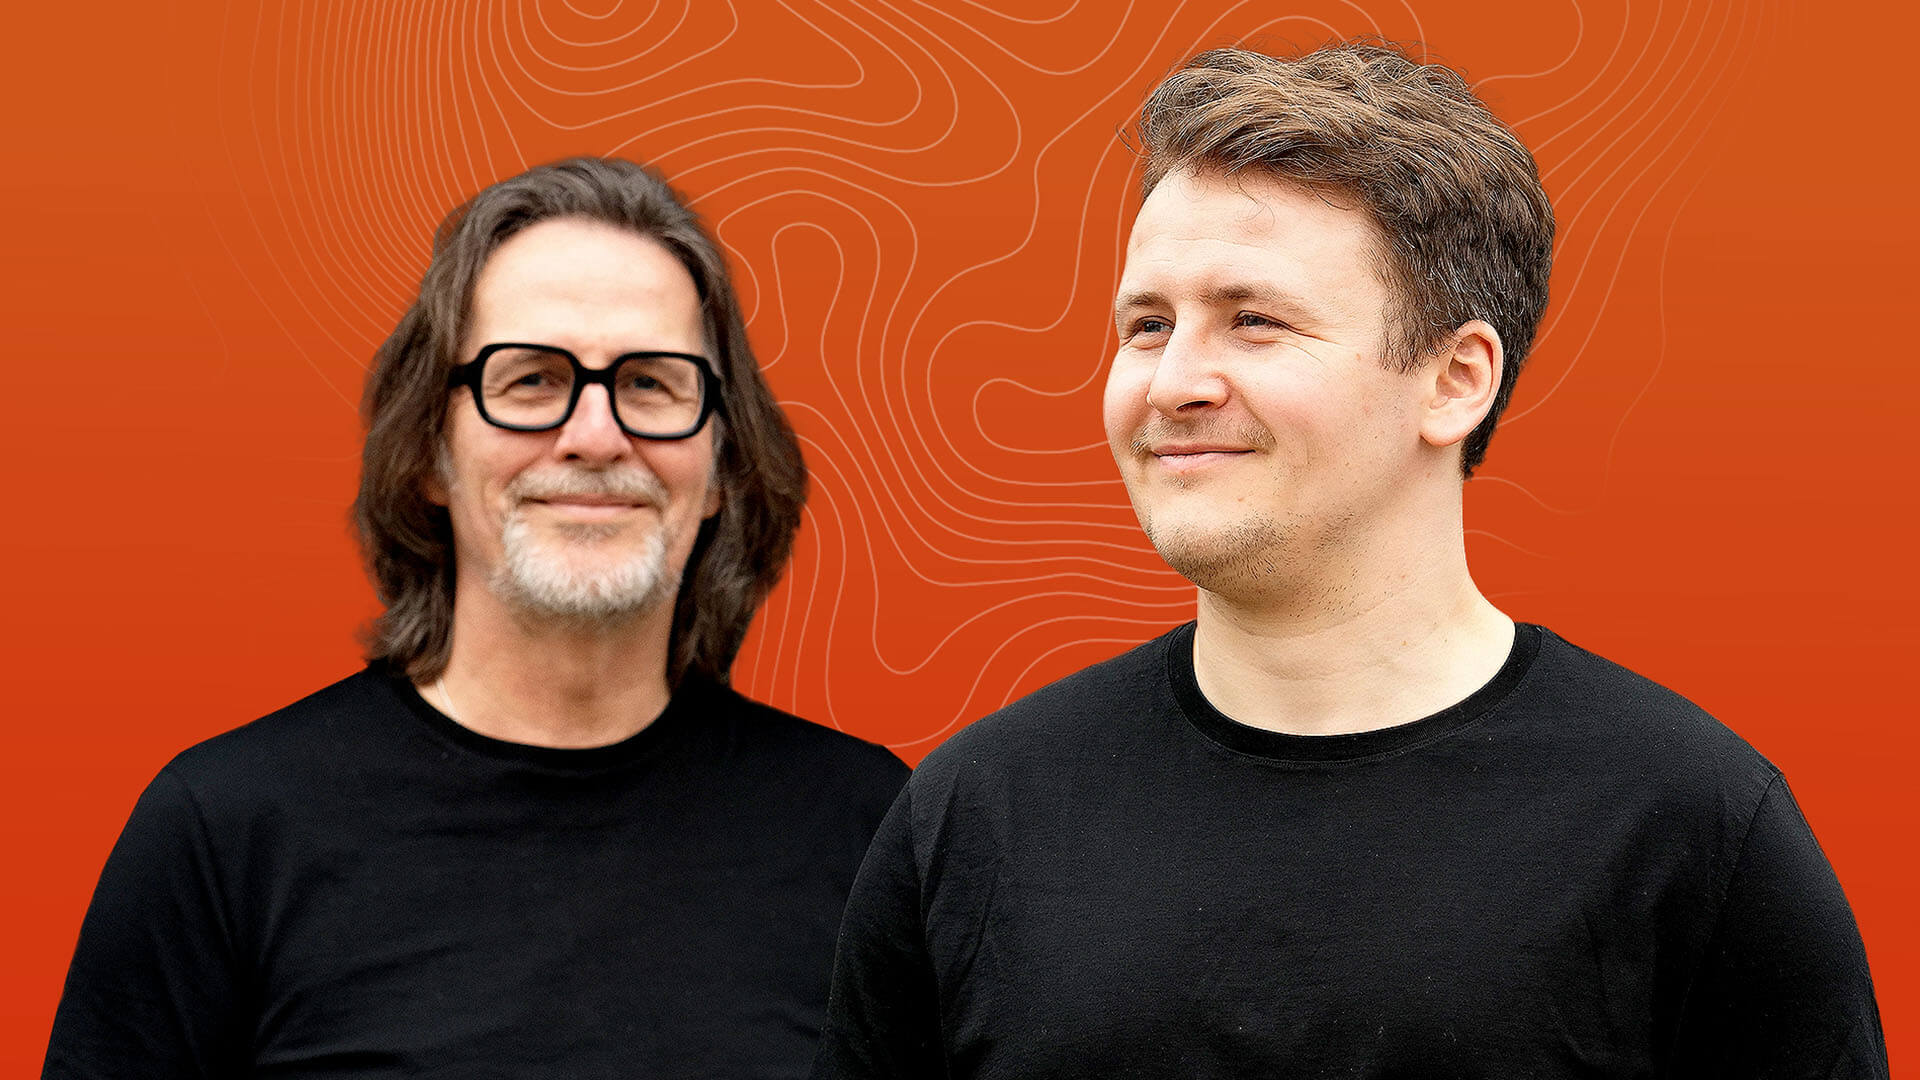
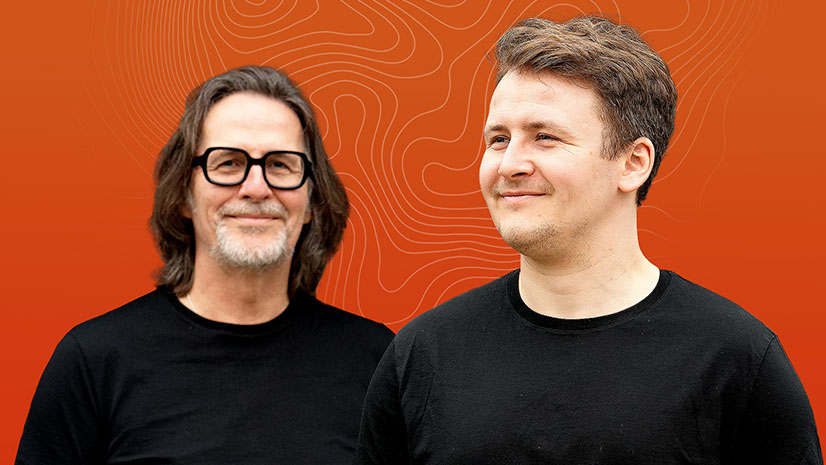
Representing two generations of GIS experts, Erwin and Marcus bring different personalities and points of view to their work at the port. Erwin is known for his directness and a nonconformist streak: He creates conceptual artwork on the side and brings creativity to port problem-solving. Now in a strategy role, he sees some challenges—the energy transition, the AI revolution—extending well beyond his remaining years at the port. “That’s for the next generation,” he jokes.
Marcus, still in the early chapters of his career, is sunny in temperament and quick with a smile. He’s also well-versed in the latest smart infrastructure trends thanks to his civil engineering degree and role as an impact coordinator for Next Generation Infrastructures (NGinfra), a Netherlands-based alliance dedicated to preparing critical infrastructure for the future.
When Marcus was younger, he remembers his father being busy with the port—but always making time to watch his soccer games. Now, father and son share a passion for their work that often spills into evening chats. During family dinners, Marcus says, his girlfriend and mother might roll their eyes when talk turns again to projects at the port.
But there’s no containing Erwin’s pride as he watches his son lay the groundwork for the port to take advantage of autonomous operations and AI.
Hemmed In on Land, the Port Has to Grow Smarter
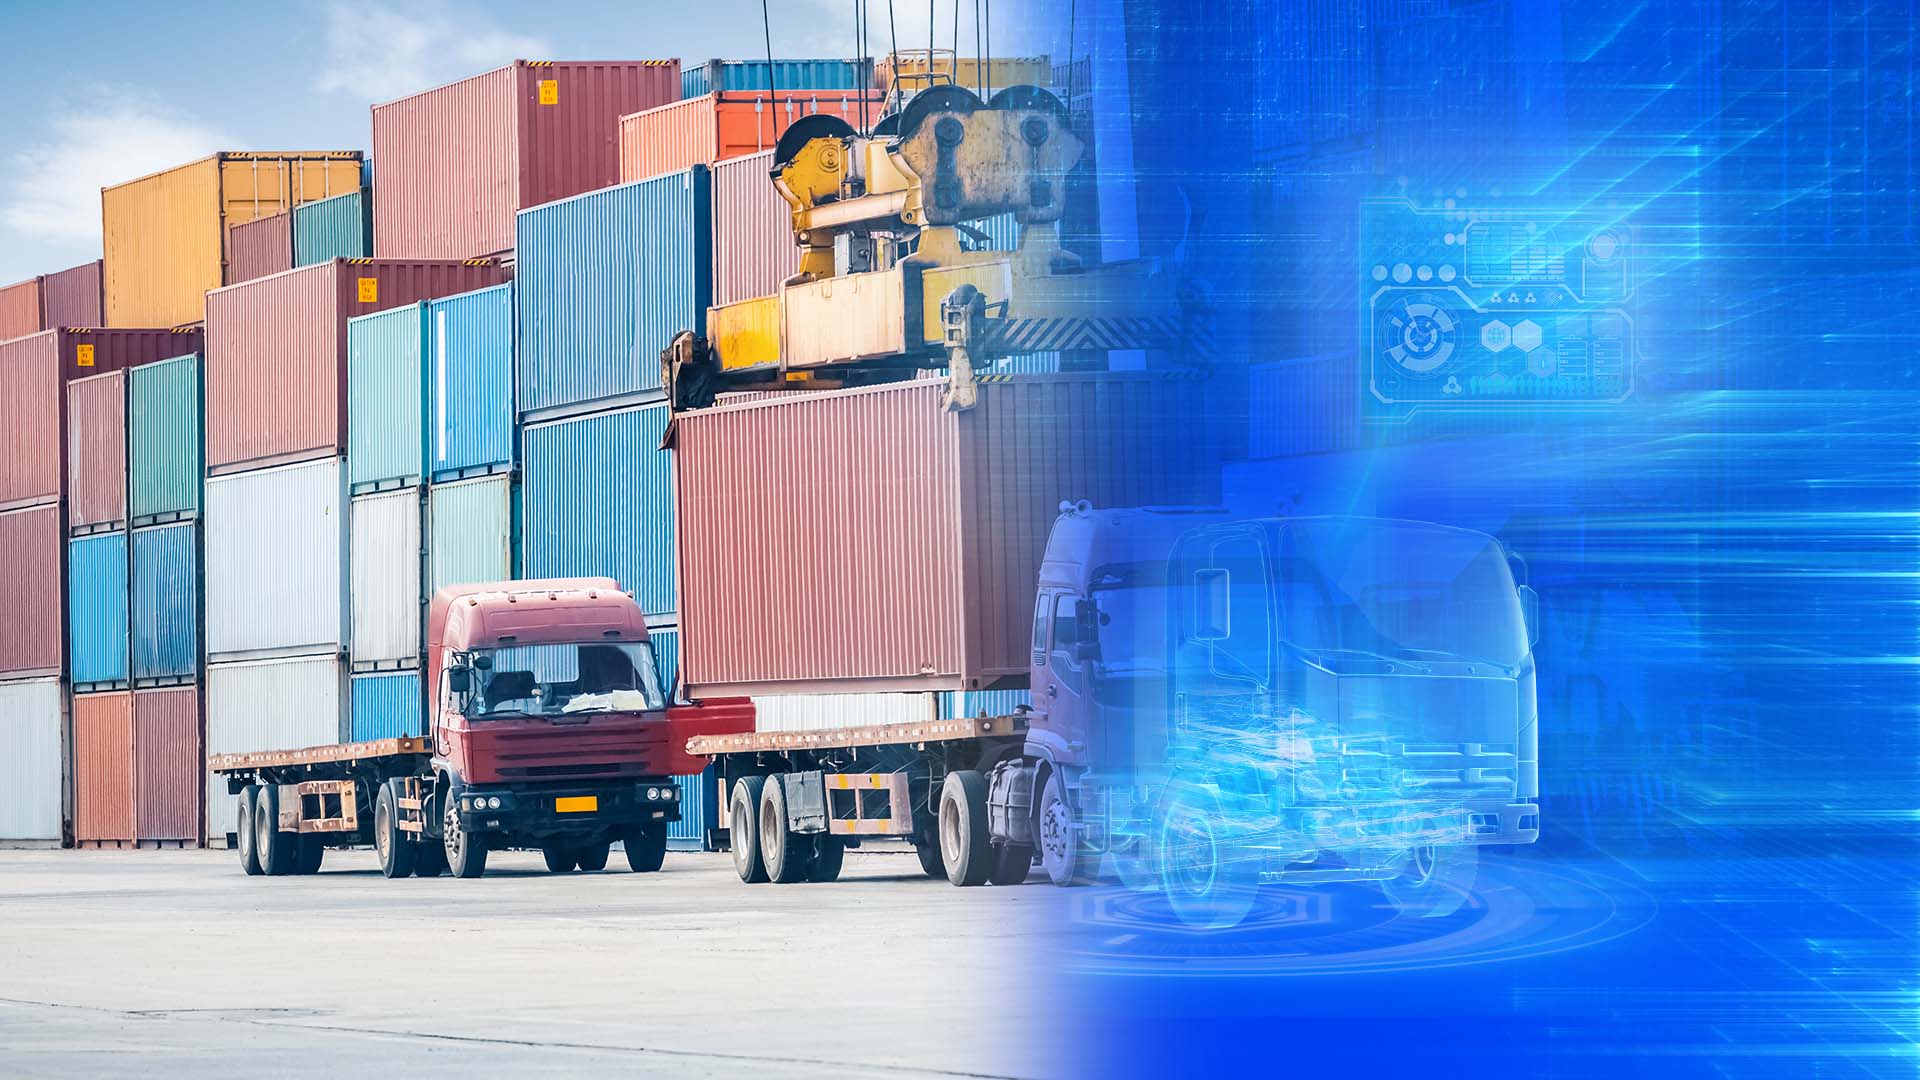
Connected to the world via road, rail, and water, the Port of Rotterdam is a sprawling hub for containers, cargo, energy, and raw materials. The active seaport hosts hundreds of tenants including refineries, chemical plants, and logistics providers.
“All over the world, people don’t realize how much of an influence the port has on a country,” says Marcus, who points out that around 80 percent of goods are transported by sea. “If a port is not run efficiently, the whole country is not run efficiently.”
To keep pace with projected economic growth and remain a linchpin of European supply chains, Port of Rotterdam leaders see a need to significantly increase the amount of freight the port can transport in coming years. But the port is constrained in its physical growth.
Situated at the highly developed Rhine-Maas-Scheldt delta where three rivers empty into the sea, the port is surrounded by villages that block further expansion. That makes maximizing space a strategic necessity for the port. Aided by Erwin and Marcus’s efforts, PortMaps plays a central role in helping Rotterdam double throughput capacity within its boundaries by 2030.
Optimizing Ship Traffic
Used by almost three-quarters of the roughly 1,440 office workers at the Port of Rotterdam Authority, GIS-powered PortMaps is an engine of efficiency for several key port operations.
- It assists the asset management team with maintaining infrastructure and pinpointing the locations of buildings, terminals, vehicles, and other assets.
- It enables environmental management through emissions tracking and by ensuring safe siting of facilities like chemical plants.
- It guides construction and design decisions and port development plans, such as determining whether a new facility will attract tenants and complement 10-year economic projections.
PortMaps’s contributions to operational efficiency include optimizing the management of maritime traffic. In years past, the port’s harbor master—who oversees the safe, smooth handling of vessel traffic—relied on a paper map that didn’t reflect changes to physical infrastructure. For example, ships might appear to cross land barriers that no longer existed.
Today the harbor master makes decisions based on smart maps first established by Erwin and now kept current by Marcus. Traffic supervisors can see ship locations and sensor readings to predict how weather and sea conditions may impact navigation, reducing confusion that can delay deliveries.
Consulting the smart map, for instance, the harbor master might see that rising wind velocity will coincide with tidal currents to cause delays for an incoming vessel. He or she can advise the ship captain to turn down the engines, since berthing will not be realistic for a few hours. Conversely, deeper water depths and stronger winds may mean planners can allow for more containers than they’d previously modeled.
Marcus sees the ability to highlight relationships in location data as critical to the next big step in operational efficiency: achieving autonomous or semiautonomous operations. “There has to be a connection between how the quay wall is related to the berth and how the berth is related to the ship mooring,” he says.
PortMaps is growing more precise as new forms of smart infrastructure come online. Sensors that register sound, like the roar of a vessel engine coming to life, can help the harbor master predict ship departures. Smart bollards, which measure tension in the lines attached to ships, enable engineers to more accurately assess the integrity of quay walls.

Everything is changing within the port but also outside the port . . . The one thing that remains the same is the physical location, or the context of the physical location.
Digging Smarter—When to Dredge and Where
Speed is an important factor in operational efficiency—and so is reducing costs. According to Erwin, dredging is one of the costliest maintenance processes the port executes. It can also slow down business, costing 10 percent of terminal availability on average.
Optimized dredging is key to the port’s efficiency goals: Moving more cargo through the facility will require ships carrying heavier weight, meaning they will sit deeper in the water.
In the past, dredging operations were simply repeated at regular intervals. Managers added sticky notes on a paper wall map to log areas that had been treated. Now, with GIS-driven PortMaps as the system of record, port operators can prioritize dredging areas strategically. They use IoT data to focus digging where it’s needed most and allow deeper areas to go longer between maintenance visits.
Erwin recalls an exciting breakthrough when team members realized that by analyzing weather data, they could anticipate places where storms might deposit sediment and dig those areas out in advance to avoid disruption.
From Sticky Notes to Synchronized Systems
GIS technology has also transformed the port’s inspections services, introducing greater operational efficiency while supporting the safety and integrity of Rotterdam’s operations.
In one routine test, inspectors drill into concrete foundations to extract samples for lab analysis. If those tests show that chloride has penetrated a quay wall’s steel reinforcement, it could impact long-term structural viability.
In the past, inspectors had to manually copy and paste such asset information from one siloed platform to another. But GIS automates data transfers among enterprise systems, making it simple for construction planners and maintenance managers to access the metrics they need.
With time, PortMaps should sync with drones that autonomously relay imagery of port infrastructure, leading to faster resolution of maintenance and structural issues.
The Drawing from the 1600s
The Port of Rotterdam sits amid restless waters—and equally restive currents of global change, from the energy transition to shifting geopolitical tides.
Sixteen years ago, Erwin Rademaker anticipated the need for a system that would counterbalance the volatility of global shipping with trusted context, grounded in the physical world yet mirrored in the digital one. Bringing that digital twin to life required a special set of skills: an innovative approach to problem-solving and a relentless focus on making PortMaps simple to navigate.
“This is why I started [PortMaps],” he says. “It’s so valuable to have this simplicity that always remains, having the same context every time. If you change the context as well as the content, you don’t know where you are anymore.”
As Marcus adapts that model for the decades to come, he’s leveraging his technological savvy and talent for collaboration to expand the scope of the digital twin and produce new efficiencies.
“We are moving more towards a broader view of the platforms and systems, looking at the whole IT infrastructure and how we can make it more efficient that way,” Marcus says. “It’s more about the interoperability of the systems.”
This transfer of knowledge into the digital realm will smooth the path for autonomous operations—a future state in which ships dock themselves using data managed in GIS technology.
Not long after Marcus became an employee, his father gave him a drawing of the port from the 1600s for his birthday. Erwin advised his son to find comfort in it whenever he felt ensnared in challenges where progress seemed remote or caught up in anxiety about what the future holds.
“Just look at this drawing from way back and remember that the port will still be there tomorrow,” his father told him.
It’s a message of finding strength in continuity and simplicity, even as the capacities and complexities of the Port of Rotterdam expand. As the location technology championed by the father is passed down to the son, simplicity remains a guiding principle of the smart infrastructure that will enable the port to stand strong for decades to come.
The Esri Brief
Trending insights from WhereNext and other leading publicationsTrending articles

December 5, 2024 |
January 6, 2026 |
March 31, 2026 | Multiple Authors |

March 3, 2026 |
July 25, 2023 |
February 17, 2026 |