Inside the operations of Disneyland, Walgreens, and agricultural innovator Grapery, three professionals have found new ways to speed up the work of field crews, maintenance staff, and executives. At the root of their work is a technology that connects data to geography.
Answering the perennial question, How can this business move faster? often begins with an examination of how information flows through an organization. If it is sequestered in disparate departments—and gathering and distributing it takes too long—a business moves slower than it should, and risks losing its edge.
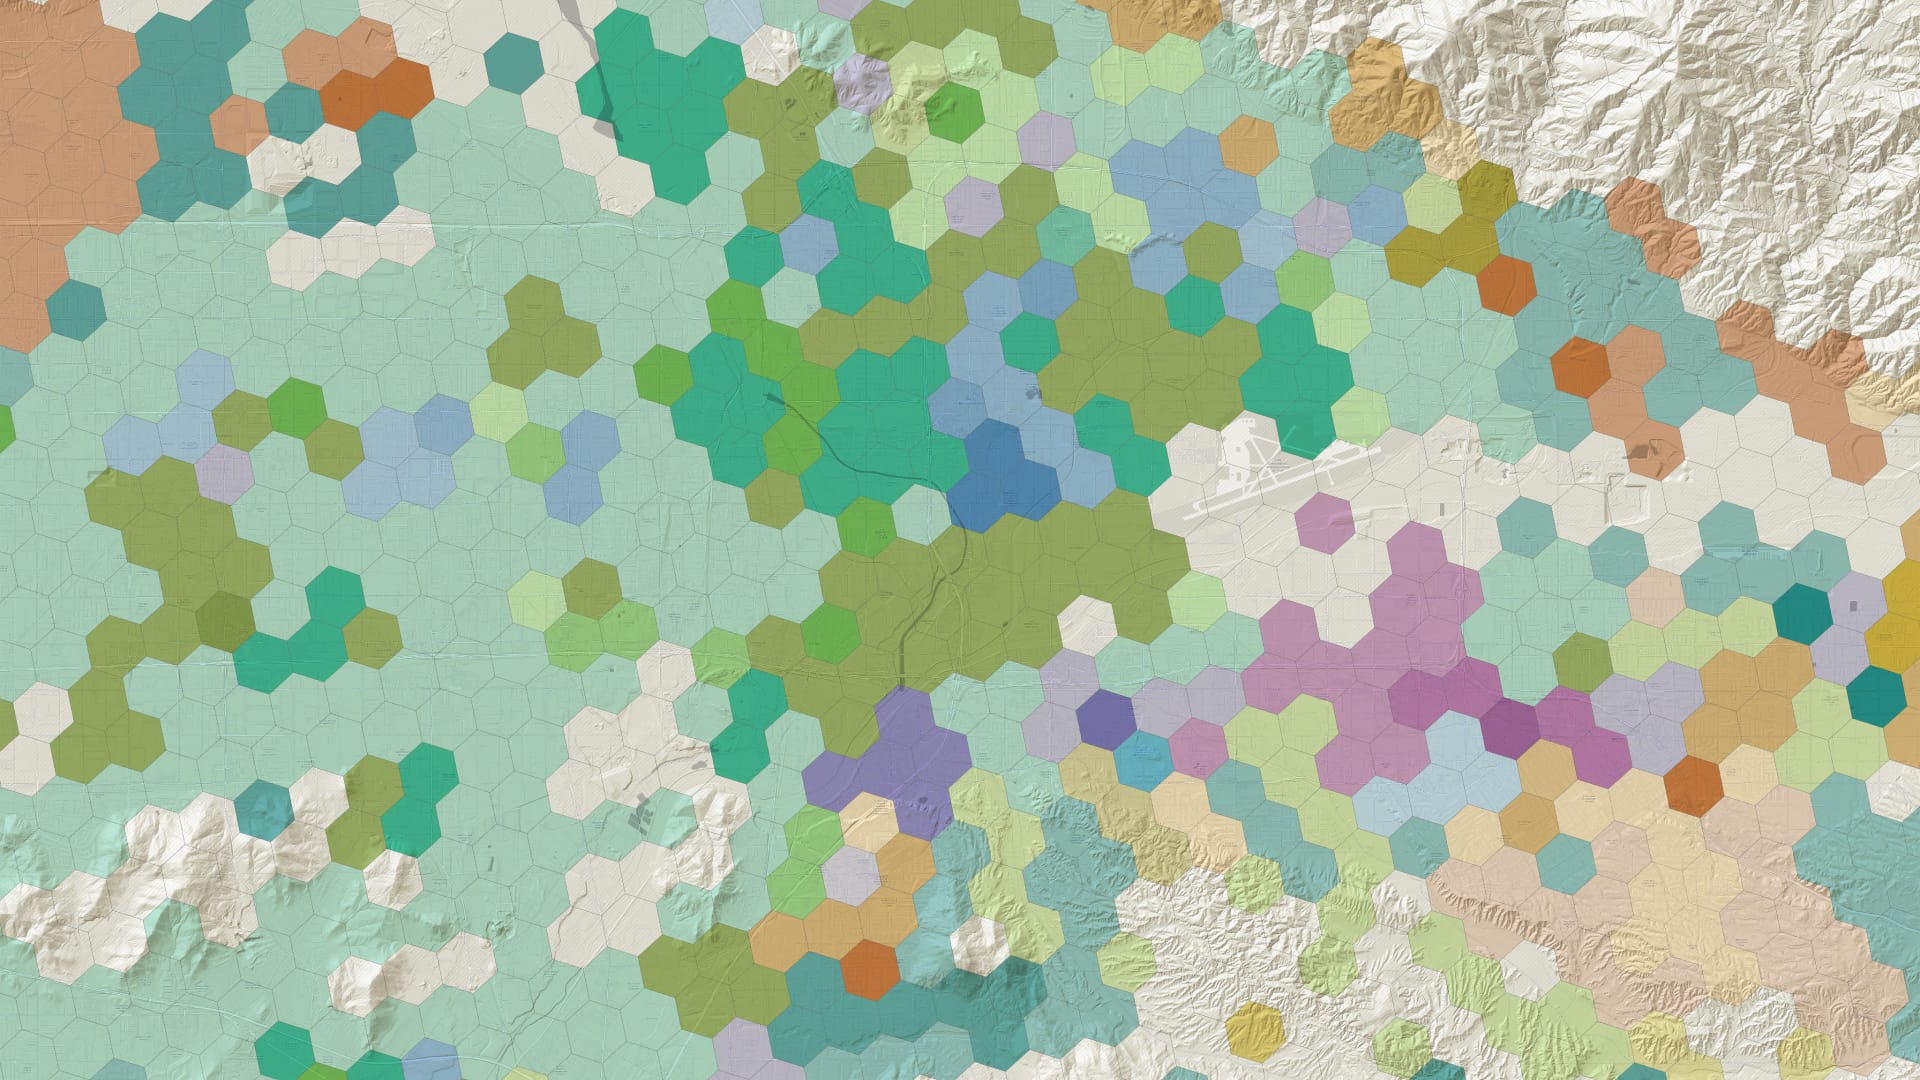
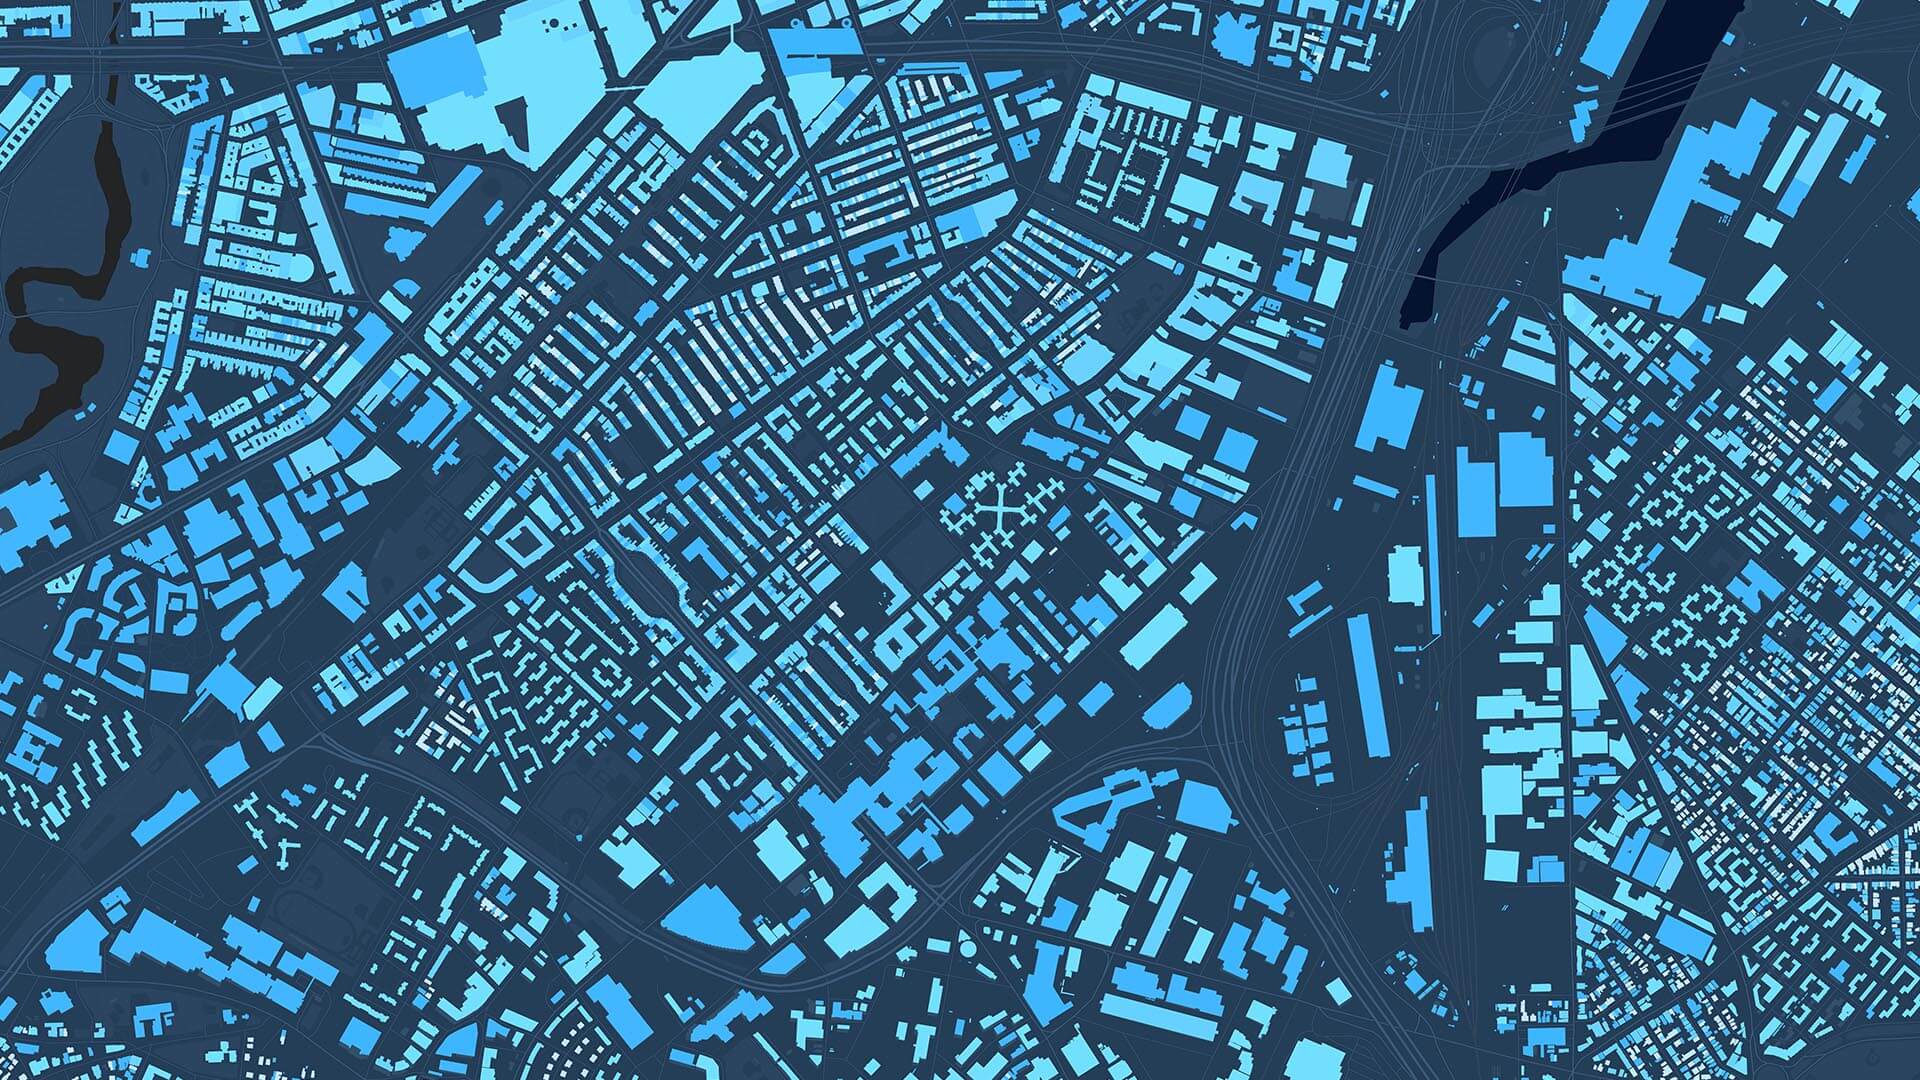
At the three companies featured in this video, efficiency stems from the smart management of location data, enabling these organizations to:
- Reduce drive-time and streamline field operations.
- Speed up maintenance processes.
- Accelerate executive decisions.
View the webcast excerpt below or read the transcript for insider tips on creating business efficiency. To watch the full conversation, visit GIS and the Many Faces of Efficiency.
Chris Chiappinelli, WhereNext: Could you share two specific ways you think GIS [geographic information system technology] can make operations faster and more efficient?
Garrett Hestand, Grapery: The first way GIS makes field operations faster is by eliminating unnecessary communication loops. When data is already connected to location and accessible to the right people, you reduce back-and-forth emails, clarification calls. For us, a big one is reducing drive time, so by digitizing everything and making it all based on location and live data, we reduce having our field supervisors and ranch managers [drive] from 2 hours away back to the office to hand over some paper reports when they can go on their phone, enter the data in, and we get a pin exactly where they are and what they need to show our executive team and our farming operations team.
Another way is by replacing static reports and the paper reports with live visual views, and instead of people requesting a spreadsheet or waiting to compile the data by hand—you’ve got hundreds of different spreadsheets where you’ve got to dig through and click through 10 sheets, or you’re waiting 30 minutes for this gigabyte Excel spreadsheet to load—now with using Esri products, being able to put everything on an experience where there’s little tabs for everyone to click through, and our whole team has access to it all the time with live data. I think it really, really helps the team make decisions quicker and more efficiently.
Sam Lustado, Disneyland: One example for us—and it’s a very simple idea but [for] everyone here who has approached this problem, it’s challenging to execute—it’s migrating information from many different sources into a common data environment. . . . We were able to do that, and we’re currently using an ArcGIS Enterprise solution, to give some context.
[What] is pretty unique to Disneyland is we’re an organization that runs 24/7—there’s no open/closing business hours. Guests come in [at] 7:30, 8:00 a.m.; the parks close at midnight; and then the behind-the-scenes teams—they can start their work. So with that time pressure, there’s also this added complexity of a very small geographic footprint, which gives us really limited physical space to work. The combination of both a time constraint and space constraints makes the logistics coordination a bit more complex, a little more complicated, and every second translates into the impact of the guest experience. It always goes back to the guest experience for us.
So the amount generated from all of these pressures, it’s incredible to see, but also very complex. Each of the teams—and there are many different lines of businesses—they have their specific goals. It could be from a safety perspective, from an engineering perspective, sustainability—each interpret baseline data differently. And I think the main motivator of using GIS within the resort is [that] information has been in siloed environments. [We have] architects and engineers and project managers trying to understand existing conditions so that they can plan for future conditions. We have plumbers and electricians who need to know which utility assets need attention for routine maintenance or if there needs to be . . . unplanned service.
A GIS environment became a really clear solution for efficiency, to have all those use cases in there to enable us to take those different sources—from architectural and utility drawings and surveys and project schedules—and put them in an enterprise database, which is served on the web that our staff can access. So, the means to get there [involved] lots of bells and whistles of developing automations and scripts and pipelines and integrations, all that. But just getting it in a single location was probably one of the leading examples.
Ben Farster, Walgreens: One of the examples I had—or advice, I guess you’d say—is focusing on the data infrastructure underneath; the time and investment to build up that infrastructure and have that data readily available becomes extremely efficient. We can pre-can datasets, we can have the ETLs update, we can have triggers in the database—all that kind of work that allows us to be really nimble and get those answers quickly. So when someone comes asking, with a question from an executive, we can really make a quick query or pull up a map we have ready or an application we have ready, and it’s right there for us.
That time and investment in that work is really valuable. And sometimes that is some of the toughest work, when you’re dealing with budgets, you’re dealing with IT trying to get the big rocks moved—and that can be tough, but it really does pay off.
One thing more [specific to] GIS is tying everything down to census geographies. We’re looking at things from a national to local view all the time. So, tying everything—from demographic data to our stores to competitors, to anything else we bring through patient data, customer data—tying it all to geography so then we can query it, filter it, slice it all up how we want really quickly, that’s been a really good tactic for us. It organizes us really, really well
Another thing is enabling self-service. We have applications for project-specific tasks. Sometimes for literally a day someone needs a project, we’ll make them an application. But then we have core applications out there for a really broad audience that allows them to self-serve data and [do] a little bit of light analysis for them to go digging on their own. I think that’s really valuable to be efficient in our own time, that we allow them to go do some of it themselves and get that information on their own. And [it] also democratizes our data across the organization.
The Esri Brief
Trending insights from WhereNext and other leading publicationsTrending articles

December 5, 2024 |

June 23, 2026 |

June 2, 2026 |

May 26, 2026 |

April 7, 2026 |

March 3, 2026 |