When supply chains break, the first response is predictable: collect intelligence, assess the damage, brief leadership. But then comes the greater challenge.
“What are our options?”
That’s the moment that separates reactive organizations from resilient ones. The video below shows how geospatial analytics transforms that critical question from a scramble to a strategic response, empowering organizations to pinpoint alternate suppliers, map new routes, and avoid hazards.
Geospatial Triage for Supply Chain Disruption
In this hypothetical scenario, geographic information system (GIS) technology helps a company quickly establish new supply chain connections following an earthquake affecting the Hong Kong region.
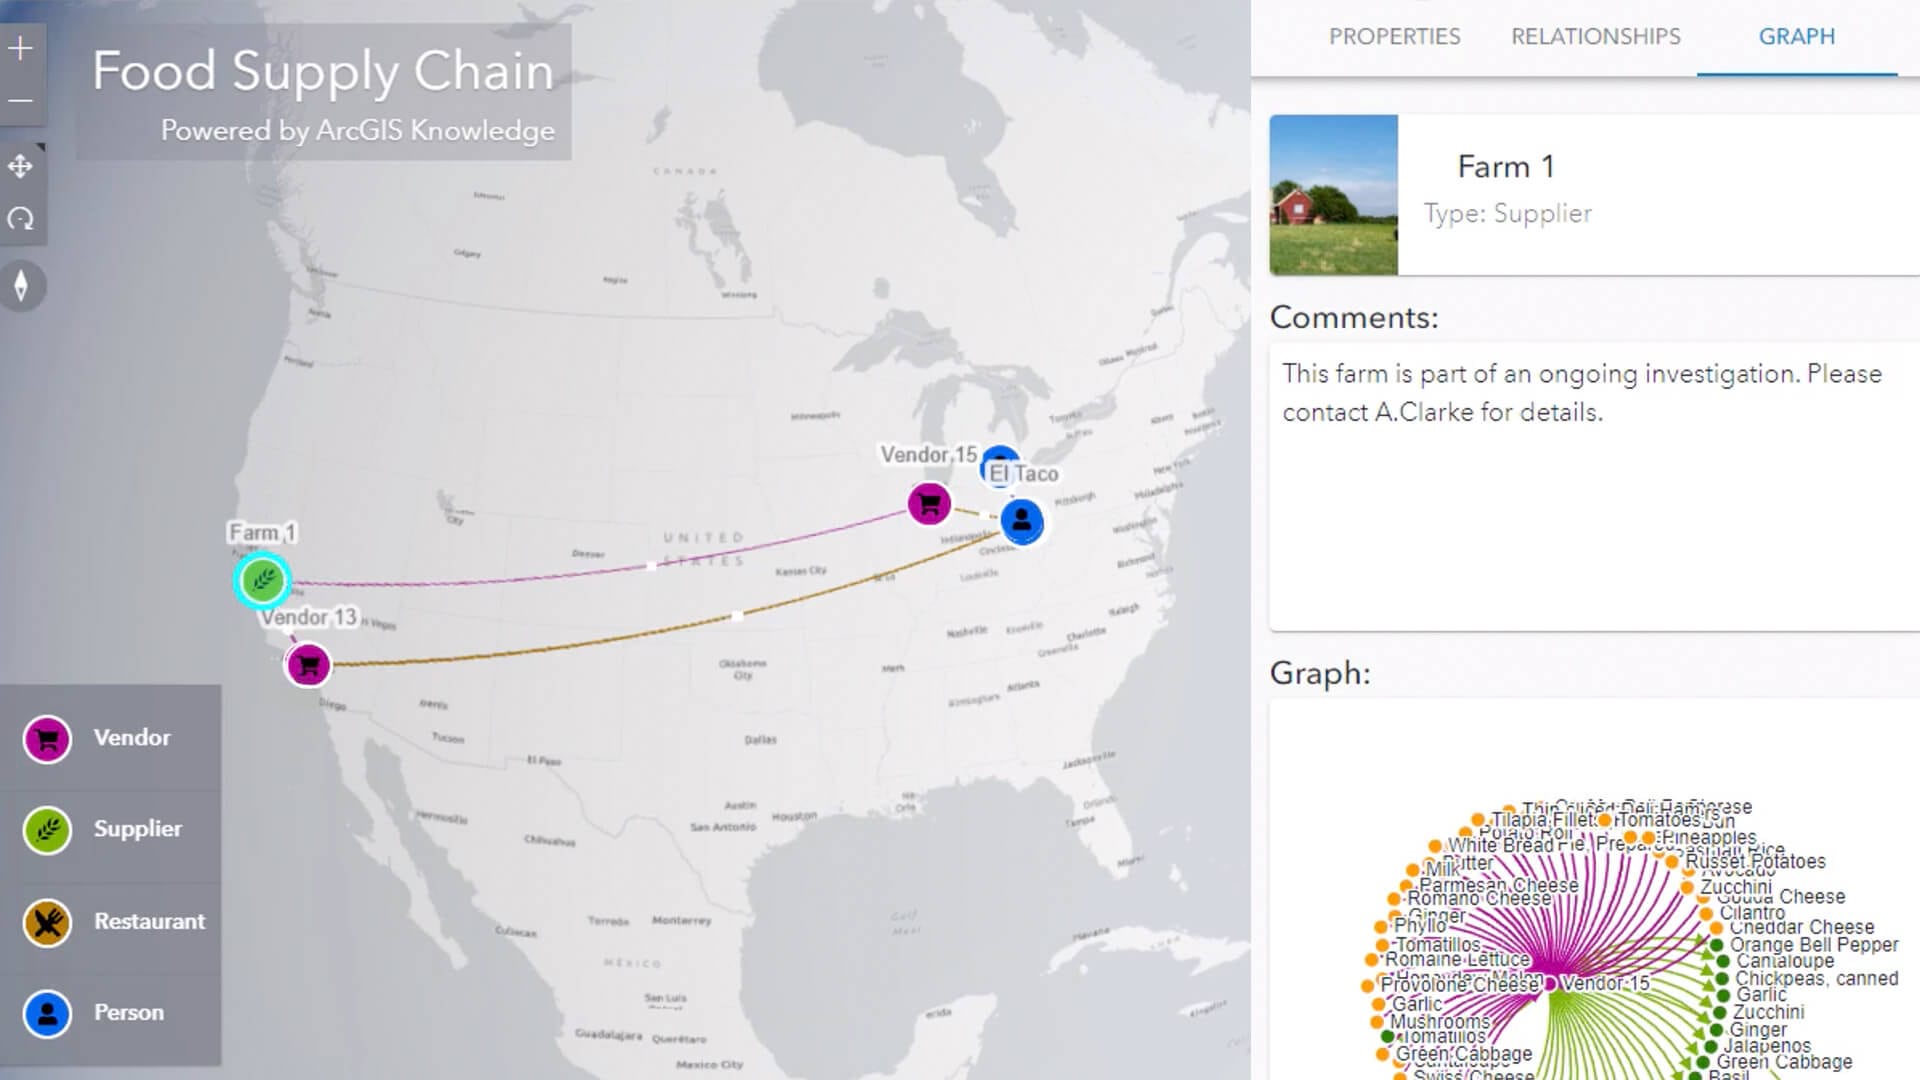
The first thing a supply chain executive sees is an operational basemap depicting the earthquake location and affected suppliers, along with information about its impact—like how many units of product each supplier provides.
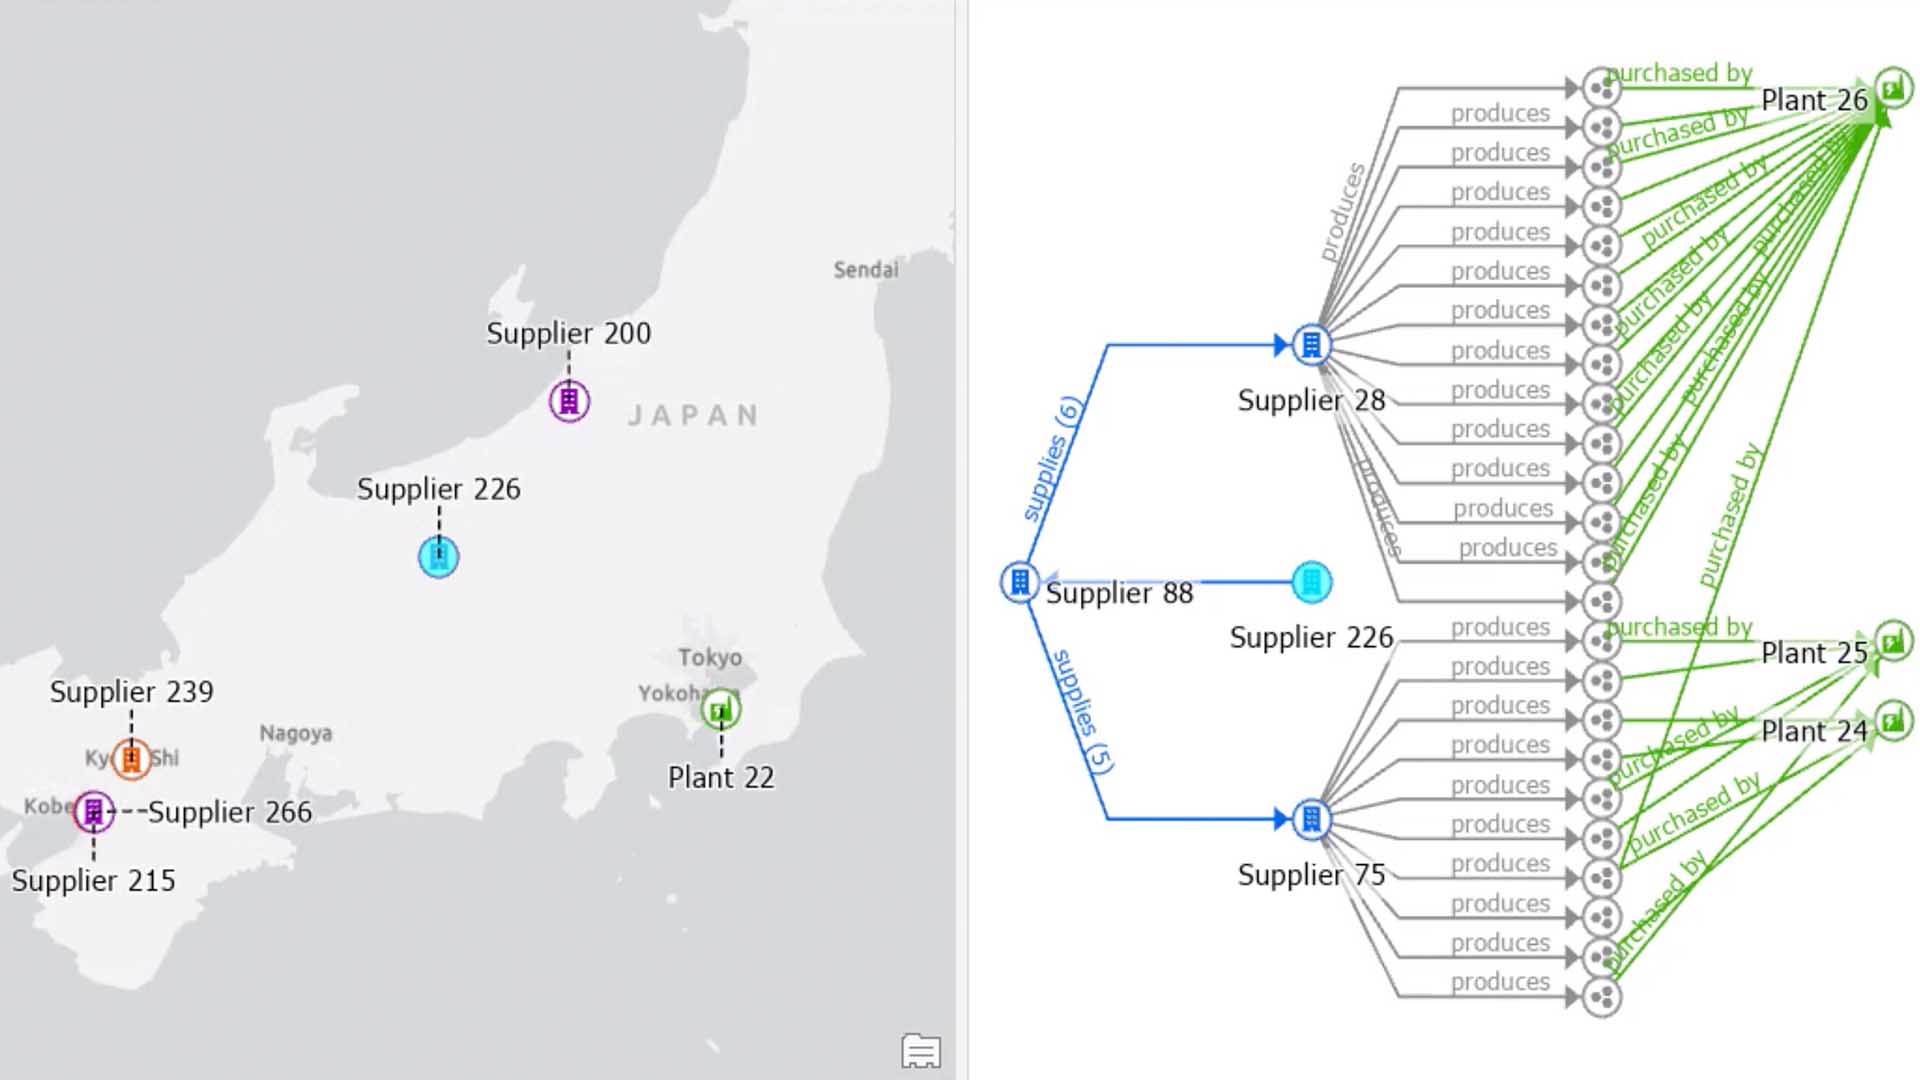
Next, a GIS analyst can visualize the downstream effects. While the number of suppliers in the earthquake’s impact zone is small, a map tracing their relationships downstream to manufacturing plants and customers reveals that dozens of partners may face product delays or shortages—as far away as the Florida coast.
In a global security and operations center (GSOC), a manager can use the GIS dashboard to send notifications of the supply chain disruption to procurement specialists, sales leaders, security managers, and other stakeholders.
Meanwhile, the supply chain team works on a plan to ensure the steady flow of goods. By filtering the map to show alternate suppliers of the same product, decision-makers can compare metrics on pricing, quality, sustainability, compliance, or other criteria. Clicking on a supplier surfaces deeper context, including images of the component produced on-site as well as quantities on hand and delivery lead times.
In this scenario, company leaders would see that the alternate suppliers charge more for the same component—an acceptable trade-off for the sake of business continuity.
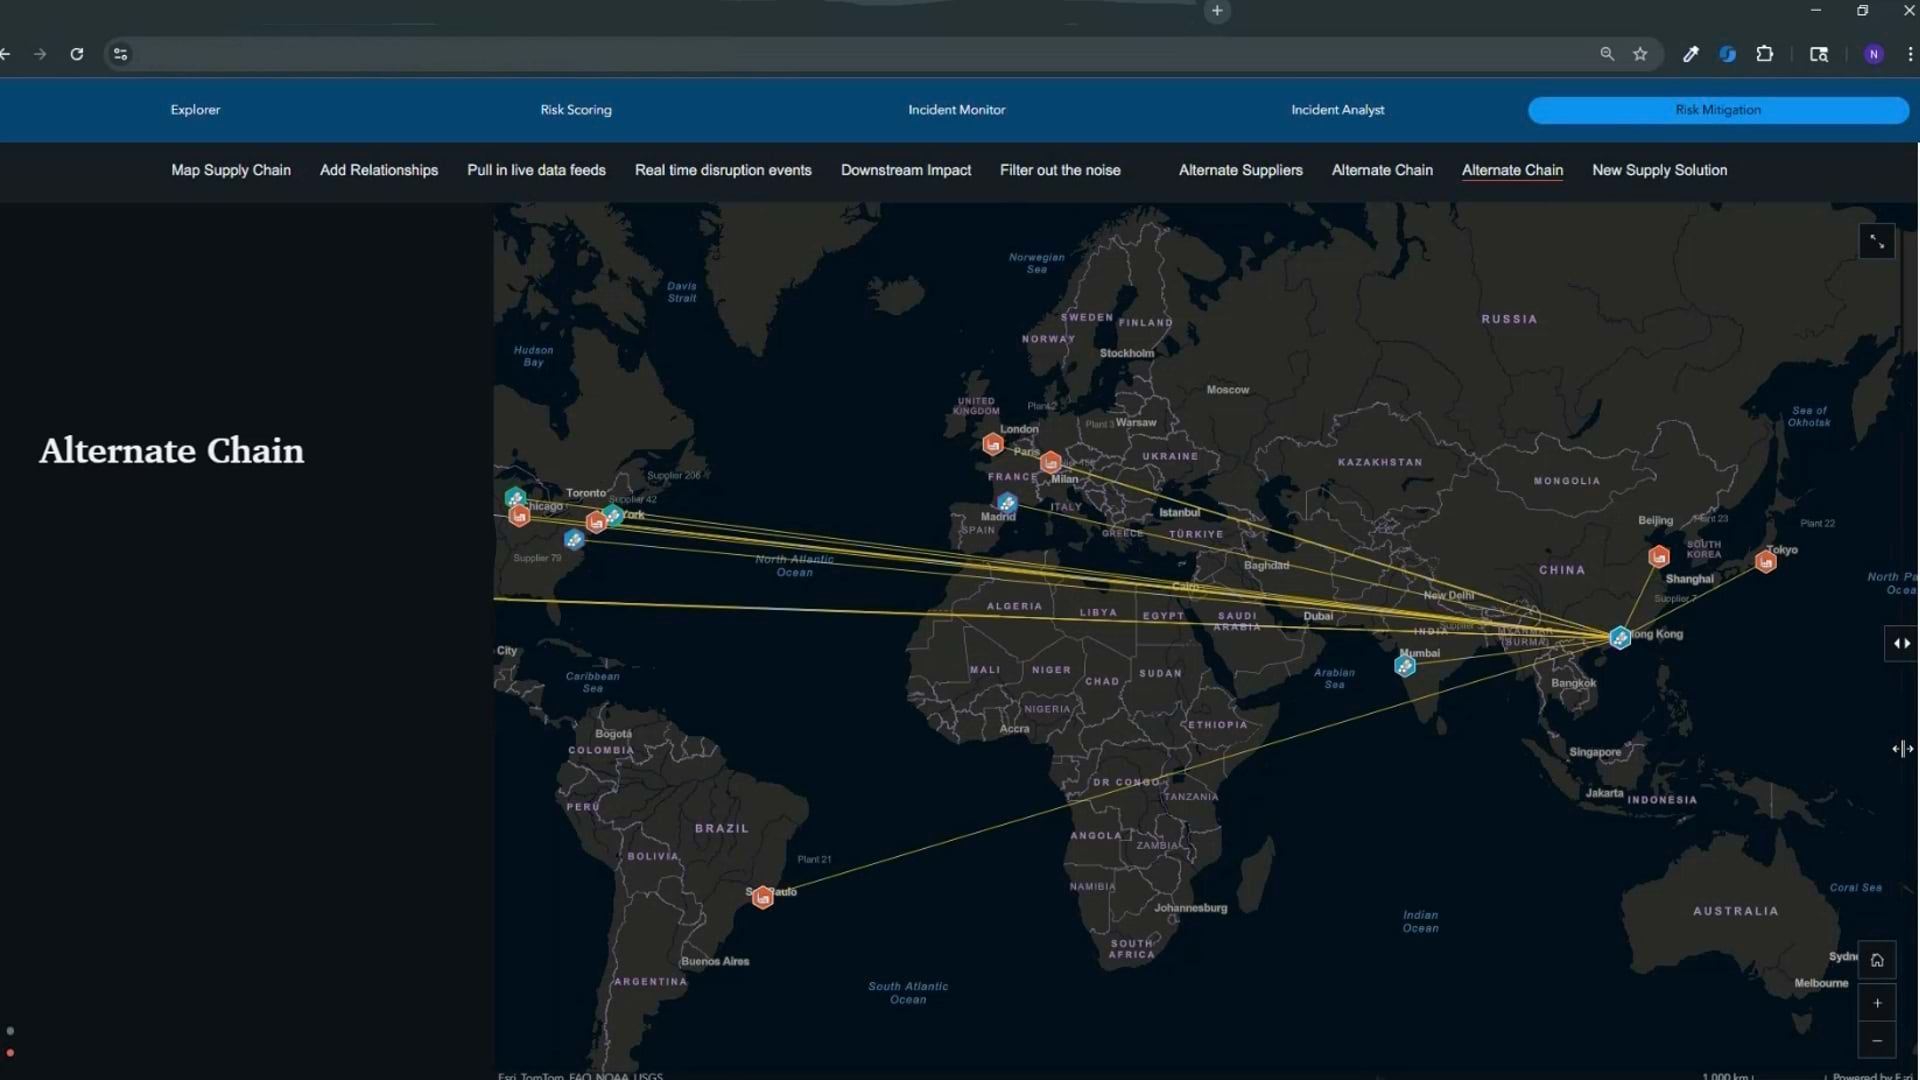
Finding New Routes to Stability with Location Analytics
The video shows how a GIS analyst draws a boundary around the earthquake zone. This tells the supply chain model to avoid suppliers in that area and find new routes.
Geospatial algorithms then generate the most efficient pathways between supply facilities and equipment manufacturers or retail stores.
Gliding a slider back and forth produces a before-and-after view of the supply chain disruption. Analysts can use this visualization to brief executives on the new shape of the organization’s global network.
With a temporary supply base in Singapore, the web of shipping lanes and the geographic complexion of suppliers shifts. But thanks to location analytics, the flow of goods remains stable and stores stay stocked with inventory.
Turning What-If Questions into Simulations
The video focuses on an earthquake, but a supply chain analyst can use the same location technology to respond to many other events, like the sudden rollout of regional tariffs or the discovery that a Tier 3 supplier is engaged in deforestation.
With a GIS map, supply chain departments can turn a senior leader’s question—What are our options?—into real-time simulations, played out on a screen in a conference room. This new ability to redesign supply networks ultimately rests on a strong foundation of geographic data.
When companies can map who their suppliers are, where they’re located, and how supply nodes are connected, they can convert this location intelligence into decisive action.
The Esri Brief
Trending insights from WhereNext and other leading publicationsTrending articles

December 5, 2024 |

March 3, 2026 |

June 23, 2026 |

March 17, 2026 |

April 7, 2026 |

June 9, 2026 |