The number of companies publicly committing to net-zero carbon emissions has become a meaningful barometer for corporate seriousness about the climate change threat. In October alone, the world’s largest steel company, ArcelorMittal, and Europe’s largest bank, HSBC, added their names to a rapidly expanding group with net zero ambitions, including Google, BP, Walmart, Microsoft, PepsiCo, Apple, Ford Motor Company, Amazon, Verizon, and many others. Most plan to be carbon-neutral in 10–30 years.
With wildfires consuming California, floods blanketing the Midwest, and superstorms striking the Eastern seaboard, the disruptive effects of climate change on everyday life and business continuity are impossible to ignore. Business leaders are rewriting strategies around sustainability and environmental impact, and employing advanced technology like a geographic information system (GIS) to analyze data on how their operations contribute to greenhouse gas production and associated carbon emissions.
A major driver of greenhouse gases is energy use. A recent EPA estimate blamed electricity production for nearly a third of all US greenhouse gas emissions in 2018, second only to the transportation sector. Another study calculated that electricity generation creates 40 percent of global carbon emissions. For business leaders working to become carbon-neutral, getting a handle on power consumption across facilities is likely a top priority.
Putting Power in Motion
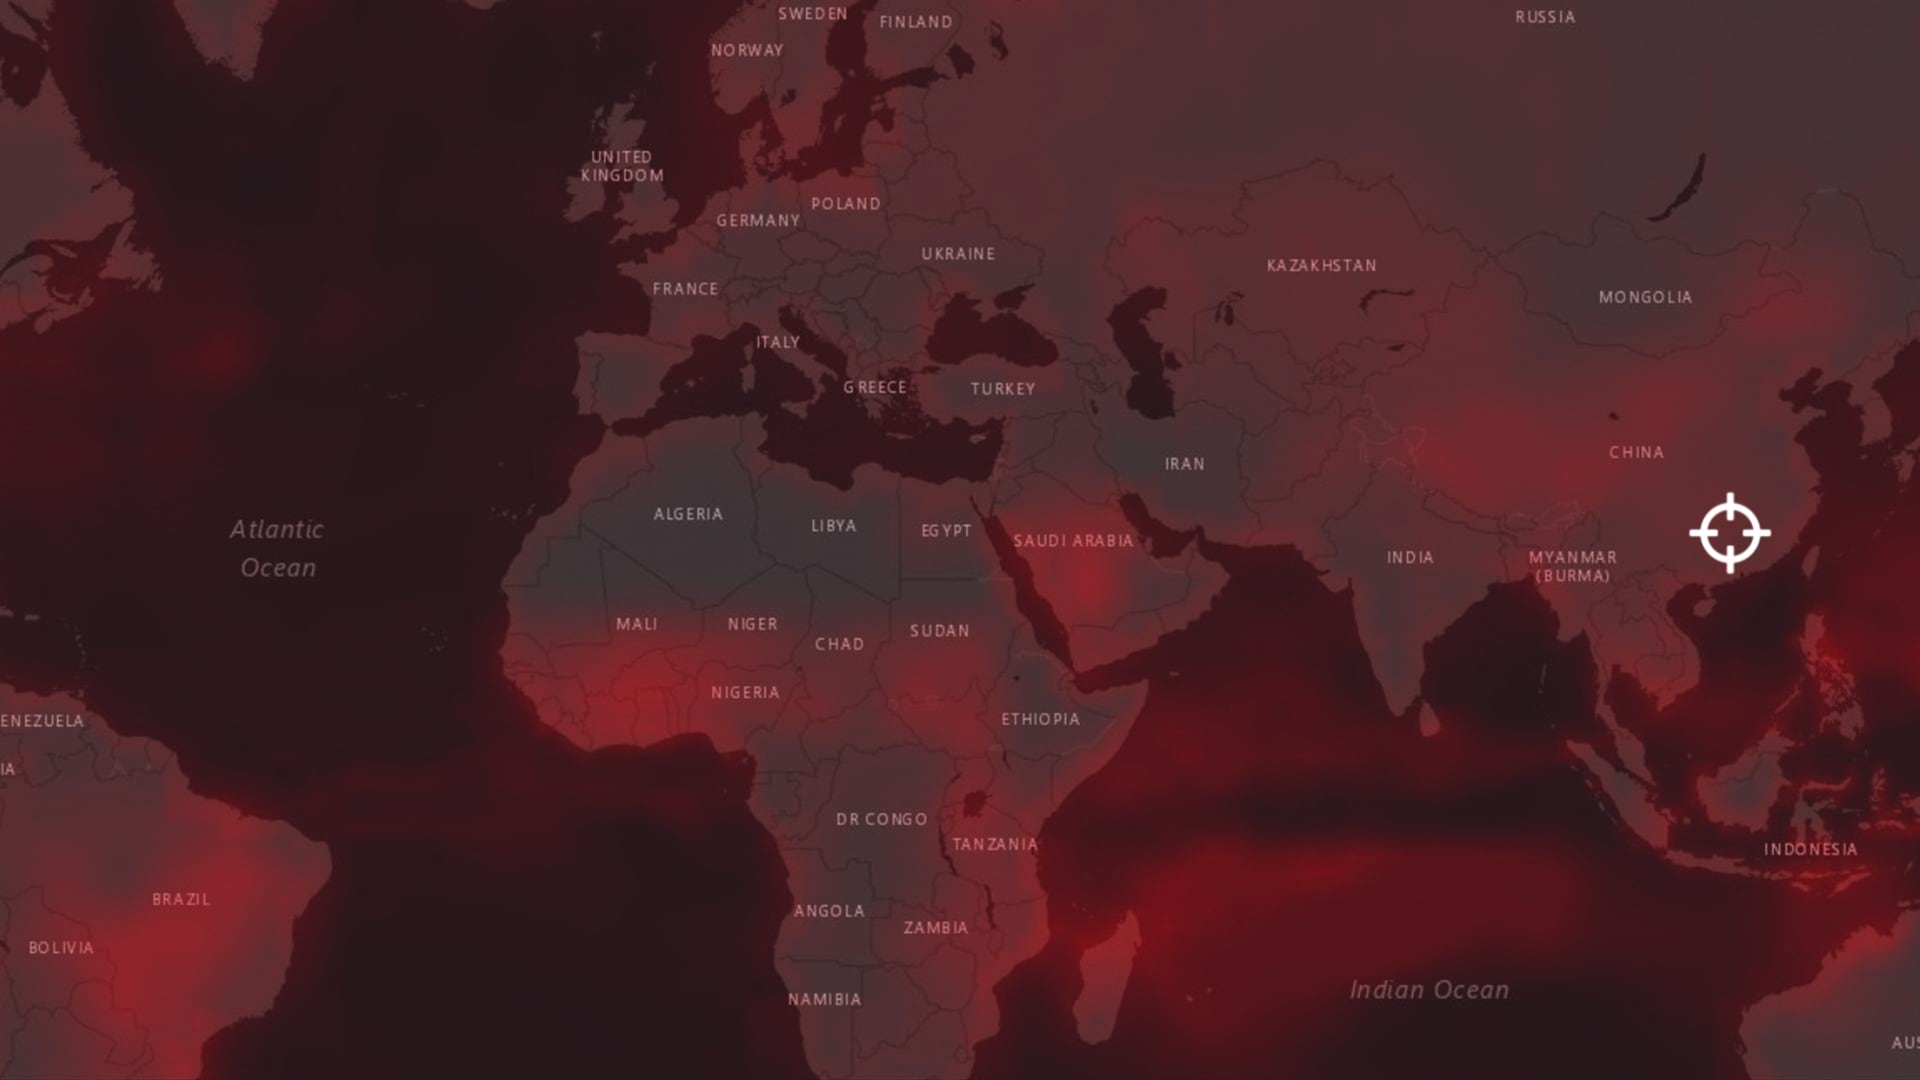
In order to track, forecast, and visualize factors like energy consumption and its link to carbon emissions, innovative companies are relying on location intelligence—generated by the analytical and predictive capabilities of GIS technology. Executives can use a GIS-powered dashboard or smart map to reveal climate-related data across the geography of their networks, creating a visual picture to clarify decisions about where to makes changes to reach net-zero goals.
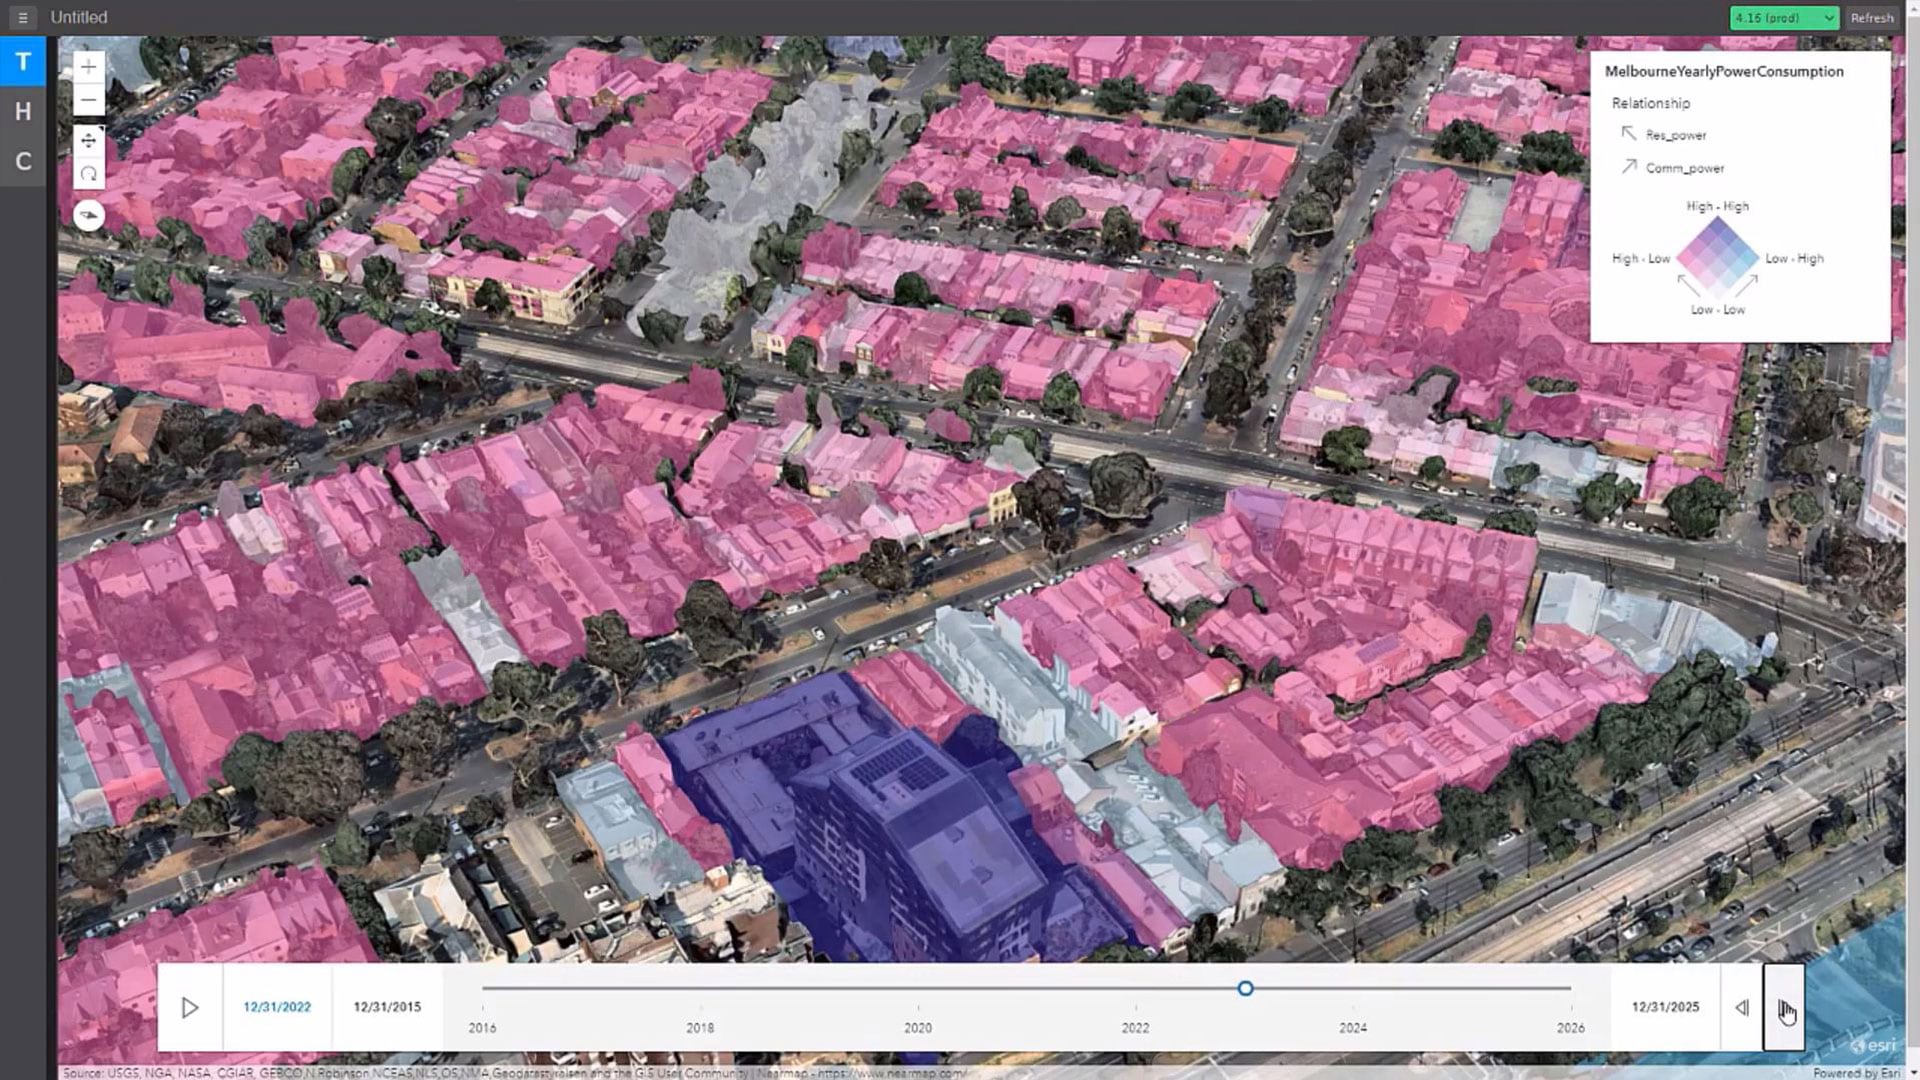
The video below demonstrates the simplicity a smart map can bring to complex tasks like tracking and predicting emissions. Based on a model used by an Australian utility, this map shows four quadrants of Melbourne, forecasting how electricity use is projected to evolve over the course of a decade, from 2016 to 2026. The buildings mapped represent a mix of residential and commercial use; the color-coded diamond legend designates residential areas in sepia tones and commercial in blue, with hues darkening as power consumption increases.
While executives could study the same data in a spreadsheet, the 3D map makes it easier to see power consumption trends across multiple city blocks. Leaders could use a smart map like this to project various scenarios out to 2050. That is the year many companies have targeted for becoming net-zero because scientists say additional emissions beyond that point will raise global temperatures to catastrophic levels.
By modeling different datasets based on potential changes in energy use—including the effects of renewable energy or more energy-efficient lighting—executives could anticipate how various decisions might lead to different outcomes in electricity consumption and emissions.
The same GIS-based dashboard could be applied to a corporate campus or national network of offices or stores, not only to strengthen decision-making at the C-suite level, but to communicate to shareholders or customers the steps a company is taking to cut carbon emissions, and what that will look like over time.
Steps to A Net Zero Future
Location intelligence can also inform companies’ efforts to take the steps necessary to reach net-zero emissions. Indoor location intelligence, powered by GIS and IoT sensors, highlights trends in office space use, pointing to techniques like automating lights or controlling temperatures to reduce energy use in areas with less foot traffic. Smart maps can play a similar role on a much broader operational scale, giving COOs visibility on their organizations’ carbon footprint throughout supply chains across the globe. That same technology can empower business leaders to identify suppliers or partners that are more conscious of energy use and its effect on carbon emissions.
A goal as big as limiting global climate change can feel daunting, even for internationally minded captains of industry. It can be difficult to see the link between, say, the light switches and thermostats used in corporate offices and the carbon emissions and greenhouse gases generated over decades. The analytics and visual impact of technologies like GIS make it possible to illuminate those links, showing how small steps contribute to real change.
To follow key developments in business strategy and location intelligence, sign up for the biweekly Esri Brief newsletter.
The Esri Brief
Trending insights from WhereNext and other leading publicationsTrending articles

December 5, 2024 |

June 23, 2026 |

June 2, 2026 |

April 7, 2026 |
March 17, 2026 |

March 3, 2026 |