Businesses have a Goldilocks problem with the planet’s most vital resource. They have too much water in places they don’t want it, and too little water in places where it’s most needed.
Profound changes in water supply around the globe are creating new risks across industries. In water-stressed areas, manufacturers, apparel firms, and farmers must balance water consumption with the needs of local communities. In other places, increased rainfall can trigger flooding in retail centers and shut down supply corridors—or lead farmers to reconsider the types and locations of crops they grow.
The nonprofit CDP estimates that water-related disruptions cost companies billions of dollars in value each year.
Businesses and advisers are turning to mapping and analytics—interpreting data in a geographic context—to reassess the impacts of water on operations, physical assets, supply chains, employees, and investments.
At global consultancy PwC, its solution called Geospatial Climate Intelligence (GCI) relies on location technology to model climate impacts for Fortune 500 clients. Of the 12 main perils the platform monitors, many involve water directly or indirectly, including floods, cyclones, storm surges, drought, sea level rise, and heat stress.
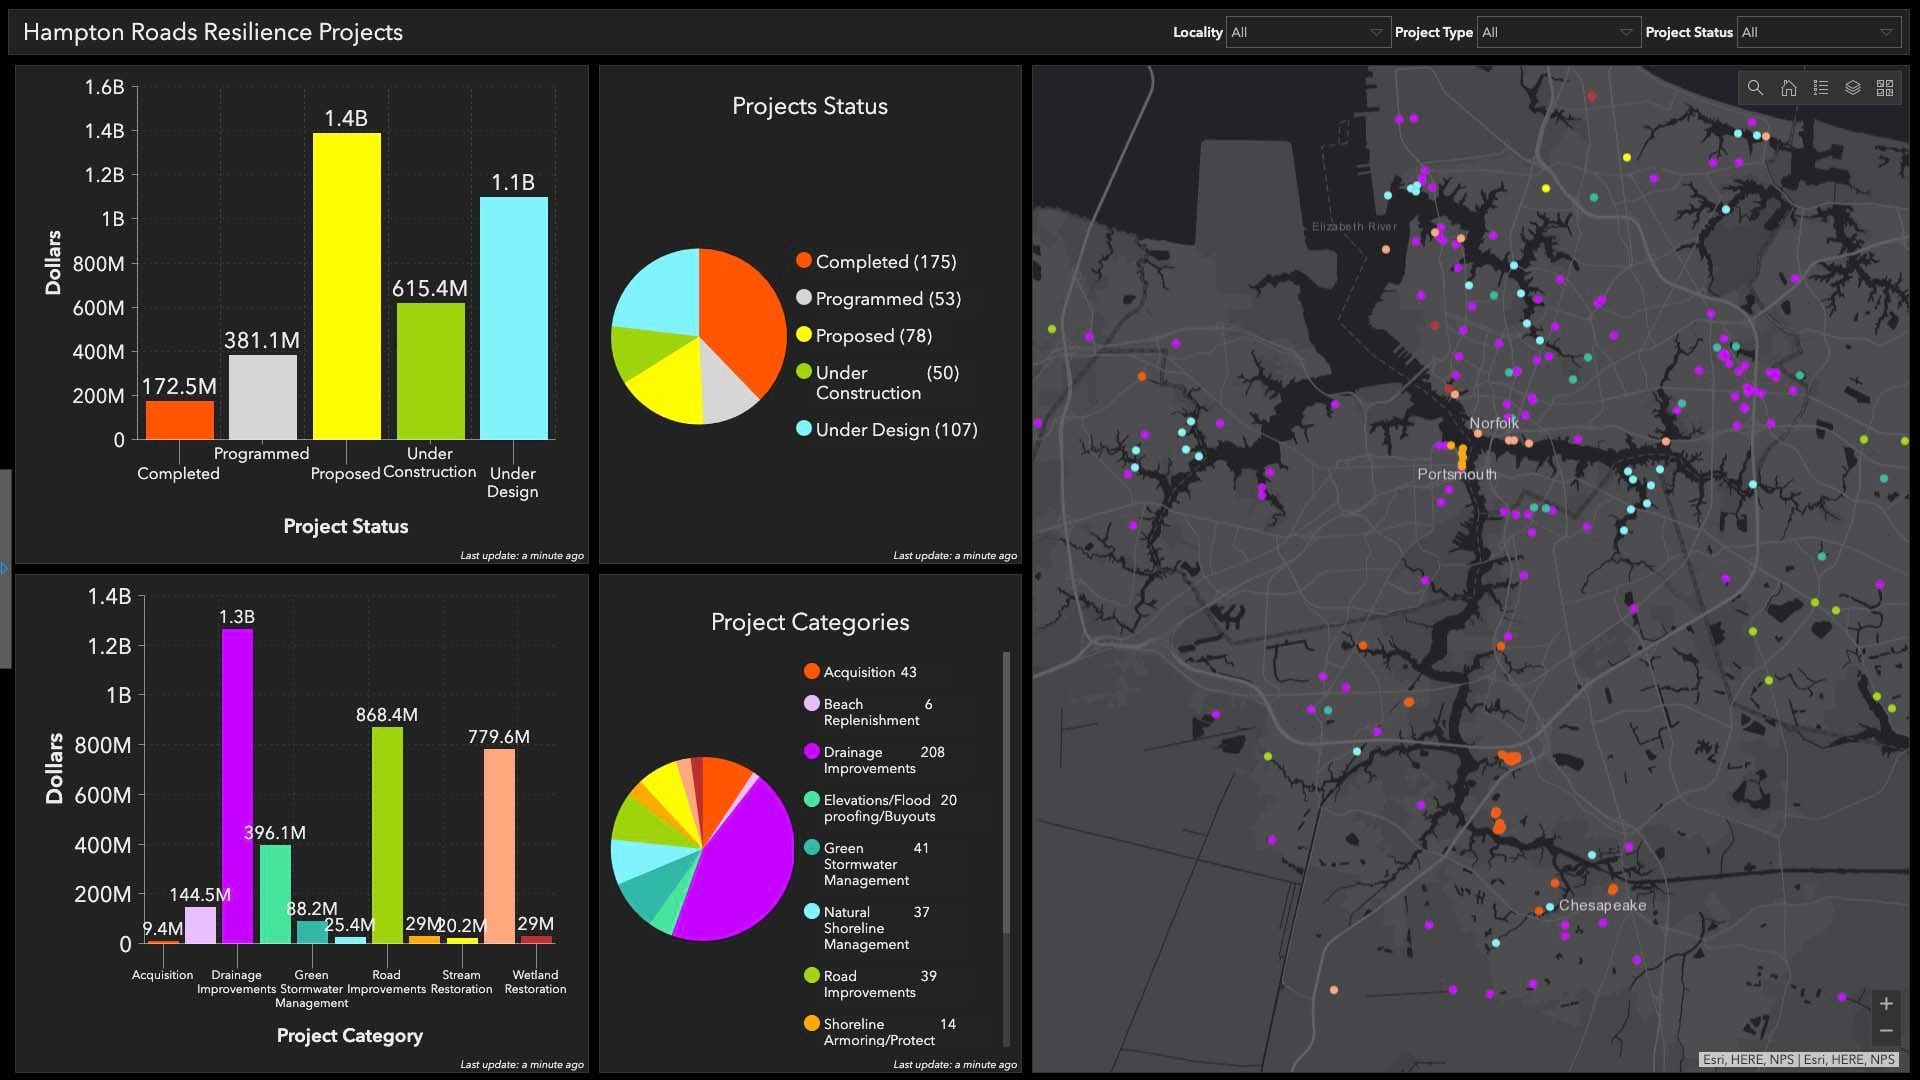
With a dashboard powered by geographic information system (GIS) software, PwC’s consultants analyze companies’ physical footprints to identify risks. This location intelligence helps organizations adapt strategies for greater resilience against water-related challenges.
“There’s something about the GIS technology that brings [the situation] to life,” says Steve Bochanksi, who leads PwC’s climate risk modeling team. “You can contextualize the risk profile.” By blending climate data and satellite imagery, “we can zoom in and see why this particular location is at higher risk than this location a few miles away.”
The New Global Map of Water Supply and Impacts
PwC’s sustainability team—including climate scientists, actuaries, catastrophe modelers, and data scientists—builds hazard and loss models from over 100 data sources, providing business leaders with crucial clarity for long-term investment decisions.
Their models allow PwC’s climate risk team to deliver precise projections for the frequency and severity of extreme events through the year 2100.
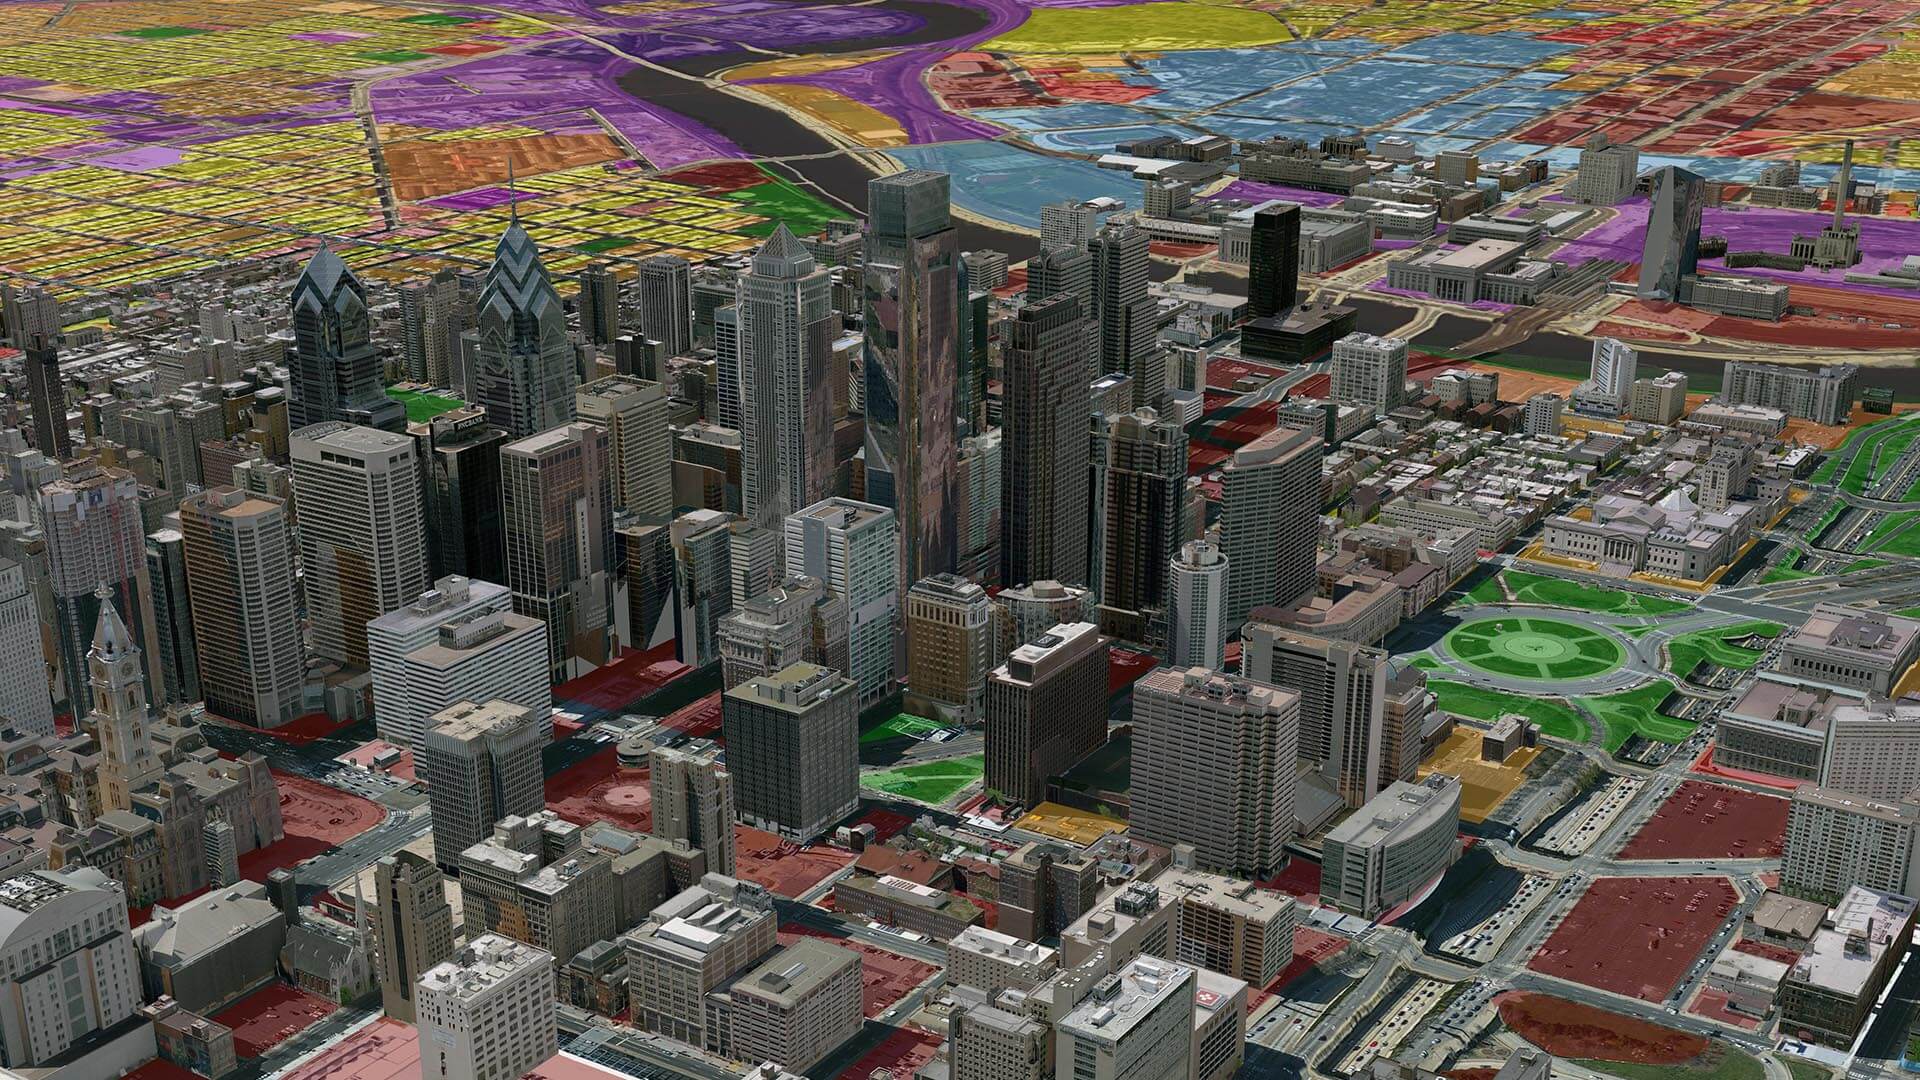
GIS shows these risks on a global map of a client’s offices, warehouses, and other key locations. With a click, clients can see risks from individual perils like extreme heat or clusters of hazards. Areas of highest exposure are colored dark yellow, orange, or red.
“It’s just such a compelling visual,” Bochanski says. “It gets their attention right away. As a way to engage the client in conversation, it’s super useful.”
For a more granular view—down to 10-meter resolution in the US for some hazards—analysts can zoom in on a warehouse, for instance, and project its vulnerability to Category 3 hurricanes over the next decade. Analyzing a building’s construction type or the vegetation surrounding a facility helps the team more accurately estimate damage due to hazards like storms.
Three fields in particular—technology, manufacturing, and agriculture—illustrate how savvy companies are using climate risk intelligence to stay ahead of rapid changes in the resource that covers most of the globe.
AI’s Rise Elevates the Value of Water for Tech Firms
Water is a critical input for some of the most advanced technological facilities on the planet—from semiconductor fabrication plants to data centers powering AI platforms. For many data center operators, water is the cheapest way to cool servers that require temperatures of 64 to 72 degrees to function.
Tech companies need geographic context to ensure that facilities built today won’t exhaust the water supply—or be underwater—in the years ahead.
“It could flood on one side of the street and not the other, so if you’re off by a little bit, that can make a difference in your risk assessment,” Bochanski explains. Some PwC clients that run data centers are weighing a switch to air-cooling methods based on location insight that shows water costs rising or efficacy of water-based cooling decreasing as temperatures rise.
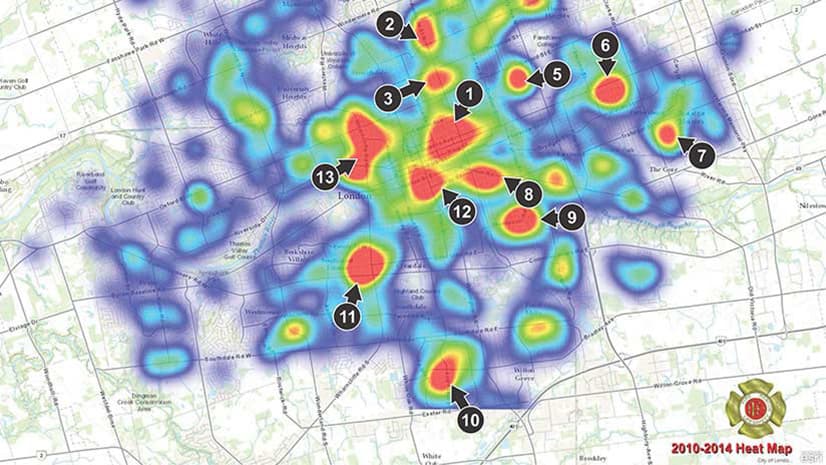
A single data center can require as many as five million gallons of water per day. When multiple data centers are concentrated in one area—like Phoenix, which has nearly 60—companies risk sapping a community’s already strained water supply. A GIS-based hot spot analysis can reveal negative trends in water use, helping companies manage reputational risk and regulatory compliance.

When I first saw how another team at PwC was using GIS technology, I immediately saw its potential for our work and knew we had to bring it in.
To Protect Supply Chains, Manufacturers Seek a Global Picture of Water Risk
Manufacturing facilities use vast volumes of water for cleaning, cooling, heating, and other industrial purposes. They also rely on intricate global supply chains increasingly vulnerable to water-related impacts.
India, for example, has become a hub for aerospace parts production, with factories that build composite floor beams and small engines. The country is also experiencing some of the sharpest increases in rainfall in its history. Waterlogged roads have shut down transportation networks and kept warehouses from replenishing supply, leading to stockouts for manufacturers and retailers.
With the precise location intelligence provided by PwC’s GCI tool, a US-based plane manufacturer might coordinate with Delhi-based suppliers to shift production away from an area endangered by flooding. Similarly, insight on water pollution or water stress could inform longer-term strategies about which regions to source parts from.
For food makers and other manufacturers reliant on agricultural inputs, PwC’s custom-built agricultural dashboard evaluates growing conditions around the world. The GCI tool assesses regional drought risks to anticipate impacts on pricing or production.
For a global picture of water risk, a manufacturing CEO could use a smart map to analyze which ports in the organization’s supply chain are most vulnerable to natural hazards, or how population migration due to water stress could impact a supplier’s workforce.
To Find the Future of Farming, Follow the Water
For farmers, water competition and stress are immediate realities, not abstractions. Currently, a quarter of all crops are grown in areas with unreliable or highly stressed water supplies, or both.
Agricultural companies use mapping and analytics to identify crop-growing regions that might be too water stressed to support cultivation in the future.
The same analysis can indicate which areas may grow more favorable for farming as water availability and temperatures shift. In the US, there are signs that the Corn Belt—the center of corn and soybean production—is already moving northward, out of Illinois and Iowa and into Minnesota and South Dakota.
At PwC, Bochanski and team advise clients on optimal farmland irrigation using geospatial climate and water data analysis. When projections show suitable temperatures but decreasing precipitation for a region, farmers can use this insight to invest in new irrigation infrastructure.
Location Insights Guide Assessment—and Action—on Water
Location analytics from advisers like PwC provide companies the insight they need to maximize resilience. With a map that shows exactly where water risks are highest, firms can install corrugated metal roofs or flood barriers where they’re needed. An enterprising firm could use the same risk map to invest locally in technology that improves water efficiency, storage, or distribution.
Informed by location-savvy climate risk models, businesses can make sure they work with—not against—a natural resource fundamental to communities and businesses everywhere.
The Esri Brief
Trending insights from WhereNext and other leading publicationsTrending articles

December 5, 2024 |

March 3, 2026 |

March 17, 2026 |

June 23, 2026 |

April 7, 2026 |
January 4, 2018 |