Insights for ArcGIS just got better! In the 2.0 release, you get optimized analysis tools to reveal more of the patterns, trends, and relationships that are hidden in your data. Now you can do powerful exploratory analysis faster and easier than ever.
What makes it faster and easier? Take a look at the arsenal of capabilities you can take advantage of with Insights for ArcGIS 2.0 and ArcGIS Enterprise 10.5.1.
Examine data with greater speed and performance
Just when you thought Insights couldn’t perform any better, it’s now faster at loading data and performing analysis. This makes it so much easier for you to explore large datasets or multiple data sources, and identify gaps. Maybe most importantly, it means you can quickly visualize and understand your data before you take it to ArcGIS Pro for advanced analysis work.
Interested in an Insights to ArcGIS Pro workflow? Check out the Mapwoman: The Quest for Insights Story Map!

More data sources available and ways to manipulate data
Is your organization an Oracle shop? Insights for ArcGIS 2.0 has added support for Oracle databases. You can now connect directly to Oracle databases from within Insights, as well as previously supported SQL Server, SAP HANA, and Teradata databases. This includes support for R scripts in views and stored procedures within supported native relational databases. Creating direct database connections means that you can easily access your data from Insights and see increased performance with database data.
Comma separated value (CSV) files can now be used the same as Excel workbooks, meaning you do not have to convert your CSV data to an Excel Workbook before you begin your analysis.
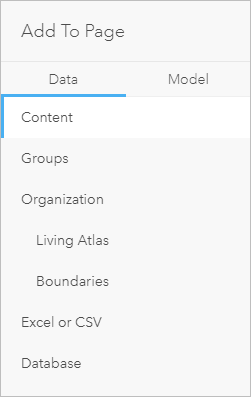
It is also easier to access your previously available data from Living Atlas, standard boundaries, and Groups in ArcGIS Enterprise. Tabs for these data sources have been added to the Add to Page pane so that you can easily find and access the data you need.
Additionally, we added new functions for calculating fields so you can manipulate your data and perform analysis directly in Insights. Big time saver!
More chart options to explore and analyze your data
Visualize and analyze your data in new ways with four chart types that are now available in Insights: Box plots, data clocks, chord diagrams, and heat charts. Charts are an important non-spatial addition to your analysis that can help you learn more about your data. When paired with a map using the same dataset, charts can be used to select data and visualize both the spatial and non-spatial distribution at the same time.
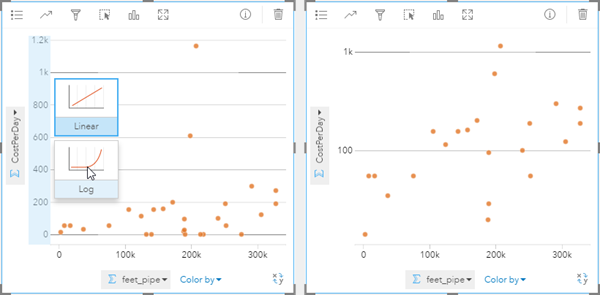
Some charts, such as scatter plots, now have the ability to switch between logarithmic and linear scales. Logarithmic scales are an important tool for visualizing data that is spread across large numeric ranges or has outliers. This makes finding relationships and patterns in data so much easier.
More style control over your visualizations
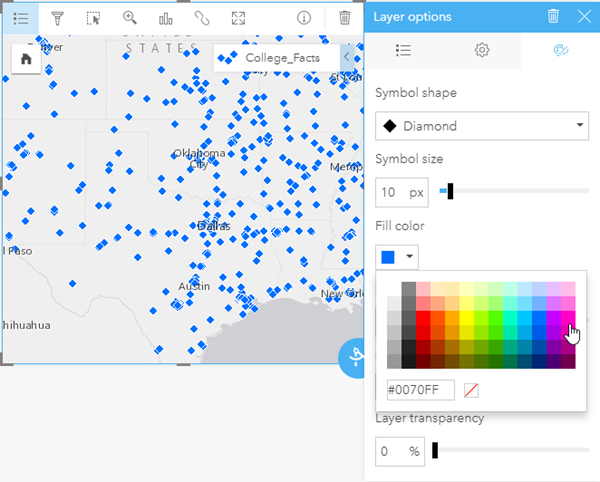
There have been new additions to help you customize the look of your maps. The improved legend includes the ability to style your data using an expanded color pallet or custom colors using hex values. New at Insights 2.0, you can also change the basemap of a single card or an entire page from directly within Insights. These changes mean that it is easier for you to make sure that your maps tell the story that you want them to tell
 .
.
Preview support for ArcGIS GeoAnalytics Server
Support for ArcGIS GeoAnalytics Server is now in Preview mode. If GeoAnalytics Server is configured with your ArcGIS Enterprise organization, then you now have access to hosted feature layers with data stored in the spatiotemporal big data store within Insights. Distributed storage and analytics from GeoAnalytics Server will be used automatically when applicable.
Don’t wait to act on Insights
Waiting for ArcGIS Online support? Running on ArcGIS 10.4 or older and concerned that a migration to 10.5.1 will impact your business? We’re here to help. You can use Esri Managed Cloud Services to get your organization up and running quickly with world-class hosting and management support. Teaming with Esri gives you peace of mind knowing that experts in cloud and GIS are managing your system. This frees you up to focus on discovering and sharing information. Learn more about Esri Managed Cloud Services.
Did you know that the release of ArcGIS Enterprise 10.5.1 includes an ArcGIS Enterprise Builder? It’s now easier to install and configure a base ArcGIS Enterprise deployment on a single machine.
Demo: Insights for ArcGIS 2.0
What better way to understand the value of Insights for ArcGIS 2.0, than to see it in action? Check out this retail demo!
Want more?
The ArcGIS Blog has new posts about Insights. Use the Insights for ArcGIS tag to find news and tips for using Insights. The ArcGIS YouTube channel also includes an Insights for ArcGIS playlist, which can be used to find other helpful tips. Submit your questions to the product team via the Insights for ArcGIS GeoNet group or follow us to stay up to date on the latest news.
The quick exercise Get started with Insights for ArcGIS has been updated for version 2.0. This exercise is a great resource if you are new to Insights, or if you are looking for some inspiration in your analysis.


Commenting is not enabled for this article.