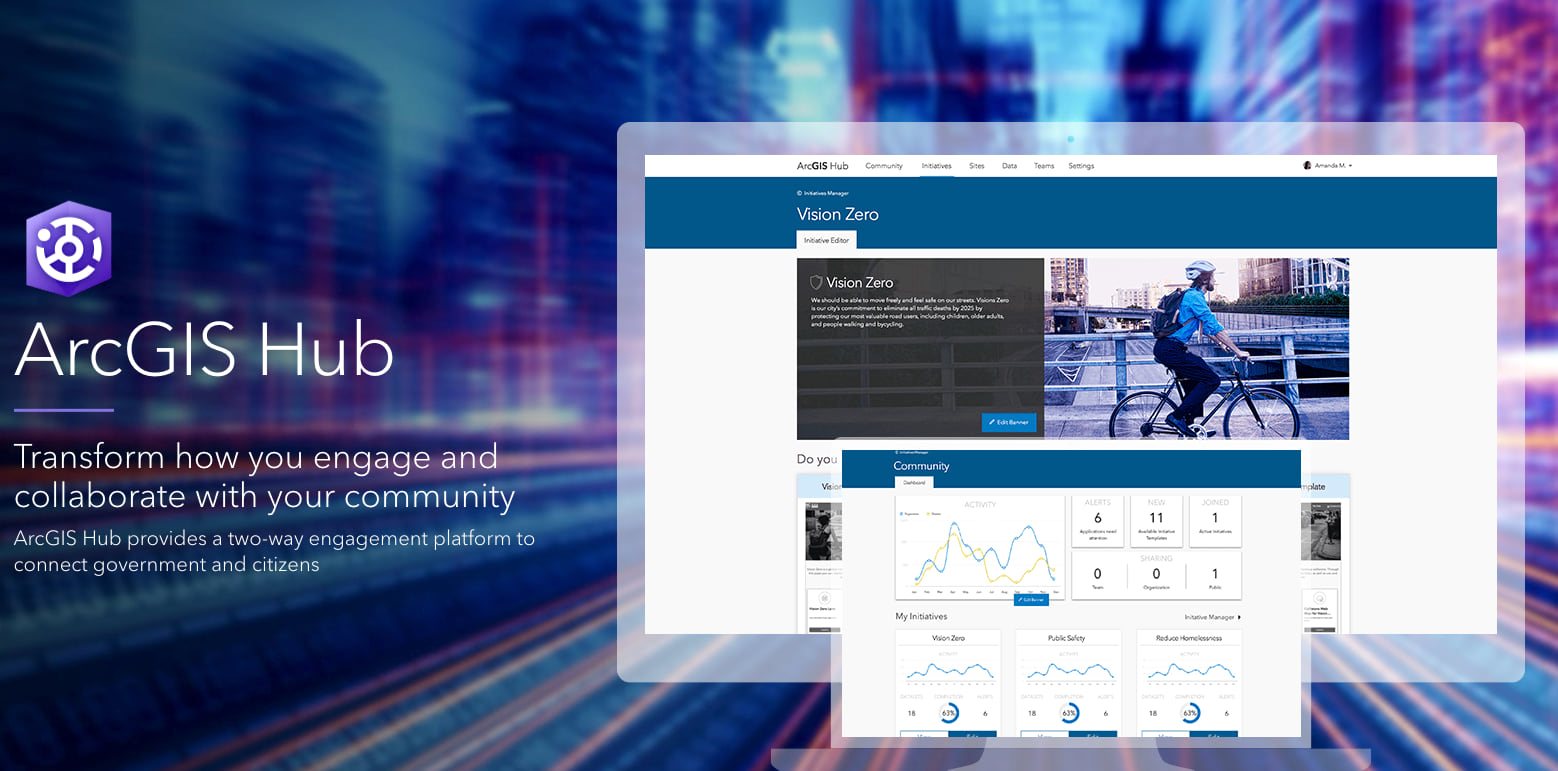
ArcGIS Hub gives your organization tools to help drive policy goals, connect to the public, and monitor citizen engagement. These tools include Open Data Sharing, Initiatives, and the Community and Events dashboards, all of which are foundational to Hub’s two-way citizen engagement platform.
Launched in July 2017, Hub updates frequently with changes to its features, making it easier for you and your community to connect and collaborate. In the past few months, recent changes have enhanced the overall ability of Hub to share knowledge through new communication and messaging features, expanded data visualization tools, new search capabilities, and an improved mobile experience.
ArcGIS Hub Initiative Templates
An ArcGIS Hub Initiative template empowers your data with a carefully crafted bundle of ArcGIS capabilities designed to give users broad & essential tools needed to plan, create and execute their strategies around a policy commitment or outcome they need to achieve. While you can build out your own Initiative, an Initiative template gives you a jumpstart by focusing your data on a particular issue or policy goal, such as the opioid epidemic or preparing for floods and power outages.
We continue to make enhancements to each Initiative template, and Hub currently includes 6 Initiative templates that focus on topics or issues our users are prioritizing. They include capabilities to Attract Local Business and Grow Local Economies, solutions to Increase Community Engagement and Pride, Reduce Homelessness, Tackle the Opioid Epidemic, Prevent Vector-Borne Disease as well as Reduce Pedestrian Deaths (Vision Zero). We design and develop our Initiatives with domain and ArcGIS expertise ensuring they offer immediate value and increase the likelihood of a modern, engaging mobile first experience for constituents.
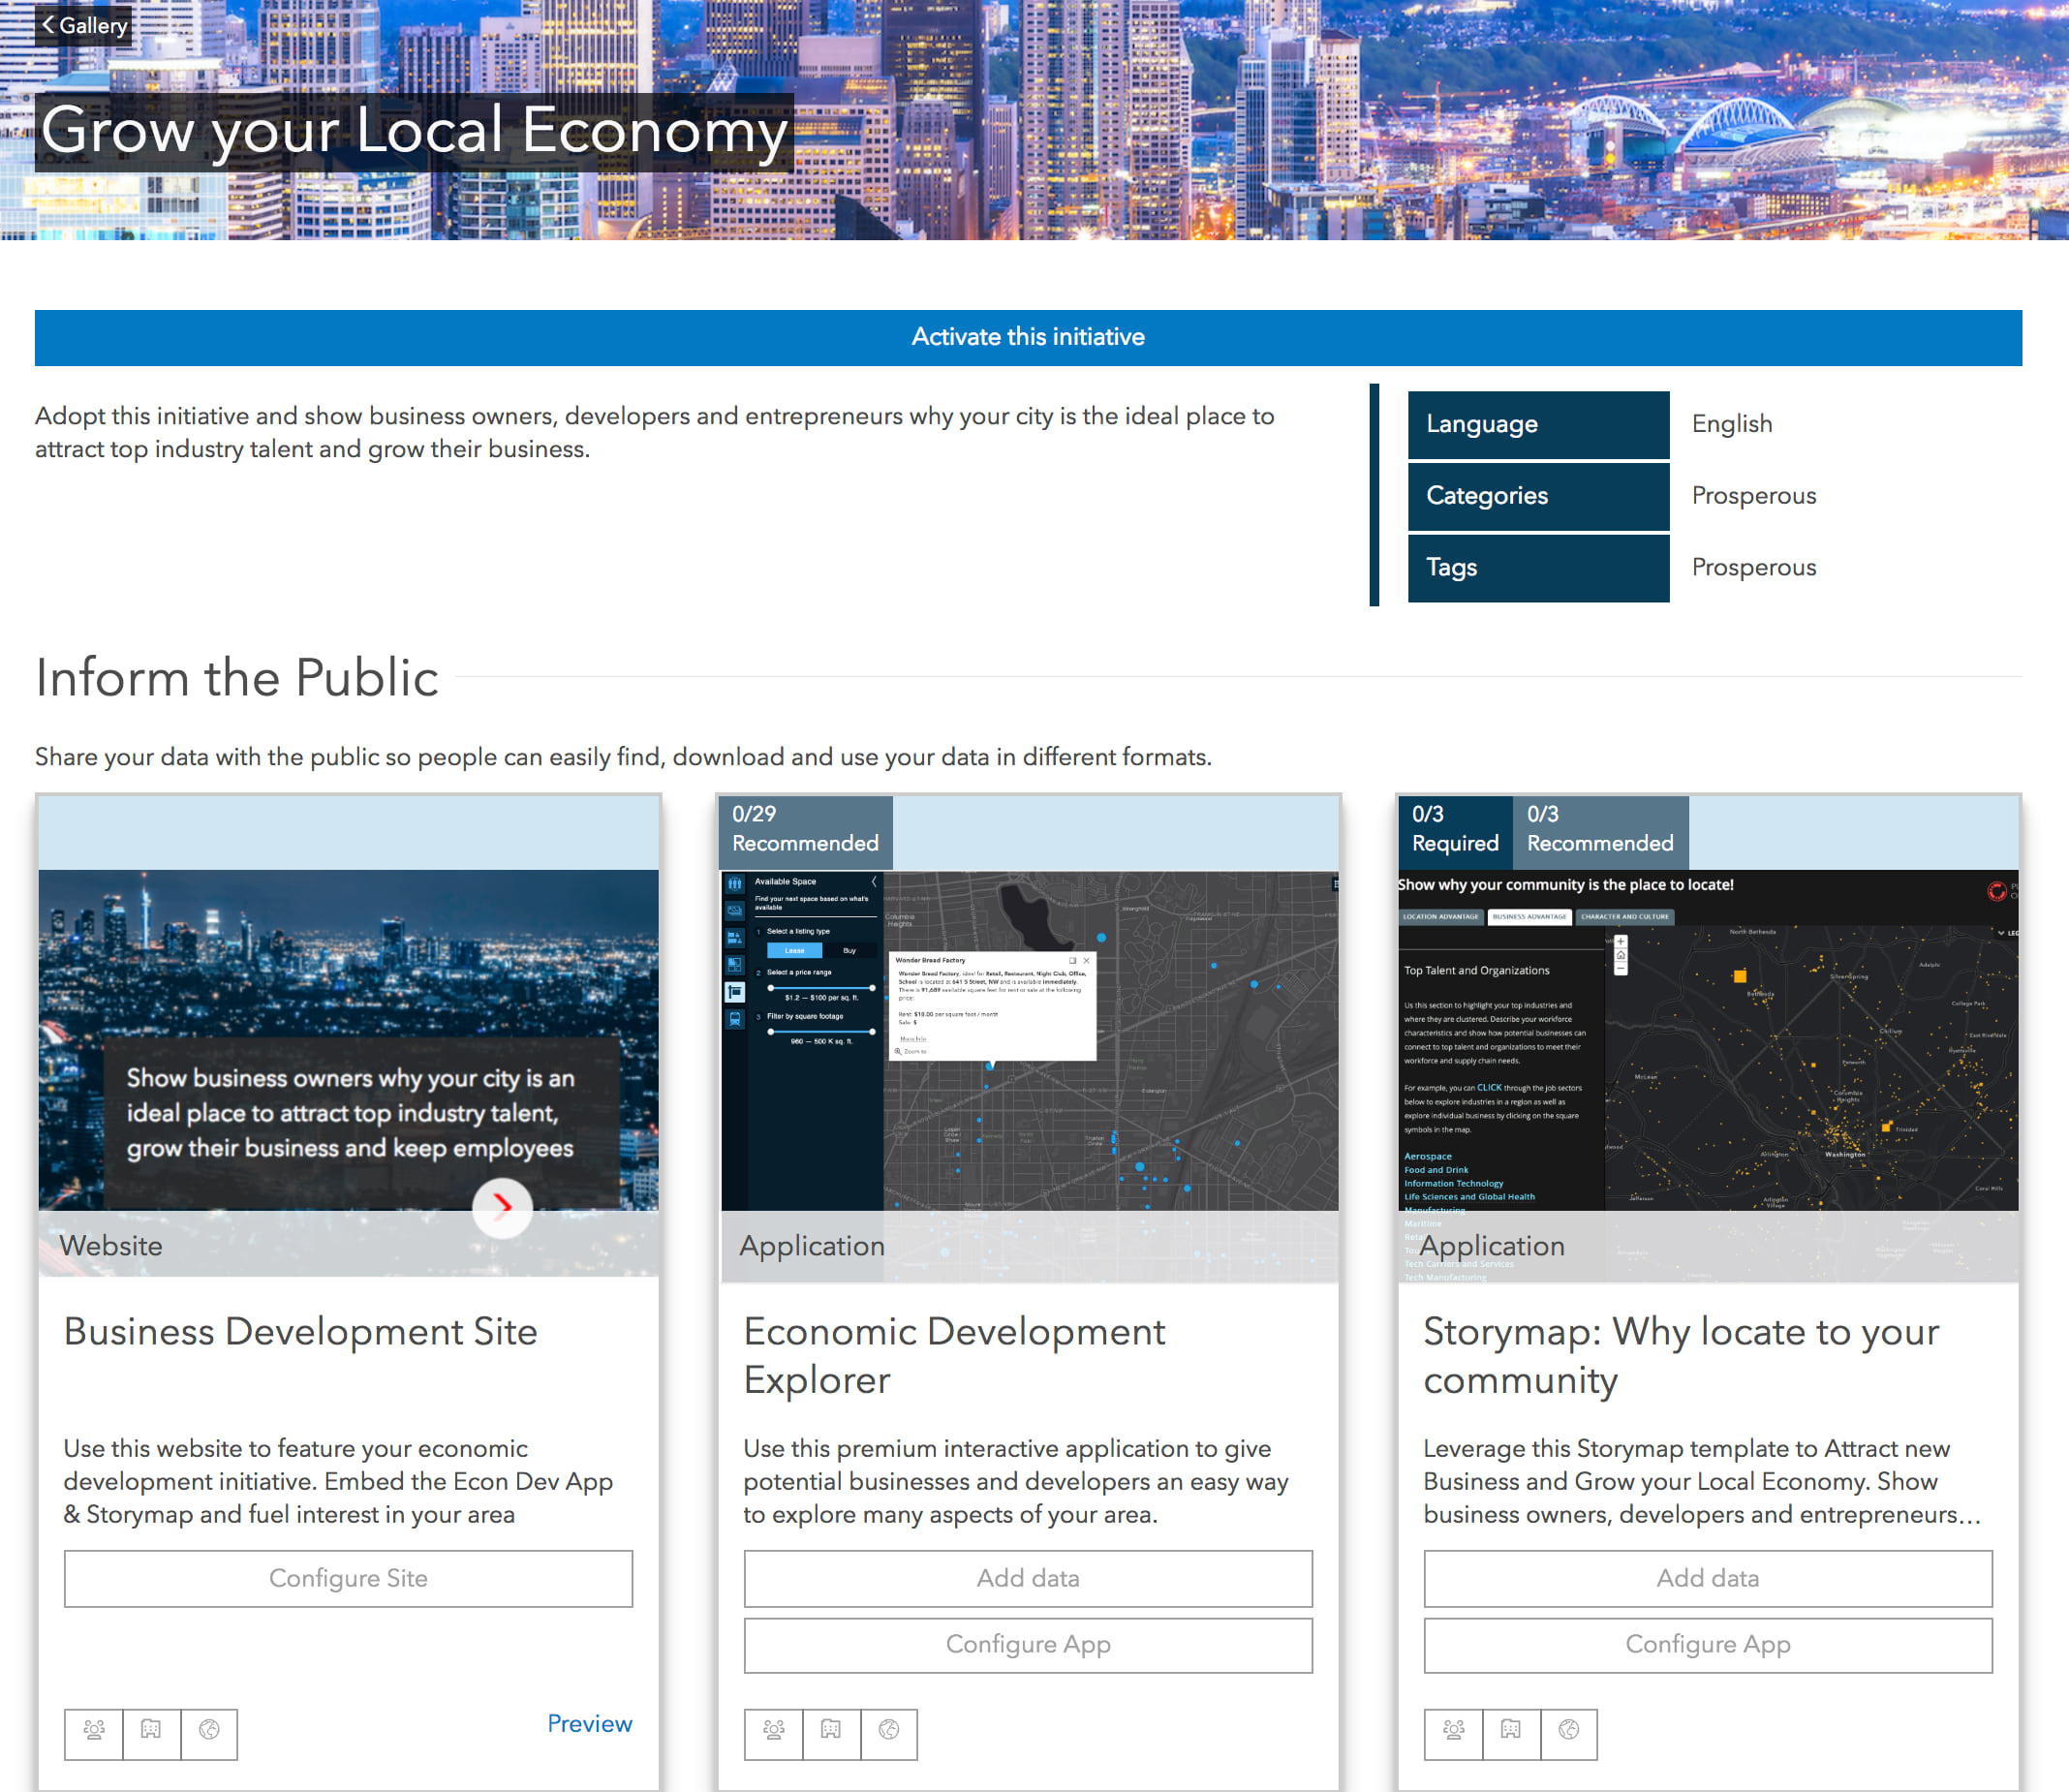
These templates include a range of apps like surveys, story maps, and web applications that guide you through which attribute data you will need to configure them. Other than sourcing this data (e.g. bicycle crashes and pedestrian fatalities for Vision Zero), the work is cut out for you. Story maps simply require your customization, and surveys include suggested questions ready to be published publicly.
Communications and Messaging
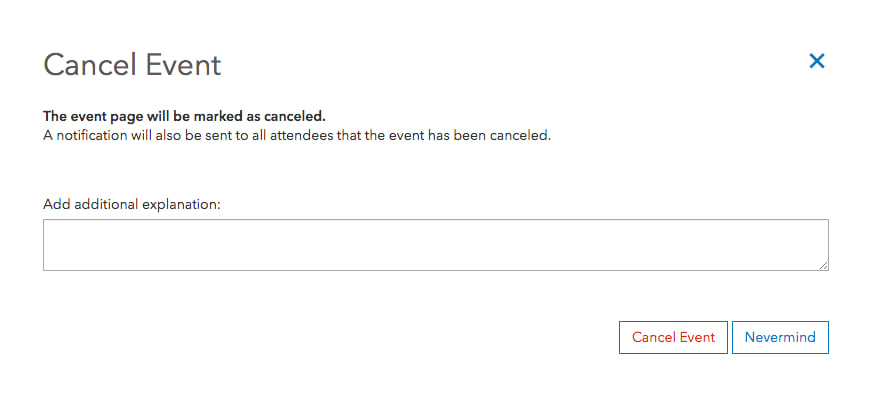
Organizations connect with citizens and monitor engagement through the community aspect of the Hub. With this feature, you can create events and link them to your Initiatives. Recent changes to the Events feature make it easier to communicate with community members, particularly in the event of a cancellation. Hub will automatically notify attendees by email, and now it gives you the option to send along an explanation.
Data Visualization
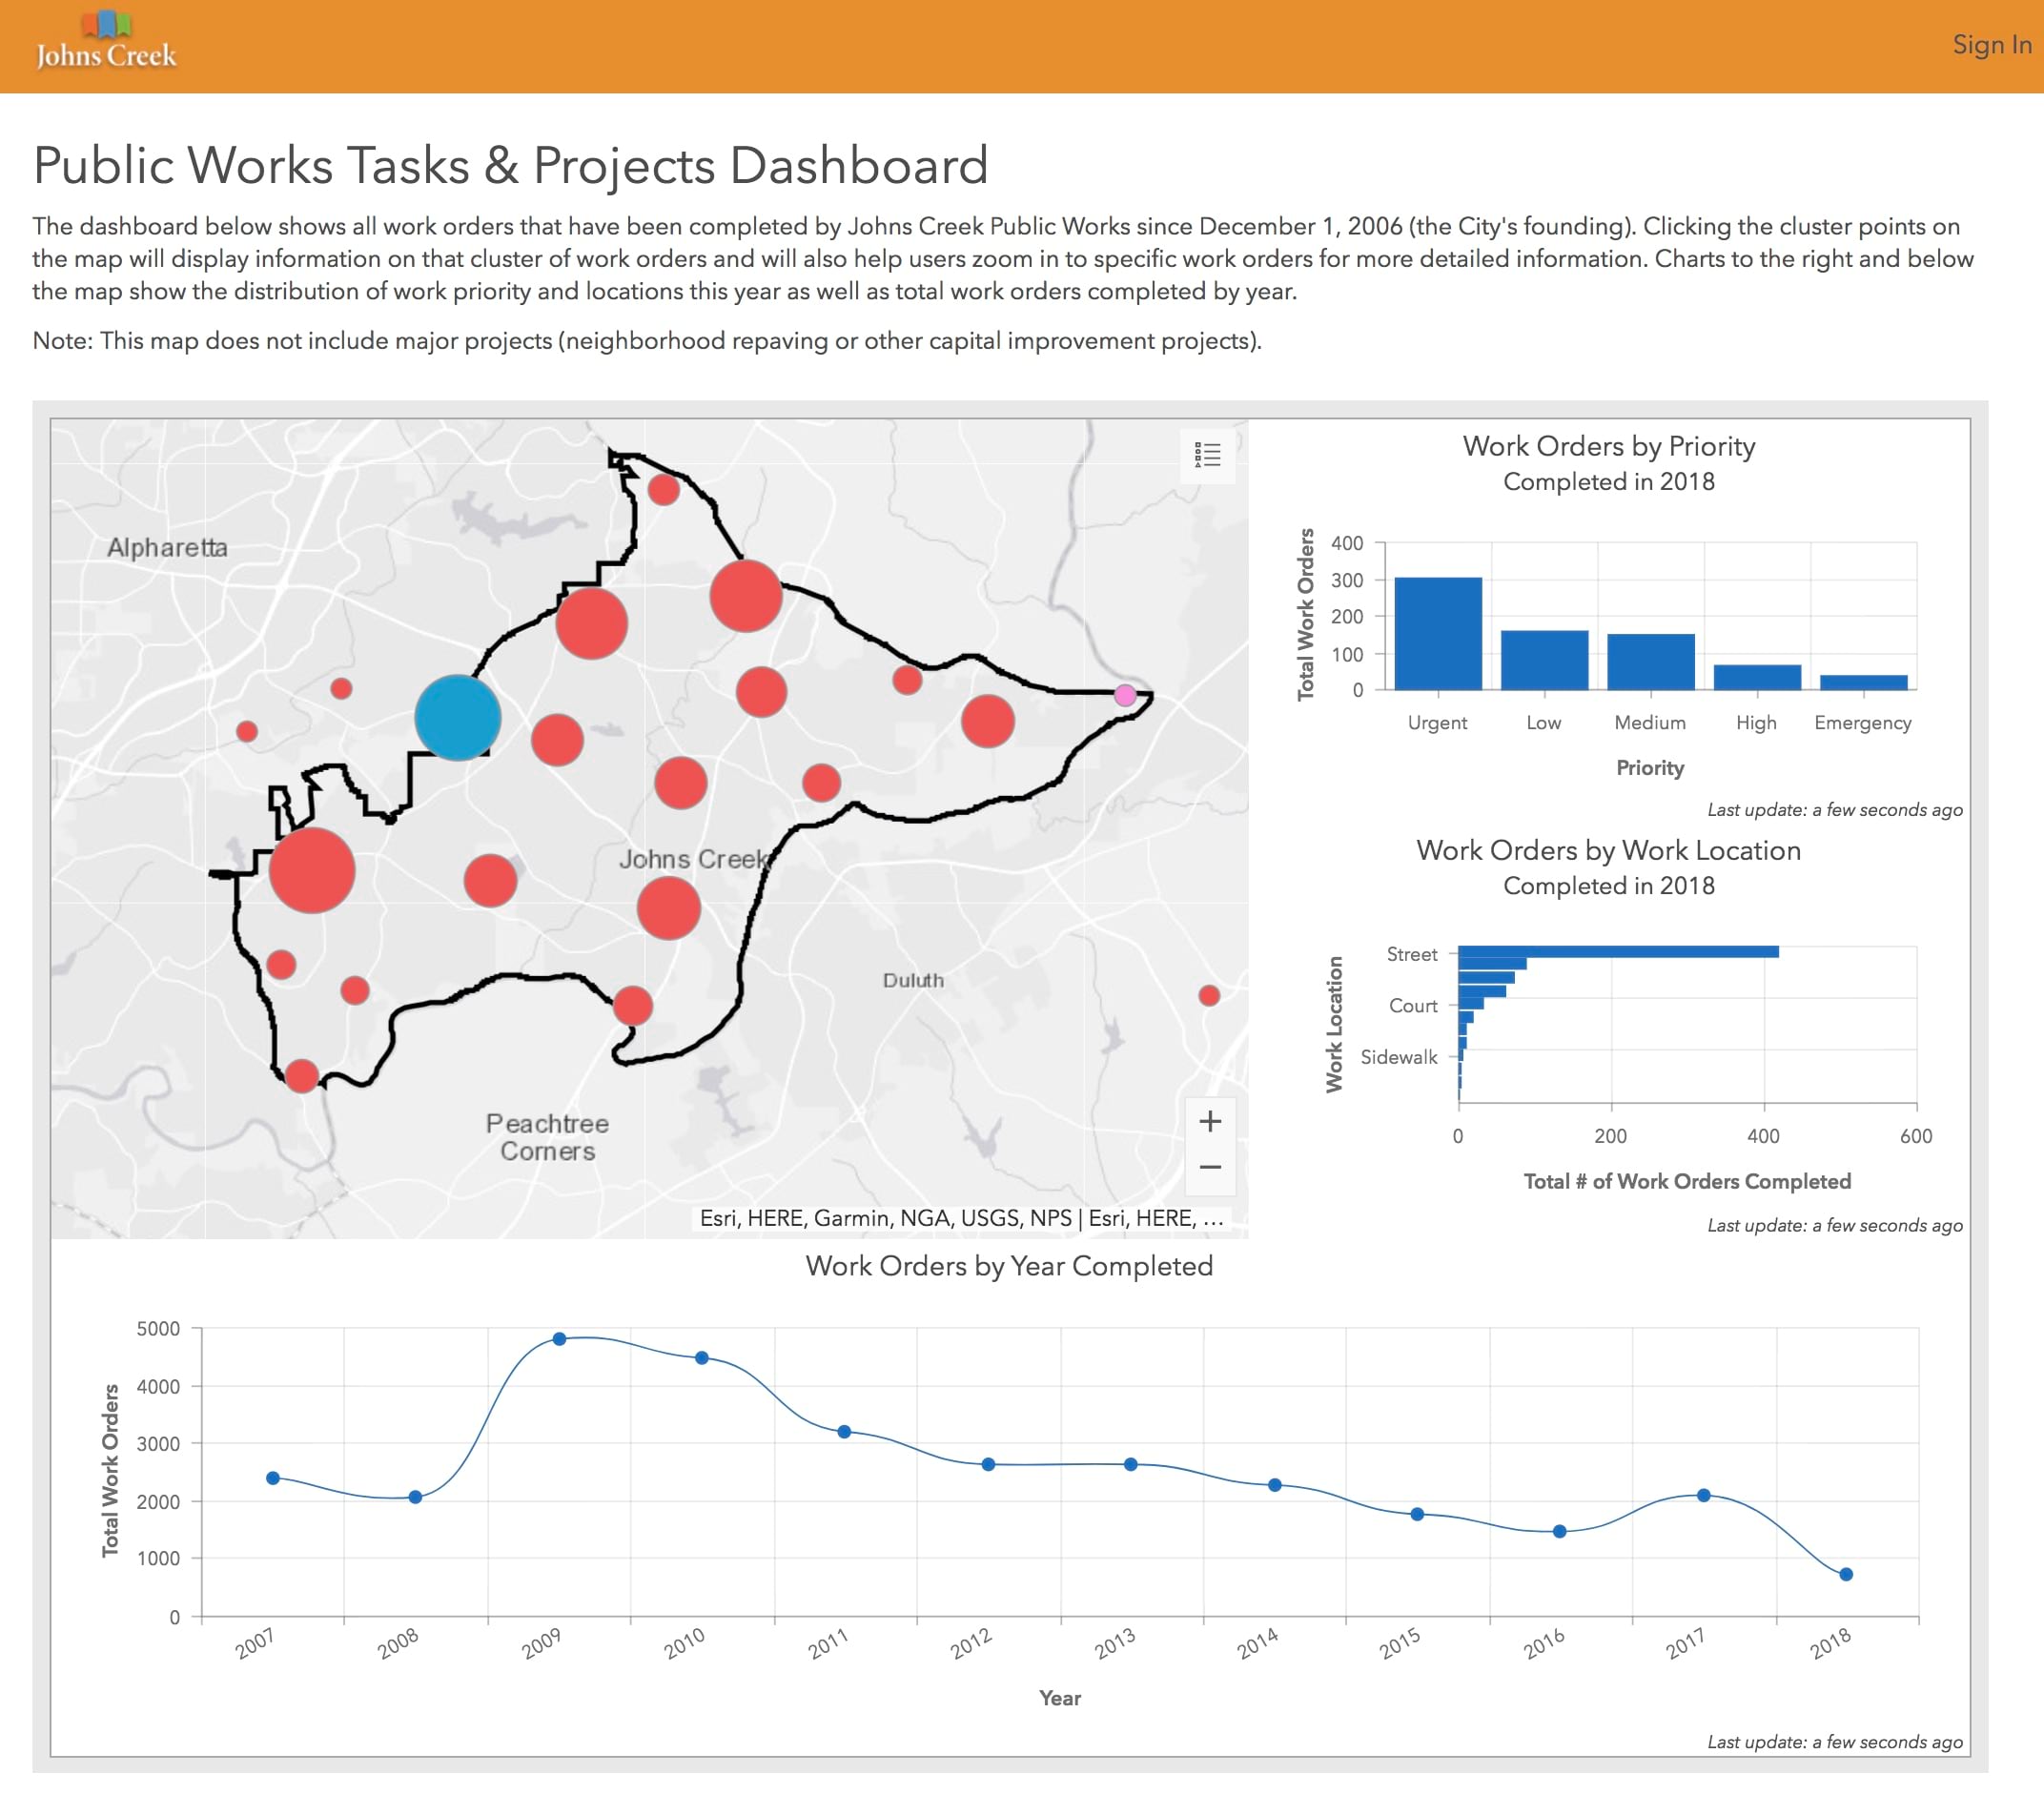
Charts and summary statistics are a great way to communicate your open data quickly and clearly, adding value and depth to your sites and Initiatives. The chart card is simple to configure. Just link to a dataset, select the type of chart you’d like to use and identify the appropriate attribute values. Recent updates to the chart card include a new scatterplot chart, a new line chart, and sort options for pie and bar charts.
Initiatives can also contain an Operations Dashboard app, a live dashboard that shows real-time changes to your site’s and Initiative’s data. With this added ability, you can link to multiple dashboards to help users quickly access and understand reports and infographics from across groups or departments within your organization. John’s Creek’s DataHub, for example, includes dashboards from a range of different departments, from fire and police to planning and public works.
New Search Capabilities
New search capabilities in beta have streamlined searching for data. A single search will now return more results including a larger variety of content types, like 3D web scenes, as well as matches for sites, initiatives, and events. Indexing improvements also make it easier for you to know when and the type of data that were updated within your Hub. Any changes you or a member of your organization make will update automatically, and you can now hover over the date in your search results to see what was changed. To experience these improvements, you will need administrator access to enable these new beta search capabilities.

Enhanced Mobile Experience, Accessibility, and Languages
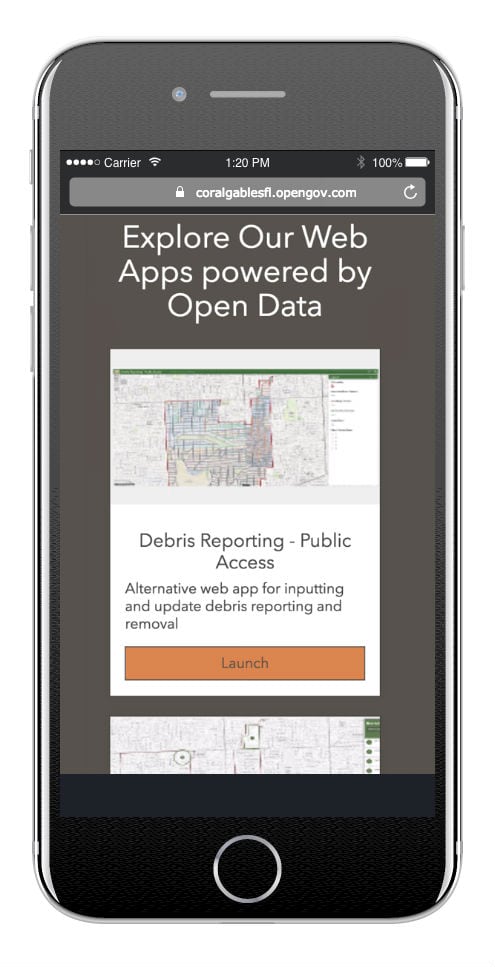
Configuring apps for mobile use is an important goal to broaden Hub’s accessibility. That’s why you can now launch your Hub’s apps in mobile view. The mobile view of apps contains a responsive grid and is easier to navigate with a keyboard, making for greater web accessibility.
Hub continues to support multiple languages; in addition to the existing 32 supported languages, Hub now supports Bosnian, Indonesian, and Slovenian.
Connect and Get Started with ArcGIS Hub
ArcGIS Hub’s toolset of configurable apps and solutions empowers your open data to create a communicative and connective platform that’s ready to engage you with your community on what matters most. To learn more, catch up on how communities around the world are using Hub, and take the Hub Readiness Test to see how your community can get started. As always, feel free to connect with us about your work with Hub through GeoNet, and follow us on Twitter to stay updated on what’s new with Hub.


Commenting is not enabled for this article.