Pop-ups are a powerful way to display data from within your map as an easy-to-read experience for your map reader. But did you know you can also bring in data that isn’t in your map? Your map reader can have information not only from your data layer, but also pulled in from other layers that are important or related to your topic. And even better, imagine having information from other data layers without even having those layers in the map!
For example, the map below provides population and housing characteristics from this Census American Community Survey (ACS) layer, and is symbolized to show median household income. The pop-up tells us information about income and a few other attributes included in this layer like median age and total population:
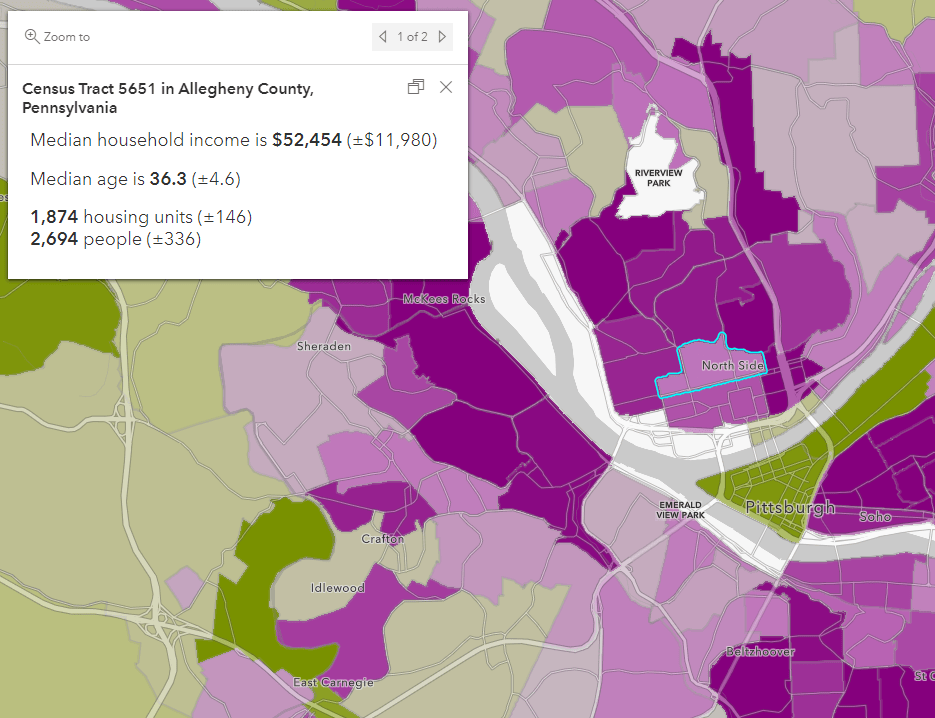
Pop-ups are a great way to showcase attributes from my data, but the map audience may also need additional contextual information about the area to help them make logistical decisions. For example, policymakers may want to better understand environmental factors or local services such as hospitals.
ArcGIS Living Atlas of the World contains a wealth of hosted data layers that can help add context to your pop-ups. For example, there are layers that update regularly with up-to-date data called live feeds, which cover real-time topics like wildfires, flooding, and other weather occurrences. Living Atlas also contains regularly updated OpenStreetMap data layers from around the world which help us better understand local services like parking lots, restaurants, medical facilities, and more. There are also recent American Community Survey (ACS) figures from the U.S. Census Bureau, updated annually, which cover a wide range of topics like income, race, education, housing, and more. Ultimately, you can access information from hosted feature layers in Living Atlas and bring that information directly into your existing pop-ups.
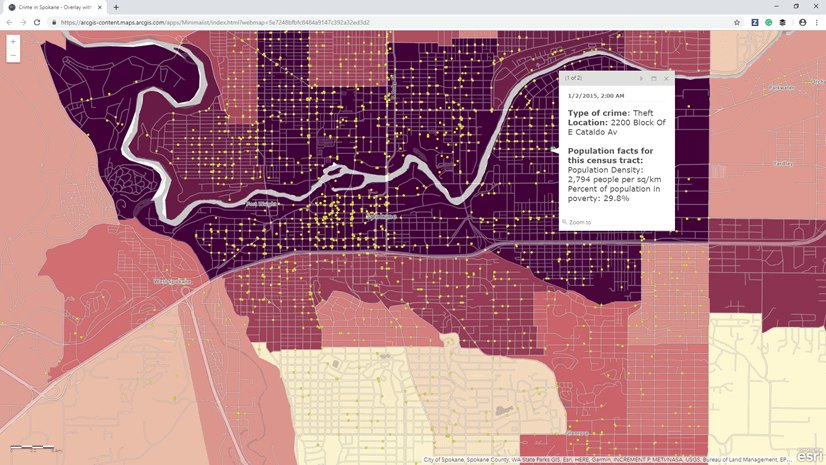
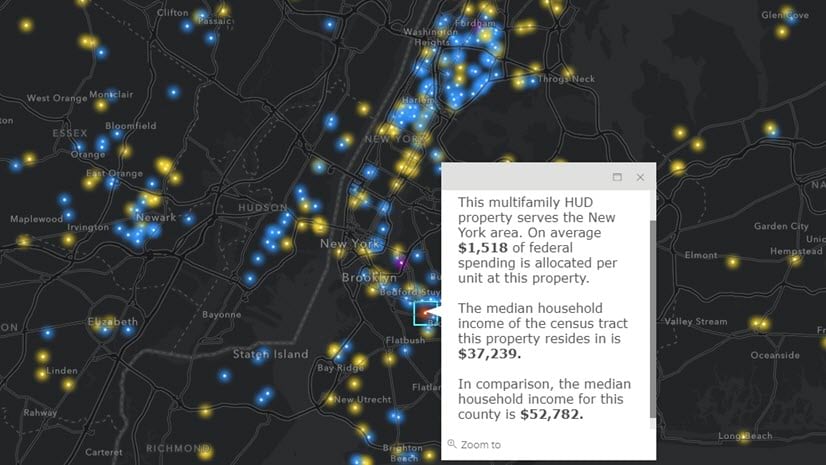
Let’s compare the pop-up we saw earlier with the version below, which pulls information from multiple ArcGIS Living Atlas layers. This technique adds context without cluttering the map itself, allowing the focus to remain on the main topic of the map (in this case, median household income).
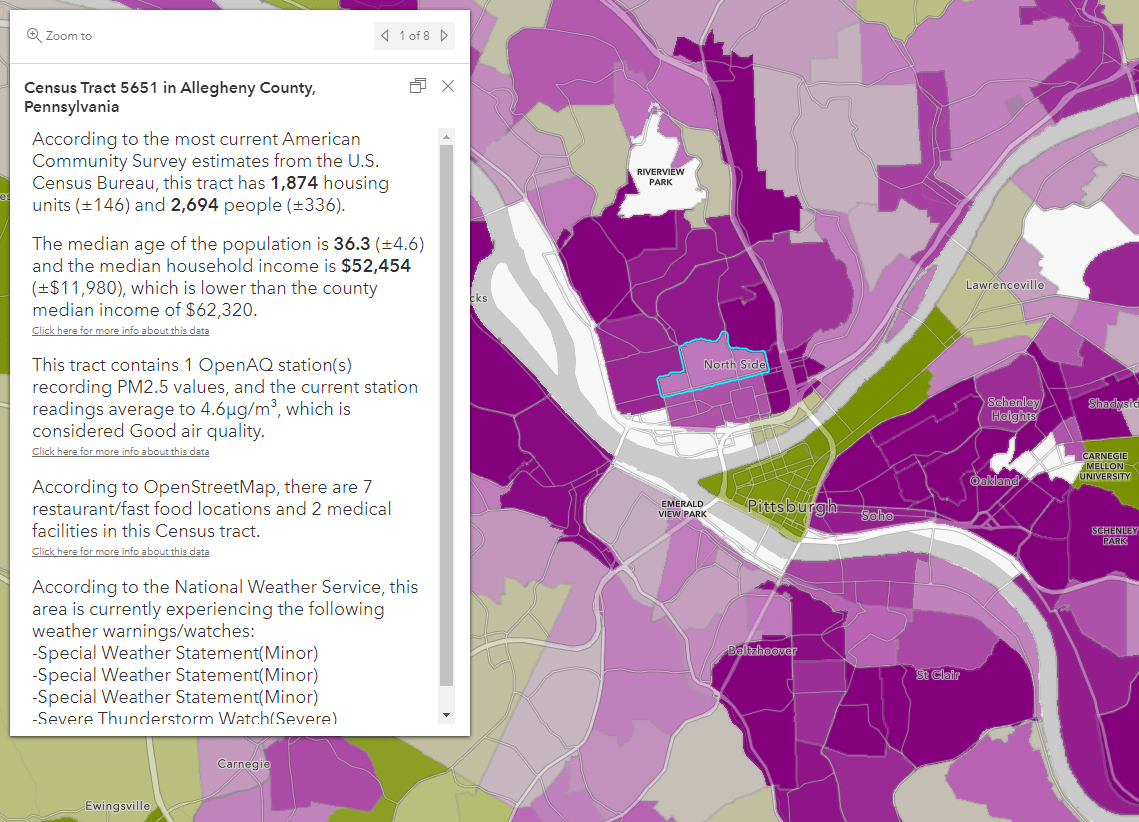
In this version of the pop-up, the map reader can learn more about each Census tract than they could with just the original layer. There’s now live information from the National Weather Service, OpenAQ, and OpenStreetMap brought into the pop-up on-the fly. But instead of a confusing mess of layers on the map, the key information is shared using easy-to-read sentences in the pop-up.
Why use this method? Not only can you bring in additional information into your pop-ups like the example above, but you don’t even need to add the data layers into your map. Using the workflow below, you can bring Living Atlas statistics into your pop-up without cluttering up the map visual, while still accessing the valuable information.
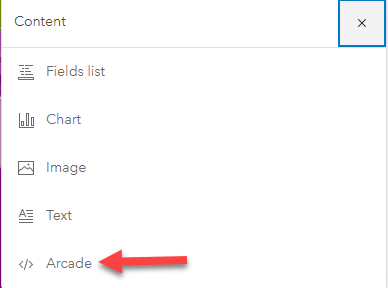
Now, let’s go through the overall workflow to build a similar pop-up. The key components to creating a pop-up like this are:
- Find a hosted layer from Living Atlas
- Pull in the data you need using Arcade FeatureSets
- Build an easy-to-read pop-up
Find a hosted layer from Living Atlas
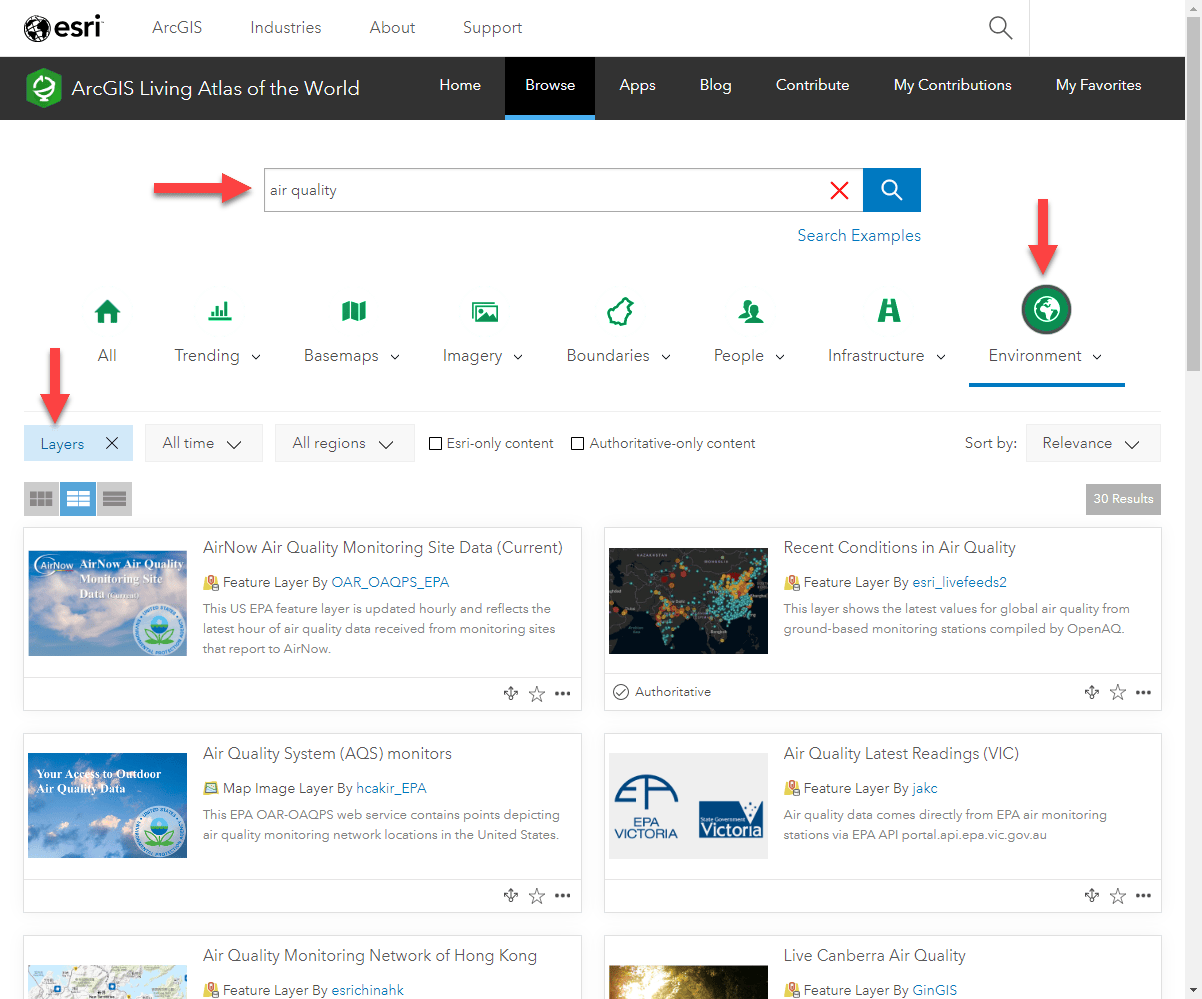
To find Living Atlas layers, browse the Living Atlas site, or find Living Atlas within the Add Data experience in ArcGIS Pro or ArcGIS Online (This tutorial will show the workflow starting with the Living Atlas site). In some cases, you may need to filter the content type to only include layers. Use a search phrase or choose from the Living Atlas categories and subcategories to narrow your search.
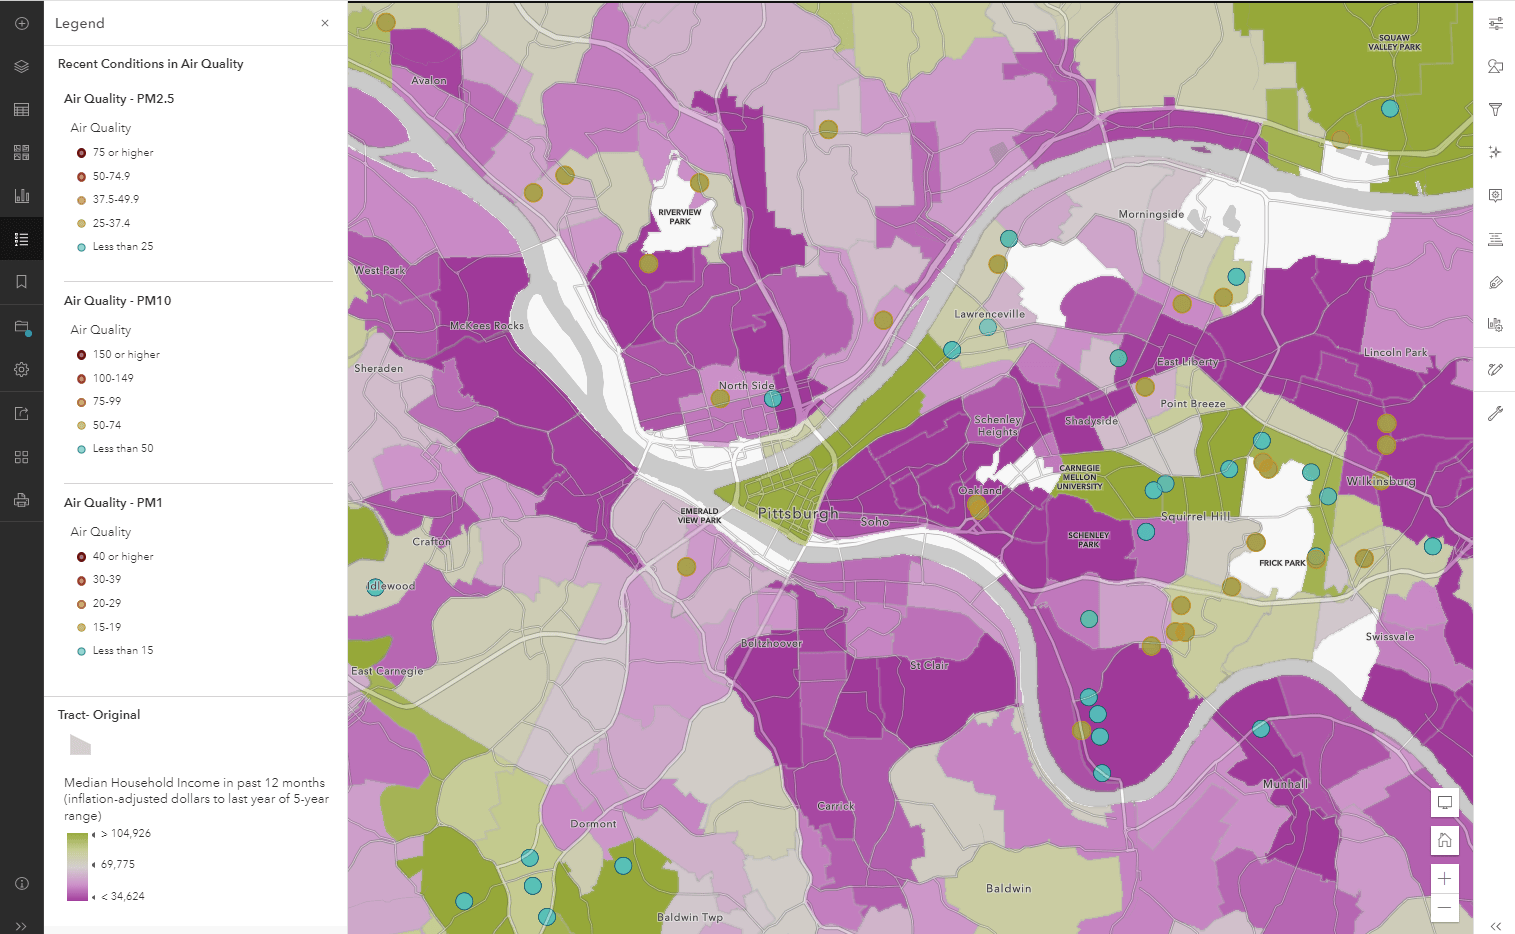
For example, below I am searching for layers about air quality within the Environment category. The layer called “Recent Conditions in Air Quality” looks like something that would help policymakers in my area better understand if the population experiences good or bad air quality in relation to high or low incomes.
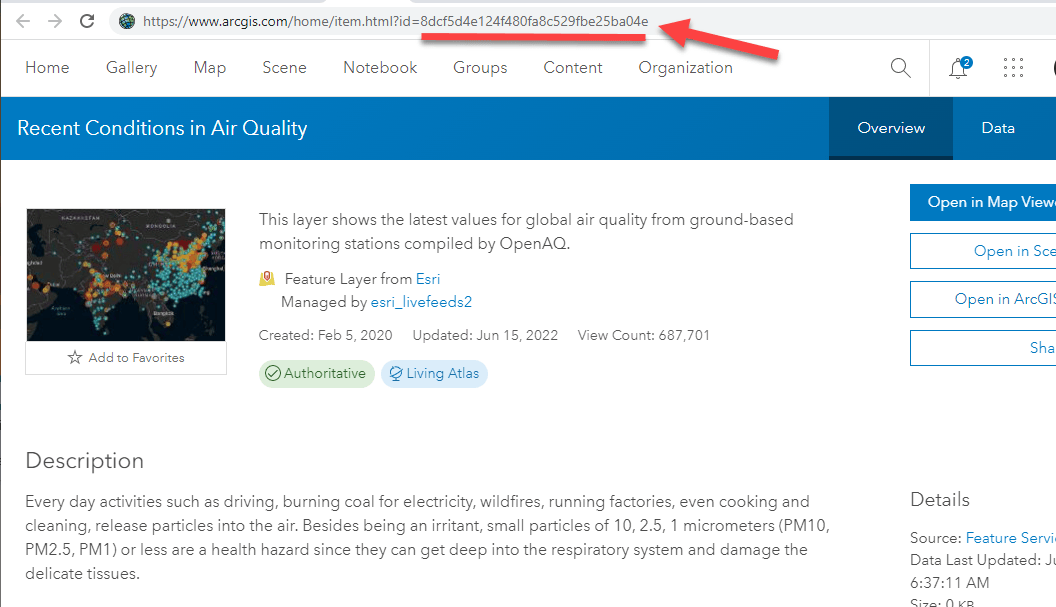
Add the layer to your map and open the item page/metadata to familiarize yourself with the layer. A few things you’ll want to look for:
- The item ID (learn how to find this)
- The sublayers and their data type (are these points, lines, or polygons?)
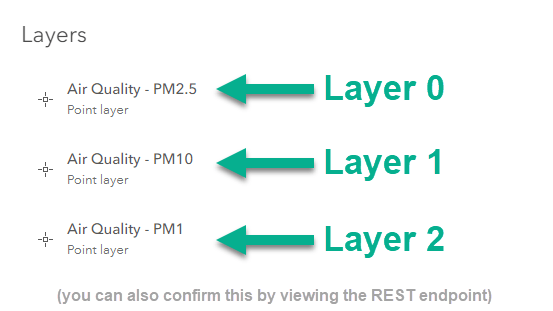
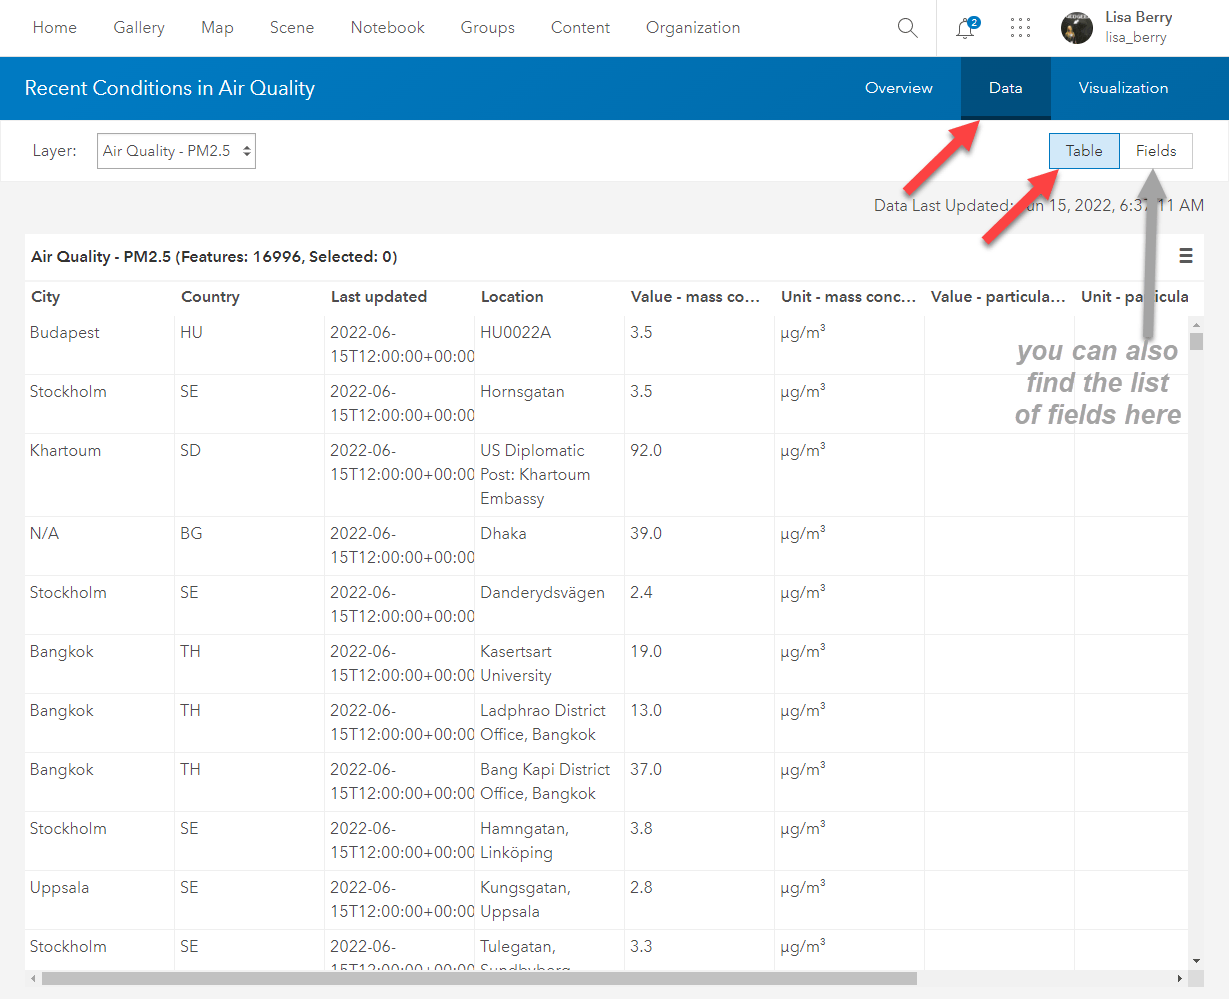
- The fields within the table (are there any in particular you want to use in your pop-up?)
Once you have an understanding of the data, ask yourself which pieces of information are important to your map, and consider how those overlay with your map’s features. This will help in the next step.
In this case, I can see the air quality stations are point features that may (or may not) fall within my tracts. This means that some tracts will have no intersecting features. This will be considered later when working with the Arcade.
Note: this Arcade pop-up workflow will not work on tiled or imagery layers. Look for Map Image or Feature Layer item types. You can still have imagery/tiled layers in your map, you just won’t be able to extract data using the methods listed below.
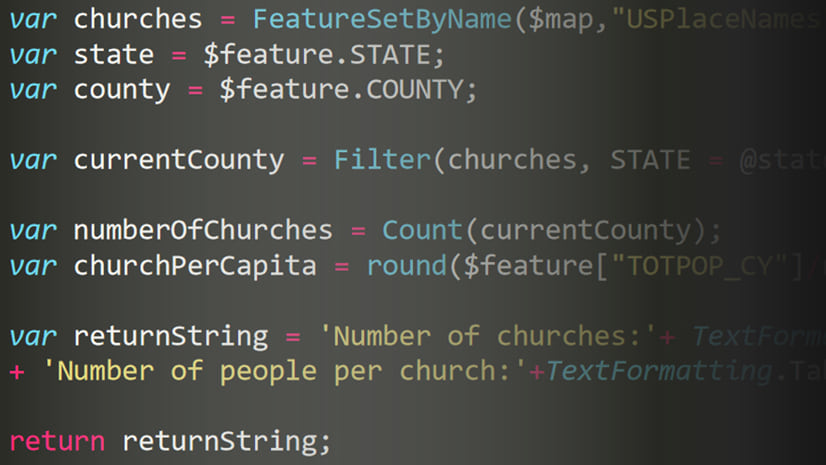
Pull in information using Arcade FeatureSets
There are many ways to bring the data into your map, but a lot will depend on your data type and how it intersects with the layers you are interested in accessing.
For the air quality example, we can call to the data using the FeatueSetByPortalItem() function and see if the tracts contain any of those air quality stations using the Contains() function (we could in theory also use the Within() function).
Using the item ID and layer ID we grabbed earlier, the data from that layer can be accessed with two lines of code in this case:
var FS = FeatureSetByPortalItem(Portal('https://www.arcgis.com/'), "8dcf5d4e124f480fa8c529fbe25ba04e", 0)
var inside = Contains($feature,FS)
The first line simply references the Living Atlas layer by its item ID and layer ID. The second line does an on-the-fly spatial comparison to see if there’s an air quality station inside of the tracts. These are assigned as variables (var inside and var FS) so that they can be referenced easily in the next part.
Note that $feature is your current feature. In our case, a Census tract. We are trying to see if the air quality stations (FS) fall within our tract ($feature). The variable called inside will return another FeatureSet containing any air quality stations within the tract. We will access that information in the next part of the blog.
Below are a few blogs and tutorials based on some questions you may have as you use Arcade to pull in the data to your pop-up:
- Do I need a spatial intersection or a data filter?
- Can I see a short example?
- Can I bring in data from a layer without adding it to my map? (the answer is YES!)
- I need more help with this, are there more in-depth tutorials? (the answer is also YES!)
- I need Arcade help, is there an FAQ? (One more time, YES!)
Tips:
- Use return statements and the “Test” button to see what your expression is returning. If it is trying to return a FeatureSet, make sure to use the First() function, Sum() function, a Count() function, a for loop, or some other method to access the information you need from the resulting FeatureSet. This will all depend on how your data intersects. See the examples in the final web map for inspiration.
- If you end up with one intersecting record and you want to access a field from that feature, use dot notation to access the field. For example, if your FeatureSet is a variable called variableName, you’d use variableName.FieldName to access a field called FieldName.
- Consider and explore the various geometry functions to perform your intersection. For example: Intersects(), Within(), Contains(), Centroid()
Build an easy-to-read pop-up
Once your Arcade expression returns the data you need from the Living Atlas layer, now it is important to turn that into a readable and informative piece of information. Try not to just dump the number or attribute into your pop-up, but rather turn it into something contextual like you saw in the pop-up example above.
Some key ideas when doing this:
- Handle areas where nothing matches. There are many techniques for handling null or empty values.
- Turn numbers into an understandable phrase. For example, the pop-up above provides the air quality value (in µg/m³), but also translates this into something more readable (good, moderate, hazardous, etc). See how to turn numeric values into categories.
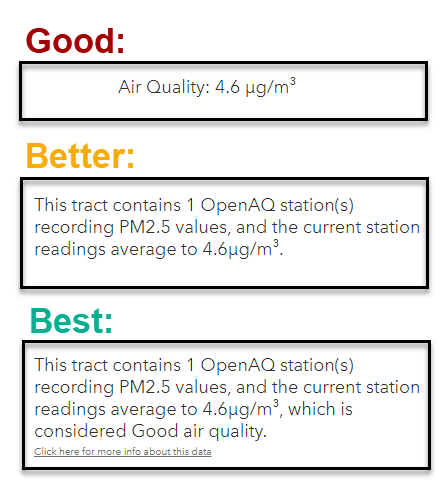
For our example, the “Best” option above would be code that looks like this:
// First, call to the Living Atlas layer
var FS = FeatureSetByPortalItem(Portal('https://www.arcgis.com/'), "8dcf5d4e124f480fa8c529fbe25ba04e", 0)
// Determine which stations fall within the current tract
var inside = Contains($feature,FS)
// Count how many stations fall within the tract
var countOfStations = Count(inside)
// Create variables to help you determine the average
var avgTotal = 0
var cnt = 0
// If the first feature that falls within the tract is not null, loop through the features to average them
if(First(inside) != null){
// Loop through the features to determine an average
for(var x in inside){
avgTotal += x.value
cnt += 1
}
var avg = avgTotal/cnt
// Turn the average into a readable phrase based on WHO guidelines
var vals = When(avg <= 25, 'Good', avg <= 37.5, 'Moderate', avg <= 75, 'Hazardous', 'Extremely Hazardous'); // Build text for the pop-up using the variables created var txt = "This tract contains " + cnt + " OpenAQ station(s) recording PM2.5 values, and the current station readings average to " + Round(avg,2) + "µg/m³, which is considered " + vals + " air quality." return txt } // If there are no features within the tract, return a readable phrase else{ return "There are no OpenAQ air quality stations in this tract to record live PM2.5 readings." }
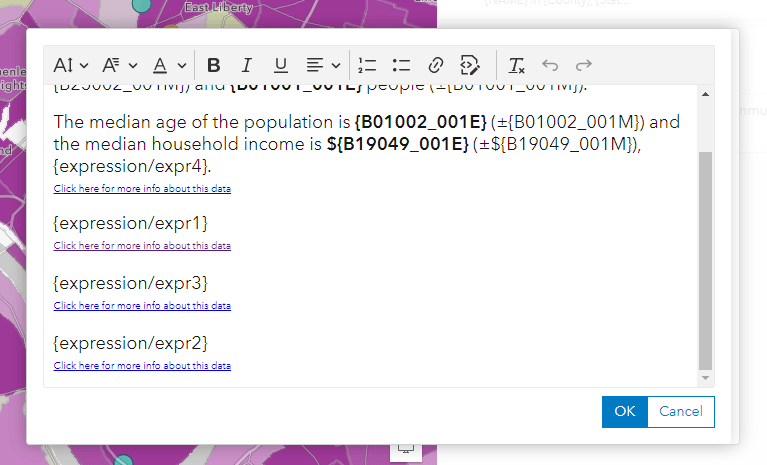
The expression above brings in the air quality data. The other topics shown within the pop-up are accessed using similar techniques, each within their own expression:
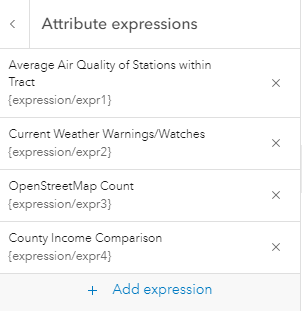
These were then added into the pop-up text to create the longer pop-up you saw at the beginning. Notice how there are references to each source of data:
Best Practice: If using a different data source than the layer being used in your map, consider adding a link to the item page or other piece of information to provide proper credit/attribution.
Final Map
Use the examples within this map to inspire different methods. Check out the layer called “Tract – Arcade Pop-up” and view the pop-up settings and Attribute expressions to see which techniques were used. There are comments within the expressions that tell you what each line does.
Note that the data layers used in the pop-up are in the map, but they don’t need to be there. They could easily be removed from the map since we used a FeatureSetByPortalItem() call instead of a traditional FeatureSet, which requires the layer to be in the map. Since we used the item ID, the layer doesn’t need to be in the map. The layers are there for you to see how they overlap with the original data, but try removing them and see how the pop-up still works!
Want to go further?
Make the information really stand out in your pop-up using an Arcade pop-up Element. Instead of using a text element and multiple expressions, combine all of your expressions into one, and use HTML to add things like bolding, images, and more.
For example, here is the same map from earlier but using an Arcade pop-up element instead of a traditional text element:

Notice how much more detail there is in this version. This example builds each result into an HTML table object so that an image appears next to the associated text. Using a table also allows us to specify additional spacing so that the image and text aren’t right next to each other.
For this method, you can build the entire pop-up into a single Arcade expression, include HTML formatting, and reduce any redundant calls within your expression. Check out the expression within this map on the Tract – Arcade + HTML Pop-up Element layer to see how this pop-up was created. Ultimately, it takes the expressions written from the pop-up shown earlier and combines them into one expression. It also uses HTML to format the results in easy-to-read ways.
Considerations:
- Use HTML to build a table
- When inserting an image, consider the dimensions and specify those in your HTML
- If your pop-up is slow, only call to the fields you need within the FeatureSet
- Spatial intersections with large datasets can mean slower pop-ups. Large datasets may need different processing.
Note: Arcade pop-up elements must be viewed with Map Viewer or 4x Web Applications. They will not work in Map Viewer Classic or 3x apps.
Concluding Thoughts
The methods and techniques shown in this blog can help advance the maps we are already making. Add Living Atlas context to your new or existing maps, and choose a method that works best for your projects. No matter how you bring the Living Atlas data values into your map, remember to do more than just dump numbers into your pop-up. Explain the data in a meaningful way, credit the source, and make the information easy to read so that your map reader doesn’t have to do all the work.
Overall, these techniques allow us to access authoritative and up-to-date information within our maps like never before. Since Arcade executes on-the-fly each time your map is opened, the values will always reflect the most current figures from the data sources. This truly reflects the power of today’s web GIS, empowered by ArcGIS Online, ArcGIS Arcade, and ArcGIS Living Atlas.
More Resources:
Blog: Introducing Arcade Pop-up Elements
Blog: Introducing Arcade Pop-up Elements (Part 2)
Blog: Pump up your pop-ups with Arcade + Living Atlas
Blog: Use FeatureSetbyPortalItem to pulling in data from Living Atlas layers

Article Discussion: