The Quinquennial Census
The latest 2022 release of the USDA Census of Agriculture is now available in the Living Atlas! Conducted every 5 years (those ending in -2 and -7), it provides a richly-detailed, county-level look at agricultural production, labor, equipment, and spending. Producers from across the country are confidentially counted – from small plots generating just $1000/year in income, to mega-farms thousands of acres in size – to enumerate their operations.

First conducted in 1820 as part of the decennial U.S. Census, it became its own schedule in 1840, then switched to a quinquennial cycle in 1920. Why is the Census of Agriculture so old and important? According to the USDA, it provides the only source of uniform, comprehensive, and impartial agriculture data for every state and territory in the nation. In addition to that, its data are used by producers to make more informed decisions about their own operations, and by federal, state and local agencies for shaping farm policies and programs.
New Layers for 2022
While the full census compiles thousands of agricultural attributes, the 2022 Living Atlas collection contains 23 layer views of the most requested commodities, updating the previous 2017 Census of Agriculture release with 8 new collections (bold = new for 2022):

Putting the Animal Totals and Crop Totals on a chart provides a quick at-a-glance ranking of agricultural activities in 2022 by state:

Among the new collections in the 2022 release are data related to chicken inventories and sales – a commodity that overtook beef in the early 1990s to gain the title of America’s Most Consumed Meat. Before it reaches its final nugget form, broiler chicken production largely takes place at operations scattered throughout the South. (Open the full-screen map here.)
2022 Chicken (Broiler) Sales by Head
Interested in egg-laying chicken or rooster breakdowns? Those are in there, too. Each layer view contains multiple variables related to that commodity which can be used for visualization and analysis.
Rice
While some commodities like grain or cattle can be found in most U.S. counties, the map of rice production is more environmentally constrained: rice is a semi-aquatic plant that requires access to fresh water for flood irrigation, low elevation, a warm climate, and poorly-draining heavy clay and silt loam soil types. As a result, the Mississippi River Valley and the Sacramento Valley of central California have emerged as the two major hubs of rice production in the country. (Open the full-screen map here.)
In contrast to the Mississippi River Valley, where long-grain rice is dominant, short- and medium-grained Japonica rice varieties comprise 95% of the harvest in California. To better illustrate the factors that make the Sacramento Valley suitable for rice production, we can bring in some additional Living Atlas layers to try to explain the locations of rice fields there:
- USDA Soil Survey Geographic Database (SSURGO) Drainage Classes
- USDA USA Cropland time-series (CA rice crops only)
- USGS National Hydrography Plus Dataset Plus High Resolution stream lines
SSURGO Soil Drainage and Rice Suitability
The left side of the swipe map shows the soil drainage classes from SSURGO, clipped to 2022 Ag Census rice-producing counties in California. On the right side, rice fields from the USA Cropland layer were used to mask-in the intersecting SSURGO soil types, using the Destination In layer blending effect. (Open the full-screen map here.)
You can clearly see the preference for growing rice on poorly-draining soils (shades of darker blue) on the flanks of Sutter Buttes in the central valley, combined with the network of canals and aqueducts that are used for flood-irrigation.
Exploring Change: 2017-2022
As a second release of the Ag Census joins the Living Atlas, you can now compare patterns in agricultural production and sales and their trajectories over time and space – albeit over a short 5-year window. This swipe-map comparison of Corn Sales between 2017 and 2022 shows a consistent distribution of the counties and states with the most sales, but an overall increase in production between census snapshots.
2017 vs. 2022 Corn Sales
In some census years, drought, flooding events, or other natural disasters can be responsible for abrupt, local changes in production, which typically subside in the following years. Globally, military conflicts can have the same effect. (Open the full-screen map here.)
In longer timeframes, climate change is exposing the vulnerability of crops to changes in temperature and access to water for irrigation. The animation below comes from the 2022 blog post Using Living Atlas content to study current and future threats to global food security and demonstrates the possible effects of climate change on one of the principal food grains grown in the United States: wheat.

The comparison of present-day wheat suitability to 2050 shows a dramatic shift northward into Canada towards cooler, more amenable climates.
Using the Ag Census, can we recreate the same northward migration trend in wheat between 2017 and 2022? One way to investigate this is to calculate the weighted Mean Center of production (using the Bushels Harvested attribute) in 2017 and 2022: for the country, and each state. When you connect each mean center pair, the resulting line will show the distance and direction of crop movement between each census. (Open the full-screen map here.)
The map above shows positive (green) vs. negative (brown) changes in wheat production between 2017 and 2022. Overlain is an arrow showing the mean center of production for the nation, which has moved 48.4 miles north-northeast and is currently at the northern border of Nebraska. Zooming in a step shows state movement vectors, where more varied local trends average out to the national trajectory. Will South Dakota claim the national center of production in 2027? We’ll find out.
Growing the collection
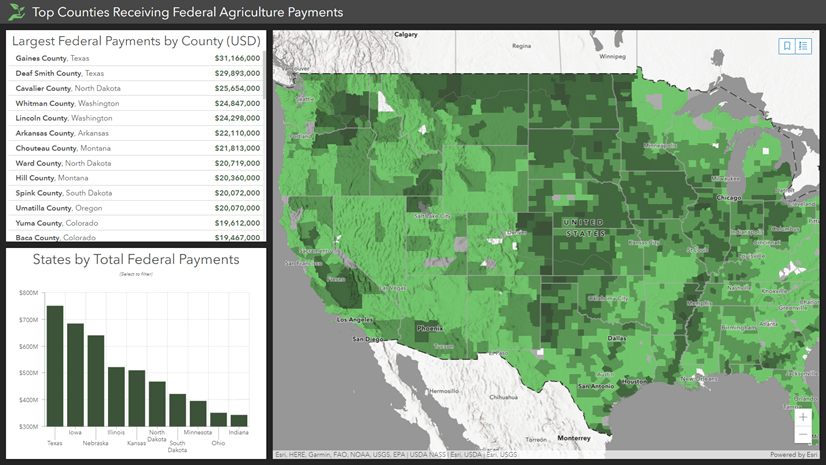
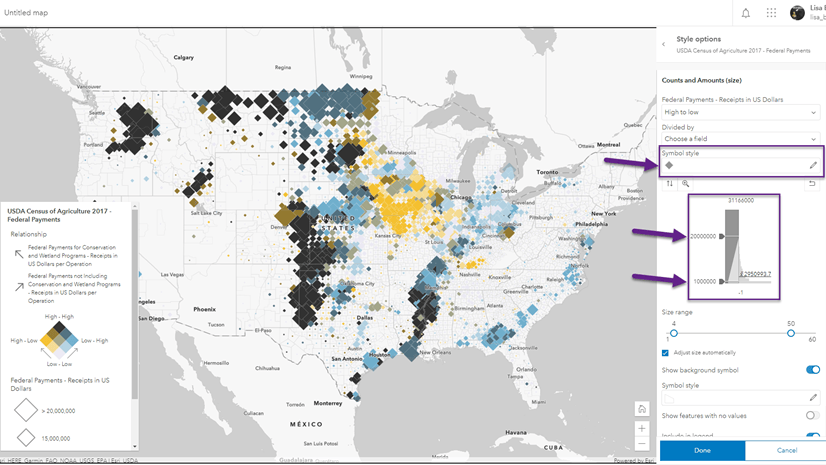
The full collection of 2022 Census of Agriculture layers can found HERE in the Living Atlas. In addition to the 23 layer views in the collection, there is a handy All view, so that you can easily combine commodities with other attributes, like paid/unpaid/contract labor, equipment totals, government payments, or 2022 county population.
Are there other Ag Census variables or attributes that you would like to see that didn’t make this 2022 update? Please let us know.
Lastly, if you’re an agricultural operator of any size and have not yet participated in the Ag Census, sign up and be counted for 2027!


Article Discussion: