1,109,000,000,000
It’s a big number. That’s the estimated contribution of agriculture, food and related industries to the U.S. GDP in 2019. It’s so large that there is a census undertaken every 5 years by the U.S. Dept of Agriculture to properly account for its magnitude and market penetration. Keep in mind, that’s twice as frequent as the census of population.
The Census of Agriculture is also incredibly detailed, with hundreds of statistics for states and counties, including information about production, sales, and demographics, from 2 million farms that cover almost 1 billion acres.
The last census was undertaken in 2017, and a portion of that information is now available in ArcGIS Living Atlas of the World. You can explore the nine layers available in this content group for major agriculture products, livestock, and equipment, along with some related layers, such as the USDA’s CropScape and Soil Survey Geographic Database.
Exploring the Census
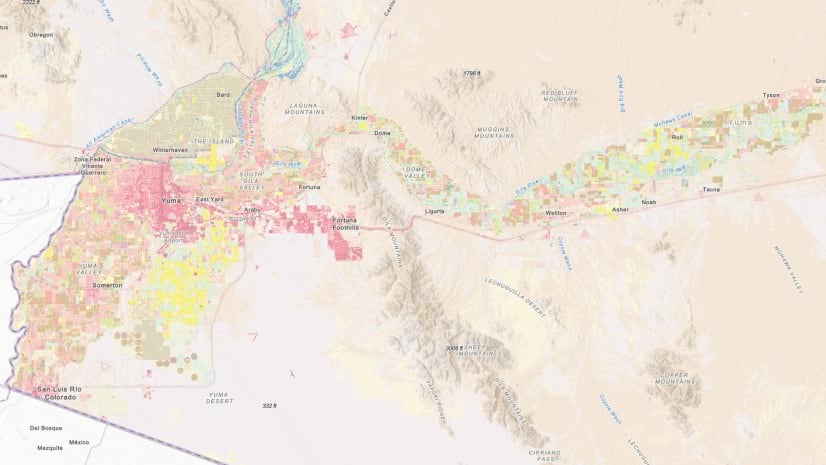
With so much data, there’s amazing amounts of information to be gleaned. For instance, here we see a swipe map plotting the sale of equipment by county (left) compared to the sales normalized by the number of operators (right).
Interesting patterns begin to emerge. For instance, the high sales values of the corn belt are diminished somewhat when considering how much is spent per farm. A quick look at the USA Cropland layer shows how much more diverse agriculture is in the southern Mississippi Valley – and greater diversity in farming requires more specialized equipment.

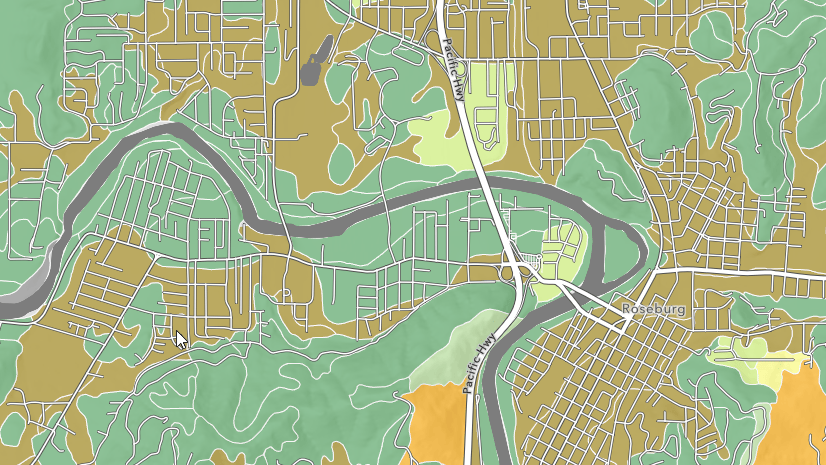
The real power of web GIS is being able to pull information from different sources and combine them into synthesized products. In this map we are showing FEMA’s National Risk Index analysis of expected annual loss to agriculture due to natural disaster and severe weather.
By using FeatureSets, we are able to pull statistics from the Census of Agriculture into the pop-up to provide more context – if there is 54% loss, what is the breakdown within the county? Naturally, some products will be more or less susceptible to loss.

Help Improve This Resource
This initial release of the Census for Agriculture in Living Atlas provides a small offering of this incredibly rich dataset. We are interested in hearing from you about which specific attributes or more general types of information that would help improve your GIS mapping and analysis.
The next Census of Agriculture will take place in 2022 and the information in Living Atlas will be updated accordingly. Sign up to be counted.

Article Discussion: