
Is this part of Paris a built-up area? Or is it trees? Well, it depends on your point of view.
Different points of view are the same for methods that produce land cover. One collection method may be trained to see pixels of a place as a built-up area, while another method may classify this same place as trees.
Two recent additions to ArcGIS Living Atlas of the World give you the option to look at the landscape both ways. Last week Esri in partnership with Microsoft and Impact Observatory released the Sentinel-2 10-Meter Land Use/Land Cover. For the first time we have an incredible 10 meter resolution time series map of the Earth’s land surface from 2017-2021. It was processed using artificial intelligence (AI) land classification models that were enhanced by billions of human-labeled image pixels. Its uniqueness and power as a time series means you can literally watch the landscape change as if you are watching a cell animation, and then you can use it for analysis. Such incredible GIS times these are!
If that land cover layer weren’t exciting enough, this week the European Space Agency’s (ESA) 10 meter WorldCover was added to the Living Atlas collection. This layer is a baseline land cover map of the world from the WorldCover Consortium. The map classifies the world using remote sensing into 11 cover classes for 2020. By using remote sensing, it sees the world’s land cover more at face value than an input to be interpreted by artificial intelligence. The layer even includes a special class for mangroves. Mangrove watchers should take note since this is a special and significant dataset for this purpose.

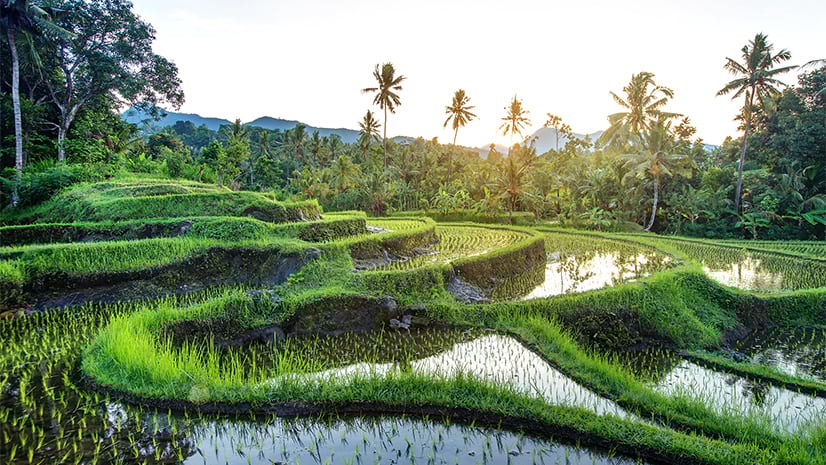
Striking and interesting displays such as these are found all over the world. While designing the palette for this layer we wanted the the colors to be in complete sync with one another. We used green as our foundation hue – tree cover, shrubland, herbaceous wetland, mangroves, moss and lichen, and even the color for permanent water bodies falls right on the border between green and blue. Grasslands and bare or sparse vegetation got an intuitive tan/yellow as did light gray for snow and ice. The human landscape, of course, got represented with more intense colors to evoke their artificial brightness. There is also overall harmony with the Sentinel-2 10-Meter Land Use Land Cover Time Series as it uses similar colors as well.
Now, let’s get back to our original question about trees in built-up areas and focus on the city of Paris as an example. What can these two different land cover layers reveal about this city due to their different point of views? You see on the left, the Sentinel-2 10-Meter Land Use Land Cover Time Series layer has interpreted Paris’ street trees and parks as part of Paris’ urban area while on the right the remotely sensed European Space Agency WorldCover 2020 Land Cover layer identifies urban trees and parks without interpreting them any further.

When we compared the two for ourselves the question arose: Can these differences be used to estimate tree cover in cities? We could use the one on the left, the Sentinel-2 10-Meter Land Use Land Cover Time Series, to define the city limits; then we could use the one on the right, the new European Space Agency WorldCover 2020 Land Cover to analyze tree cover within those limits. Will it work?

Since these are both global land cover datasets, we decided to be ambitious and analyze the 25 biggest megacities around the world and compare them to each other. Which of the world’s megacities had the most tree cover? The answer may surprise you.
But first a bit about our method. We didn’t want to compare cities by their municipality or city limit. These are largely artificial boundaries that are not consistent country to country or even within US States. Americans are familiar with the concept of metropolitan areas which are largely counties grouped together by the US Census Bureau. What we were after was a concept similar to a metropolitan area, in order to define a kind of conurbation which is some type of urban area that is contiguous and functionally connected.

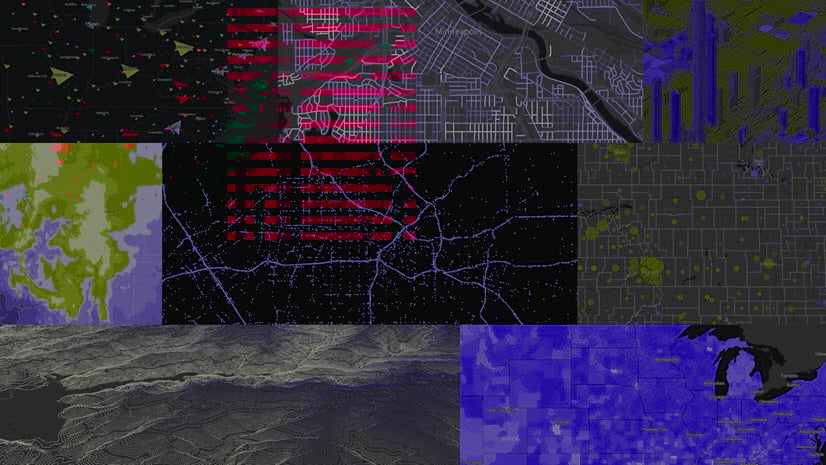
After a few trials, we decided the best fit was to use the Global Human Settlement – Urban Centres Database layer to define the name of each conurbation. Then we would use that layer city by city to select just the built-up land cover class polygons derived from the Sentinel-2 10-Meter Land Use Land Cover Time Series that intersected this layer. We totaled the population of each conurbation using the most recent year in the WorldPop layer in the Living Atlas of the World. We then used Extract by Mask with these urban area polygons to cut out a piece of the ESA WorldCover 2020 Land Cover to size. The cut pieces for each conurbation contain a table with the area of each land cover class which we could use for comparison. We broke the workflow down into this graphic.

The following is a summary of what we found out about the tree cover in the 25 most populous megacities.

Naturally as geographers we had to map this out. We chose the top five with the most population and the top five with the most trees. Their spatial distributions fascinated us, and the results were quite surprising. We wanted to know more about these places and searched out photographs to partner with our maps. They help tie us to a place, so for just a moment we can be there too.
These were the top five conurbations with the most population:
#1 Population


Guangzhou, Shenzhen, and the New Territories of Hong Kong in China are three separate places. However, the Sentinel-2 10m Land Use/Land Cover Timeseries sees this area as one uninterrupted urban area from Guangzhou to Hong Kong’s New Territories. If it were one big city instead of three it would be the largest in the world with over 55 million people by our count, using WorldPop. Disconnected parts of Hong Kong including the Islands have a lot more people, also more very wild and green spaces. But within the large contiguous urban area we found the tree cover to be about 16%.
#2 Population


Tokyo, situated on Kanto Plain, is surrounded by steep, forested slopes. It is one of the world’s largest built environments and has a few large green spaces and parks, as well as dense trees at shrines and the Imperial Palace. Ueno Park is Japan’s most popular city park. Yoyogi Park in Shibuya has become an area of subculture gathering and exchange.
#3 Population


Shanghai in China is the world’s busiest container port, located where the Yangtze River meets the sea. The Sentinel-2 10m Land Use/Land Cover Timeseries sees Shanghai and environs as one uninterrupted conurbation from Shanghai to Suzhou.
#4 Population


Jakarta is an immense urban area that is still growing. Jakarta’s port handles most of the country’s shipping traffic. It’s the seat of most of the country’s Forbes 2000 global businesses, and it’s also the seat of government. With seemingly everything in one big city, Indonesia has decided to move its capital to Nusantara, East Kalimantan to try to lighten the load.
#5 Population


Delhi in India’s north has a subtropical, almost semi-arid climate. There are some large open spaces in the city center, especially around the capital in New Delhi. The old part of the city is denser and less tree-covered. There are some notable areas with a lot of tree canopy, especially in the vicinity of IIT Delhi and Jawaharlal Nehru University.
Now let’s take a closer look at the five megacities with the most tree cover.
#1 Tree Cover


In the United States, New York City is not a place you think would contain a lot of trees, but in our comparison of the world’s megacities, the New York Metropolitan Area reveals a lot of area of tree coverage. The high number of trees accompanies the single-family detached suburban pattern which rings American cities, combined with its humid temperate climate. Dense tree coverage is especially present in suburban New Jersey, Connecticut, Long Island, and Westchester County, New York.
#2 Tree Cover


Kolkata in India has a lot of large open spaces. Its climate is hot and humid tropical wet and dry, which facilitates the growth of trees and forest. The Maidan, known as the “Lungs of Calcutta”, is the largest urban park in Asia. The edge of the city is also heavily forested.
#3 Tree Cover


A very densely populated city in Bangladesh, Dhaka receives ample rainfall, over 2,000 mm during the year. The city has many lakes, as well as notable parks and green spaces, such as beautiful Ramna Park. The edges of Dhaka metropolitan area that are not under cultivation are densely forested.
#4 Tree Cover


Ho Chi Minh City, Vietnam is a city whose streets are lined with very large dipterocarp trees. It’s a lovely place to walk, shop, look at local art, or enjoy delicious cuisine at one of the many street side restaurants and cafés while surrounded by lush tropical greenery. The city endeavors to plant many more, implementing a plan to plant 10 million more trees by 2025.
#5 Tree Cover


Moscow in Russia shares a humid climate with Europe to its west, giving it a lot of natural tree cover.
For more information…
To try your own analyses, or to find out more, be sure to check out the European Space Agency WorldCover 2020 Land Cover layer in ArcGIS Online. For more about the WorldCover 2020 dataset, be sure to review the WorldCover page from the European Space Agency.
Please feel free to reach out to us with comments or questions. Thank you!


Article Discussion: