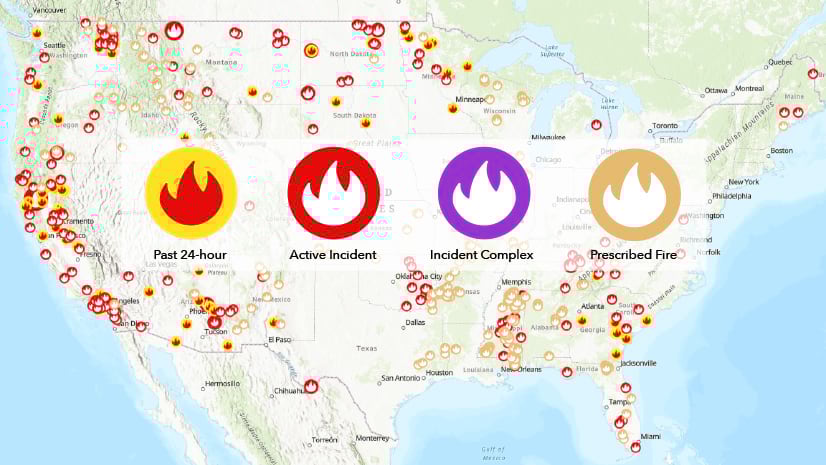
Have you looked at the USA Current Wildfires lately? Activity is really starting to pick-up along the West Coast, putting people and property at risk. Studies of the Wildland-Urban Interface (WUI) have shown that as development continues to expand out into previous undeveloped areas, more homes are exposed wildfire. Coupled with climate change and increasing fire season length, annual area burned, and annual area burned with high severity, wildfires are posing a greater threat to communities across the United States. Fire is a natural process in many ecosystems that we will never eliminate, but there are things we can do to reduce the risks to homes and communities.
GIS and spatial analysis are a powerful tool to be able to understand and plan for these risks. Fortunately there are a series of 15 new layers in ArcGIS Living Atlas of the World to help map and analyze risk from wildfires in your community.

Fireside Chats
Esri’s resident fire expert Chris “Fern” Ferner and I were able to speak with Greg Dillon, director of the U.S. Forest Service’s Fire Modeling Institute, about this new collection of wildfire risk products.
Can you describe what you and your team do at the Fire Modeling Institute?
We’re a group of analysts, ecologists, and fire behavior specialists at the Missoula Fire Sciences Lab that focuses on application of fire science to a broad community of fire management and land management professionals. Increasingly, we’re also working on getting fire science information out to the general public.
Which audiences or sectors can benefit most from this data?
The layers we created as part of the Wildfire Risk to Communities project are targeted at local land use planners, fire departments, and elected officials but we think neighborhood associations and homeowners will find them useful too.
Can you give an example of how someone can use the layers to analyze wildfire risk in their area?
Our Risk to Potential Structures (aka Risk to Homes) layer can help to compare the relative risk of wildfire to a home between any two locations. This can be useful in prioritizing areas most in need of mitigation work to make them more resilient. By summarizing any of the data by communities, users can then compare their ratings against any other community, find communities with analogous risk profiles, and share experiences, challenges, and success stories with peer communities about their wildfire mitigation efforts.
How often do these layers get updated?
We plan to update the data layers whenever the primary input datasets get updated. With current processes, that is likely to happen roughly every two years. We are beginning work already on version 2.0 of the Wildfire Risk to Communities datasets, which we plan to complete before summer of 2022.
How are these layers produced?
Most of the data layers are based on mapping of fuels and topography from the LANDFIRE program and subsequent fire behavior modeling. The three data layers that depict developed areas were created using Microsoft building footprints and U.S. Census Bureau data. [Detailed methodologies for wildfire risk and populations can be found on the USFS website.]
Putting the New Layers to Work
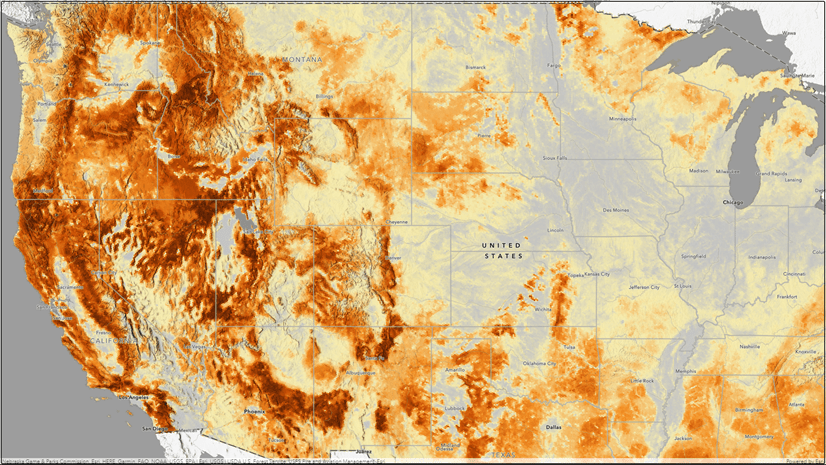
Downloading the data from the USFS for each state or the nation can take hours – they’re multiple gigabytes each. So if you’re running more regional analyses, these image services really come in handy. Here I was able to create 50 km2 hexbins for the area of Southern California where I live and work using the Generate Tessellation tool. Then by running Zonal Statistics as Table and joining the results back to the hexbins, we can see patterns of population density (blue) and wildfire risk potential (red). The darkest areas are the intersection of high population density and wildfire risk.

These layers could also be combined with the National Risk Index from FEMA or other Census demographic layers in Living Atlas, which provides a wealth of statistics for disaster events including wildfire metrics like annual expected loss estimates. Layers and maps like the one below are getting fire science and risk information out to the general public.
This map shows FEMA’s National Risk Index wildfire expected loss estimates for Census tract areas (darker blue = greater expected cost) along with the Housing Unit Risk layer from Wildfire Risk to Communities.

Wildfire is something that can affect anyone, and we think it’s important for people’s understanding of wildfire – what it is, what it isn’t, and what they can do to protect themselves from it – be rooted in the best available scientific information.


Article Discussion: