Water plays a central role in all our lives. Too much in the wrong place or not enough of it and it will inevitably end up in the news. Hydrologic systems have been extensively engineered and water moves across the landscape in complicated patterns that affect where we live, what we eat, and creates hazards that impact people and infrastructure.

Water shapes the landscapes around us and creates the land forms that we see. On the left we can see the meandering low-gradient rivers and marshes of the coastal plain in South Carolina. In the center image, the oxbow lakes are signs of the Mississippi River’s movements over time that create rich farmland along the Arkansas-Tennessee border. On the right, numerous canals reveal the major efforts humans have made to control the distribution and movement of water along the gulf coast of Florida.
They made it, we host it
To help us understand the distribution and flow of water in the United States, the US Geological Survey and partners have created the National Hydrography Dataset Plus High Resolution (NHDPlus High Resolution).
The National Hydrography Dataset Plus High Resolution provides the most detailed map of the waters of the United States available. The user’s guide provides the details of how the data were created and ideas for how they can be used.
With over 32 million features, the NHDPlus High Resolution provides a detailed view of the nation’s waters, complete with a rich set of attributes that enable you to create your own maps and use in analysis, filter, customize symbology, and configure pop-ups.
Now available in ArcGIS Living Atlas
A streamlined version of this incredible dataset is now available throughout the ArcGIS system in ArcGIS Living Atlas.
With nearly 25 million rivers, streams, pipe lines, and other linear features, over 7 million lakes, ponds, reservoirs, wetlands, and other area features, and exciting new cartography, the new high resolution feature layer is a significant advance over the previous version, which was based on the NHD Medium resolution dataset, and had 3 million line features and less than a half million area features. Quite the difference in feature count!!!
Use the slider to see the new, more detailed NHDPlus High Resolution feature layer versus the previous version.
As you can imagine, all those additional features equate to more detail and ultimately a more accurate representation of our country’s water ways. And who doesn’t want a more accurate view of our planet?! This new layer contains so much more detail than the previous version, you may find yourself losing track of time as you pan around the country looking at how we have adapted and engineered our landscape in order to control water.

Across the landscape, waterbodies reflect patterns of human development. On the left, the many straight lines reveal extensive engineering to drain lands in southern Louisiana while similar straight lines in the center map show the extensive irrigation systems that support the rich agricultural lands in California’s central valley. On the right, we see similar water systems that support agriculture along the Mississippi River in southeastern Missouri.
Available throughout the ArcGIS System
Not only does this layer work in online maps and apps, you can add it to your map in ArcGIS Pro and use it as an input to Geoprocessing Tools. You can even add it to a 3D scene and create animations that enable you to tell stories about the distribution and movement of water. Check out this insightful map we made using the NHDPlus High Resolution layer in a 3D scene animation.
For more comparisons showcasing the NHDPlus High Resolution and historical dams, see the Before the Dams StoryMap.
New Cartography
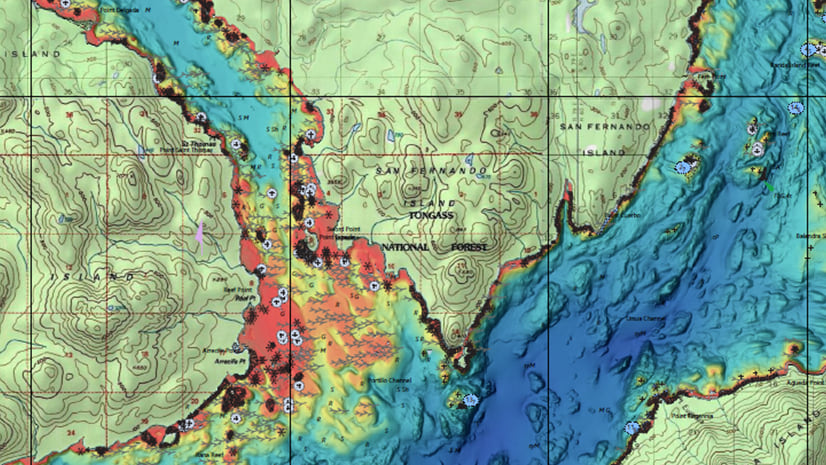
The default symbology of the layer is inspired by the familiar and intuitive traditional topographic map style used in maps made by the US Geological Survey. The layer is designed to work well with a wide variety of basemaps including the topographic basemap, the human geography basemap, and this cool custom basemap that was designed to highlight the layer. You will find that many Living Atlas layers are complemented by the new cartography, such as USA Croplands, USA Federal Lands, USA Protected Areas.

The NHDPlus High Resolution layer displayed with USA Cropland reveals the relationship between Lake Walcott, Minidoka Dam, and fields of potatoes, alfalfa, barley and other crops in Southeastern Idaho.
Designing the Symbology
While designing the symbology we faced a variety of challenges. The data has a high feature density that varies widely and like most water-related phenomenon it has many complex features.
In order to classify the lines appropriately, ephemeral and intermittent drainages were pulled out and symbolized with the classic hatched line. Pipelines and non-network features were styled using a conscious use of color so that the viewer can differentiate them across the landscape at varying scales. Streams and rivers were represented with an sequential blue palette along with a stroke size that increases and mimics their amount of mean annual flow.

Lines are symbolized by annual flow in cubic feet per second and feature type for ephemeral, intermittent, non-network and pipelines.
A neutral earth tone palette was used for the polygon features so that they would not overwhelm the map and also be pleasing and adaptable to many different light basemaps. By design, all of the polygons have an outline so you can detect even the smallest features when viewing the layer at the statewide level. Some of the polygon fills also attempt to evoke reality such as rapids with little blue dot bubbles, submerged streams with underground flowing dapples, and dams that are styled with light grey stripes to evoke a look of texturized cement.

Area feature symbols are modified from the familiar and intuitive USGS topographic map style and are based on the feature type attribute.
Rich Attributes
The line layer includes a key selection of attributes from NHDPlus. Feature Type and Mean Annual Flow are used for the default symbology. Other line layer attributes provide useful information including name, slope, mean annual velocity, minimum and maximum elevation, drainage area, stream level, stream order, and drainage area.
All of these attributes are available for analysis, and this layer can be used with GP tools. Clip out a piece for local analysis in Pro, or use it with the tools in ArcGIS Online. You can also apply filters, create your own symbology, and configure custom pop-ups. Importantly, the NHDPlus ID field allows other information to be connected to specific waterbodies through a join.
The area layer is symbolized using the field Esri Symbology. The field values are aggregated from the feature type field to reduce the number of unique classes and facilitate cartography. This is one way we have streamlined the service to achieve the best performance. (Watch for a future blog about other ways you can streamline your layers, coming soon!) Additional attributes include name, elevation, and area.
Stay Tuned for More
We are planning some follow-up blogs with a series of tips and tricks for working with this layer and others like it. We will also be at the Esri User Conference in July, showcasing great layers and datasets like the National Hydrography Dataset Plus High Resolution. Big thanks to the USGS and everyone involved in creating this phenomenal and very useful national dataset.


Article Discussion: