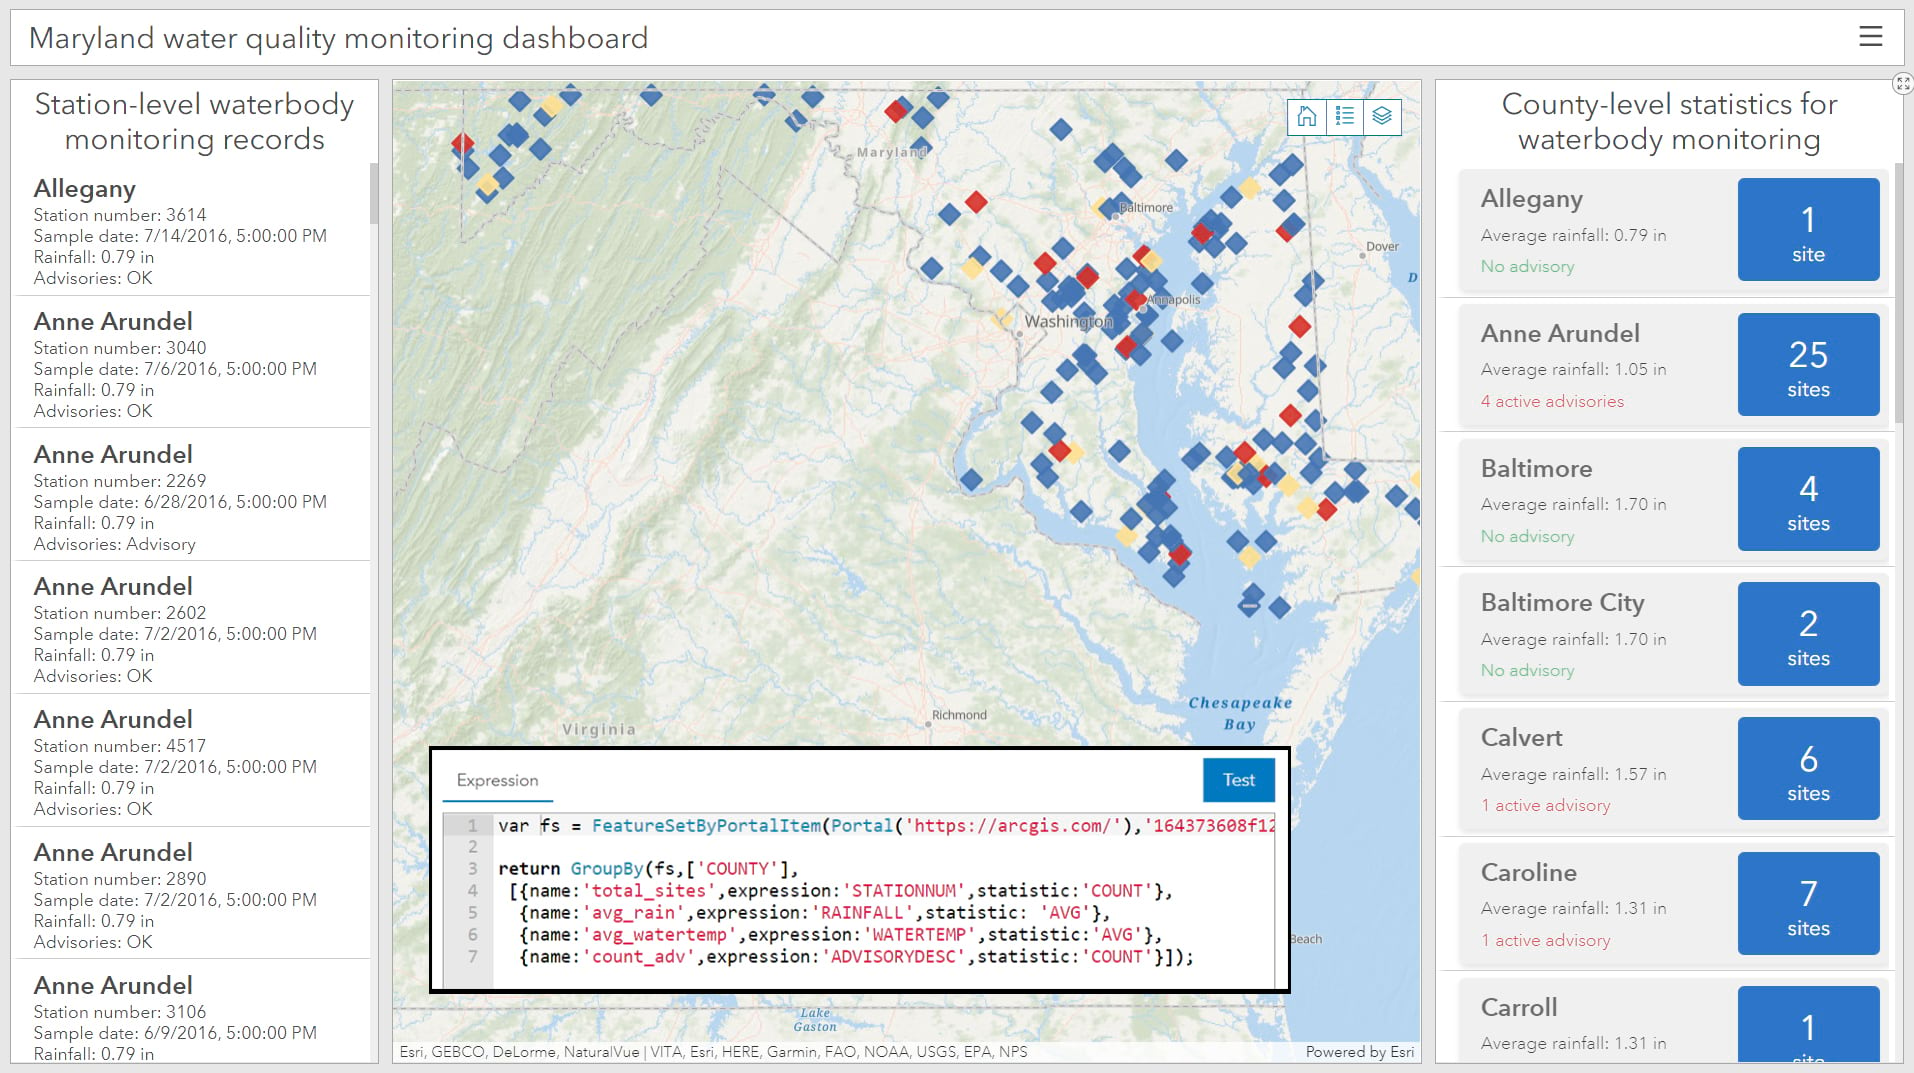
ArcGIS Dashboards Beta was officially introduced a year ago, and today we are happy to announce that with the April 2021 release, it is out of beta and available for general use. This new version of Dashboards, built on the ArcGIS API for JavaScript 4.X, has been renamed to ArcGIS Dashboards and is now the default experience for your organization to access dashboards. The previous version of Dashboards is now called ArcGIS Dashboards Classic.
Try using the new ArcGIS Dashboards
There are many reasons we encourage you to start using this new version of Dashboards.
First and foremost, the new ArcGIS Dashboards is robust, built on modern technology that can support the same workflows as Dashboards Classic, including mission-critical projects.
Both maps and dashboards are more performant. Maps can now load more features and those features load faster. Consider bringing maps to your dashboards that utilize all the new capabilities from the new Map Viewer (also out of beta).
In addition, there is a whole list of new capabilities and enhancements all dashboard authors can take advantage of when editing your existing dashboards or creating one from scratch.
Here are some highlights:
- Data expressions. Refer to the section below for more details.
- Advanced formatting using Arcade. Authors can now compose Arcade expressions to apply conditional formatting to both List and Indicator elements directly in the new ArcGIS Dashboards. Doing so promotes the customization of how data points are rendered and brings visualization to a new level for your audience.
- Selection-based display. A new authoring option is available to enable dashboard elements to render only when a selection is made elsewhere on the dashboard. Prompting users to make a selection before an element displays information allows authors to create dashboards that have a more specific focus and show only relevant data, making dashboards easier to read and faster to load with added context.
- Improved usability, including new summary statistics for percentiles and enhanced counting for non-empty and distinct values.
- The ability to use additional data sources in your dashboards, including feature collections and CSV web layers.
Introducing data expressions
Manipulating and structuring data to present insightful visualizations to your targeted audience is key to designing an effective dashboard. You may need to generate additional statistics or change the format of the data to tell your story. You may want to combine data from multiple layers or multiple fields from the same layer in order to show a more focused graph. All these things can be done with data expressions available starting with this release.
Data expressions allow dashboard authors to leverage the data that they have access to and return a Featureset as a new data source that powers one or more data-driven elements in a dashboard and ensures their interactivity. This helps uncover additional insights within the data and opens a new door for a creative and efficient way to communicate your story.
For more details of this new feature, refer to this help documentation. Check out this blog for a few good examples to get started and best practices.

What’s next?
If you own dashboards that were created in Dashboards Classic, the good news is that you won’t notice much of a change with your existing dashboards with this update, other than they are more performant overall. When you are signed into your organization, dashboards created with Dashboards Classic will now open in the new version by default.
In this way, you can preview how your existing dashboard looks and performs in the new version. If you are satisfied with the preview, and ready to try new capabilities and enhancements of the new Dashboards mentioned above, simply open the dashboard for editing and start making some changes. When you are done with the edits, click the Save button. Dashboard item details, including the item ID, will remain the same. Please note that saving a dashboard in the new version (aka upgrading a dashboard) will remove the ability to update the dashboard using the Classic version moving forward.
Sometimes you may be satisfied with the preview, but still would prefer to run some testing with the new version before you upgrade. In this case, open the dashboard for editing and click the Save As button. In this case, a copy of the dashboard will be created but with a different item id. The original version still remains and is present in the Dashboards Classic home page.
Upgrading your existing dashboards does not need to happen overnight. You have plenty of time to continue editing your classic dashboards from the home page of Dashboards Classic, before Dashboards Classic eventually gets retired.
If you have classic dashboards saved in your bookmark, or embedded in other applications such as ArcGIS StoryMaps or other website such as ArcGIS Hub, we encourage you to start changing those dashboard links to point to the new version.
Classic dashboard URL: https://www.arcgis.com/apps/opsdashboard/index.html#/<itemID>
New dashboard URL: https://www.arcgis.com/apps/dashboards/<itemID>
You will benefit from the instant performance improvement of both maps and dashboards, even if those classic dashboards have not been upgraded by the owner yet.
If your dashboard has the feature below, consider continuing to use Dashboards Classic for now, which can be accessed through the App Launcher.
- Follow feature (Pans target map elements to stay centered on a particular feature, example usage in this blog)
- Mapping functionalities that are only supported in the Map Viewer Classic. Refer to this blog.
Where can I find more information?
There are multiple resources available to help you get going with the new ArcGIS Dashboards.
- Help documentation – What’s New in ArcGIS Dashboards
- Past blogs with Dashboards Beta1 and Beta2
Post your question or feedback in the Esri Community Dashboards space (Esri Community Dashboards Beta space will be archived under general Dashboards space).

Article Discussion: