Counts in ArcGIS Dashboards are used in many ways. They are used in indicators and guages to show the number of features in a layer that match an (optional) set of filters. In serial charts and pie charts, counts are used with a field to categorize the underlying data into groups. The ArcGIS Dashboards Beta brings two new improvements to counts; the ability to count non-empty and unique values in a field. Let’s take a look at how you can use these improved counting capabilities to gain insights using the hourly Air Quality Data published by the United States Environmental Protection Agency (US EPA).
Improvement 1: Specify field to count non-empty values
You can now specify the field for a count statistic in the indicator, gauge, pie chart and serial chart elements. A count on a field returns the number of non-empty values in that field. It can be also be used with a filter to do a count on a subset of the data.
In the air quality data set, many fields like OZONE have empty values representing a no data scenario.

Let’s find how many sites actually reported Ozone and PM2.5 (two important metrics for air quality) in the last hour. By using the count statistic and selecting the associated fields for these metrics in the indicator element, we can show only the number of sites that published Ozone and PM2.5 readings.

Rather than getting the count of all records, we only get the count of records that have values for Ozone and PM2.5.

With this improvement to counts, serial chart and pie chart elements can now visualize a count of fields paired with grouped values. The below serial chart displays a count of alerts grouped by the ‘State’ field to show the number of active alerts by state/territory in a serial chart.

Improvement 2: Count distinct values in a field
To count distinct values or to eliminate duplicates, you can now use the distinct toggle on non-unique field types. This new feature is available in the indicator and gauge elements and gives you a count of distinct values in a field (number, string, date or decimal).
We can use this to calculate the number of states or territories that have active alerts using an indicator element. Since there can be more than one alert per state/territory, we will use distinct counts. This changes the count from showing every record with an alert, to just the count of states with one or more alerts. By adding a filter to include values with Air Quality Index (AQI) > 50 (threshold for unsafe air quality), we can display the number of states/territories with active alerts.

This gives a better picture of how many state or territories are reporting alerts.

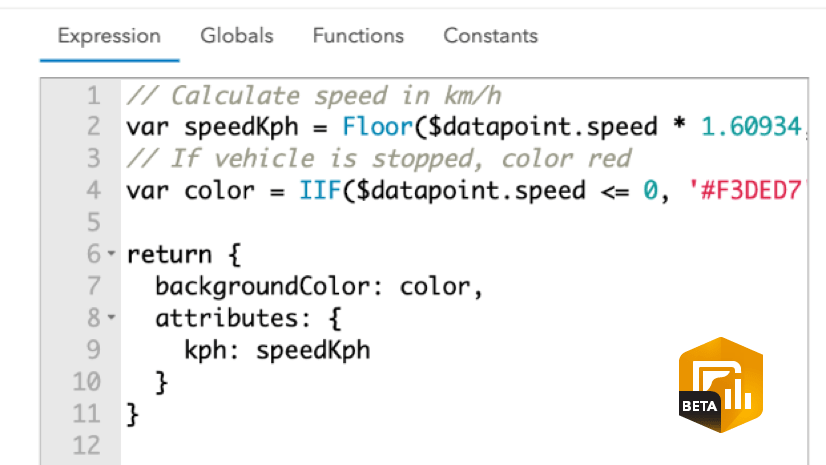
The improvements to the count statistic provide better insight from your data and can be configured in the indicator, gauge, serial chart and pie chart elements. Explore the EPA Alerts dashboard with elements created using these new capabilities. You can also create a copy of this dashboard and explore the configuration settings. Also, look for Arcade expressions (also new in the beta) to customize your indicator elements.

The Dashboards team at Esri is excited to see how you incorporate the new improved count statistics in your dashboards. If you’re able to, please share them with us on Twitter and LinkedIn using #ArcGISDashboards.
Join the ArcGIS Dashboards Beta GeoNet community for discussions, updates, and blogs.


The Distinct Count is a great capability – this alone has convinced me to try my next dashboard in Beta.