Working with imagery and remotely sensed data just got easier. Esri recently introduced ArcGIS Image Online for processing, analyzing and managing imagery, raster, and multidimensional data. This new product adds Esri’s extensive imagery capabilities to ArcGIS Online. These imagery capabilities, together with the advantages of not having to maintain and manage IT infrastructure, provide support for organizations concerned with operational efficiency and effectiveness.
ArcGIS Image Online allows you to tackle applications and projects by offering considerable benefits:
- Eliminate the need to manage and maintain IT infrastructure
- Make imagery and derived products available to those inside or outside your organization, including the public
- Bring image analysis capability to the hosted imagery rather than moving or downloading large collections to process them. Use standard image and raster analysis tools and functions, or build your own customized analysis and processing chains using the intuitive visual modeling interface
- Complexities of managing, updating and maintaining diverse collections of imagery are handled by the system
- Integrate imagery seamlessly within your existing GIS workflows
These advantages are addressed below, but first, let’s explore what is ArcGIS Image Online, and it’s capabilities and attributes.

How can ArcGIS Image Online help you?
I was recently in a meeting with local government professionals who asked, “Why would we want to host our imagery in ArcGIS Online”? Great question – the answer depends on context, and what you want to accomplish. Because the organization receives multiple imagery updates a year and performs image analysis in order to update their GIS landbase, and they share the imagery and derived information across the organization and the public, there are many compelling reasons.
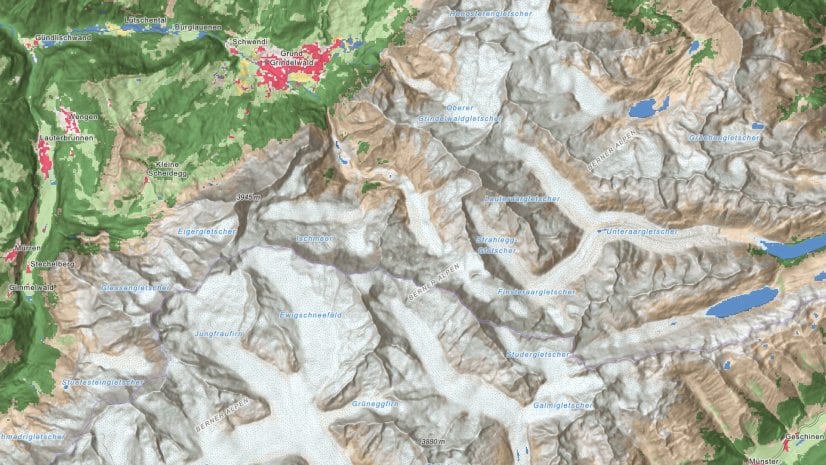
The value of imagery goes beyond a backdrop for GIS layers. Imagery allows you to produce and share maps containing actionable information. An example is the Burn Severity map of the largest wildfire in Colorado’s history, the Cameron Fire, below.

Burn severity maps are crucial for determining slope stability, public safety response, mitigation measures, water quality, and more. Hosting proper imagery with its associated metadata in ArcGIS Image Online, analyzing imagery with a robust set of tools and functions, presenting information, image and data management and curation, and making it all conditionally accessible to a variety of organizations and stakeholders, is all provided in ArcGIS Image Online. Since the imagery and raster data is saved within the GIS, it is seamlessly combined with vector data to provide this end-to-end, integrated workflow.
What can you do with ArcGIS Image Online?
Hosting and analyzing collections of imagery and raster layers are described below, along with some general workflows to show you how easy it is.
Store imagery once, use it continuously
Transfer your imagery from local storage media and into the cloud, where it can be managed, shared and accessible to all stakeholders. Hosting your imagery and raster collections in the cloud is straightforward – I saw a blog noting that, “it is so easy, even your boss could do it” – indeed. Simply follow the easy-to-use guided workflow.
Choose to add a Tiled Imagery Layer or a Dynamic Imagery Layer, depending on your intended use. Use Tiled Imagery Layer to host a single mosaicked image layer, or one or more individual image layers in a tiled format for fast performance, image processing and analysis. Use Dynamic Imagery Layer to host an image mosaic layer or collection of images where you can manage, process and analyze individual images comprising the mosaic or collection.
The imagery published to your online folder has its own Item page and URL. On the items page, you specify the settings for the image file, processing and display, and sharing.
Analyze Imagery in the Cloud
Remotely sensed imagery and multidimensional raster data is not just a pretty picture. Tools and functions in ArcGIS Image Online transform it into a smart image. You can analyze hosted tiled and dynamic imagery layers, and extract actionable information for operational decision support. Map Viewer and Map Viewer Classic support visual analysis of imagery and raster layers. Enhance imagery with renderers such as Stretch and Colormap, and apply any number of standard or custom raster function templates published with the image layer.
Analyze imagery in three ways with Map Viewer Classic, using:
- Standard tools on the Raster Analysis pane
- Standard raster functions using on-the-fly processing
- Custom raster function templates and processing chains built in the Function Editor pane, and shared with members inside and outside your organization.
Both dynamic and tiled imagery layers support all the bands, bit depth and other characteristics of the source imagery, and are suitable for accurate image analysis and processing. Both imagery types can be analyzed using tools on the Raster Analysis pane. Additionally, dynamic imagery layers support on-the-fly processing using functions and raster function chains.
Raster Analysis pane
The Raster Analysis pane in Map Viewer Classic includes more than 25 raster processing tools contained in functional categories. These tools produce a new raster analysis layer that can be saved to the cloud. Refer to the list of tools for more details.

Click on a tool in the Raster Analysis pane to display the tool and adjust parameters, including output name and location to save the new raster layer in the cloud, then Run Analysis. Upon completion, the new raster item will be created, and you can add definitions, specify sharing conditions, etc.
Raster Functions
ArcGIS Image Online provides many raster functions to process and analyze dynamic imagery and raster data. Dynamic imagery layers can be processed on-the-fly using raster functions that are applied as you pan and zoom your imagery in the map display. Since image processing calculations are only performed on pixels that are visible in your map, you can view and analyze results immediately.
More than 150 raster functions can be used to process dynamic imagery, or can be chained together to create custom raster function templates (RFTs). These RFTs can be saved and shared with members of your organization, and applied to different sets of imagery to standardize processing and results.
Depending on the characteristics of your imagery and project requirements, you usually need to adjust parameter settings multiple times to optimize your results. After you fine tune your parameter settings, you can publish your final results to the cloud. Or you can publish the source imagery with any number of RFTs, which render different products and visualizations in your map viewer. For example, you can publish a collection of Sentinel satellite images with RFT’s that display the data as an orthoimage mosaic, and visualize land cover classes, stressed vegetation, burn severity, different band combinations and ratios, and the results of your custom algorithms as you zoom and pan the imagery.
You can find the raster functions in the Custom Analysis Tools and Raster Functions pane.
Raster Function Editor
Raster function templates are built or modified in the Raster Function Editor. The Raster Function Editor is a visual programming interface for building imagery and raster analysis processing chains. Function chains are represented as diagrams in which functions are chained together, using the output of one or more functions as the input to another function. These raster function chains can be saved as raster function templates, which you can reuse to automate your image analyses and processes.

To summarize, you can host imagery in different configurations in the Cloud. Hosted imagery layers can be shared to members of your organization or group, and analyzed using a variety of standard and custom raster functions and RFTs. Imagery products can be hosted, managed and shared in the cloud, or visualized in Map Viewer.
A word about credits
Credits are consumed to store and process imagery. The number of credits consumed to store hosted imagery layers depends on the layer type, number of images, and size.
The number of credits consumed to process imagery depends on the complexity and CPU resources required. After you specify tool and function parameter settings, the estimated number of credits needed to process your imagery is calculated before you click “Run”. Refer to Understanding Credits for more information about credit usage.
Benefits and advantages
Do more with less
A big benefit is that local governments engaged within the “Business of Governance” no longer have the responsibility and expense to build and manage the required IT hardware, software, and security infrastructure. Let the experts at Esri handle the big challenge to properly host, maintain, protect, update and manage large collections of imagery and ancillary data. Take advantage of the many benefits of cloud computing power, storage, and scalability. This allows you to focus on your area of expertise and serving customers.
“There are so many advantages to hosting and processing imagery online instead of having to do all that inhouse, and we’ve been pleasantly surprised and impressed.”
Edward Cherry, GIS and Technology Director of the City of Durham, NC
Accessibility with Security
Projects often involve different stakeholders in management, operations, production, in the field, headquarters, and remote offices. And can include other stakeholders outside the organization, and even involve the public. Proper sharing of imagery layers and derived products with members and stakeholders up and down the chain is important for effective communication, operations and governance. These members have different needs and permissions to view, edit, analyze, publish and share imagery layers and information products. The data is secure, the access at different levels is secure, and you know it will be managed and maintained properly. Peace of mind.
Integrated solution
You know that managing, analyzing, maintaining and sharing imagery products have unique and demanding requirements. The dataset range from large to huge, have diverse technical characteristics, and data integrity needs to be maintained and documented to support accurate analysis.
All these factors play nicely together in an integrated manner within Esri’s “system of systems”. Imagery data and products are fully integrated with all the GIS capability in ArcGIS Online, and ArcGIS Pro, Enterprise, extensions, field apps, dashboards and more. This enables you to assess and analyze all available data and information needed to make timely, well informed decisions.
Image processing and analysis
“Our goal is to accurately identify impervious areas faster than we can do it manually. The deep learning and classification toolsets in ArcGIS Image give us this advantage.”
Edward Cherry, GIS and Technology Director of the City of Durham, NC
Image analysis is no longer just the domain of the remote sensing scientist; all GIS practitioners can analyze imagery either visually or computationally, and benefit from the insights. To enable raster analysis, ArcGIS Image Online is designed to perform computing in a processing and storage environment that maximizes speed and efficiency. Built-in tools and functions cover Image processing, remote sensing analysis, and an extensive range of math operators. These functions process multispectral and hyperspectral imagery, multidimensional scientific data, and temporal data for time series analysis. This capability, curated for many years, is referred to as part of Esri’s Science of WhereTM ecosystem.
Use the visual programming interface in the Function Editor to build, run, and share custom functions that extend analytical capabilities to address your unique applications and operational requirements.
Empowerment and effectivity
The benefits of ArcGIS Image Online are more than the sum of the parts, which include:
- Save on infrastructure costs and maintenance using a secure, scalable, and performant cloud environment managed by Esri.
- Analyze imagery and raster data using advanced out-of-the-box tools and functions. Or build custom RFTs to produce services using diverse imagery and raster datasets – all stored, managed and streamed in the cloud.
- Collaborate with project stakeholders at all levels, and share services, information, processing chains, and more, with the proper members inside and outside your organization.
All these advantages result in operational efficiencies and cost savings. More importantly, ArcGIS Image Online represents a new way to bring together the “System of Systems” for robust decision support in operational environments.


Article Discussion: