ArcGIS StoryMaps is the professional tool for harnessing the power of maps to communicate your work using geospatial storytelling. The easy-to-use builder enables you to combine maps, 3D scenes, embedded content, multimedia, and more to create an interactive narrative that can inspire interest — and action — from your readers.
Each month, our team uses community feedback to help inform new capabilities that can enhance your storytelling adventures. Check out what’s new this month!
Quick links
- Quiz block in stories and frames
- Image to chart/table conversion
- Open a pop-up using map actions
- Map actions in briefings and frames
- Pictograph enhancements
- Collection enhancements
- Theme builder enhancements
- And more…
Quiz block in stories and frames
It’s here, folks. Whether you’re crafting a dynamic story or classroom experience, a museum exhibit or public engagement campaign, quizzes can help transform readers from passive observers to active participants. By encouraging reflection and reinforcing key concepts, they offer a simple way to make your content more engaging and memorable.
To begin using quizzes in your stories and frames, select Quiz from the Basic block options:
- Click to type text in the Add a question and Choice spaces (you can add up to four potential answer choices for each question).
- Hover over a choice to reveal a checkmark icon; click the checkmark to Set as correct choice.
- Select Edit Quiz to find Question options, Add question, Result screen options, and Delete quiz.
- In Question options, add a Correct choice explanation and/or a Hint.
- In Result screen options, modify the default Completion message, provide Additional information, and toggle on/off the option to Allow readers to retake this quiz.
If you choose to Add question, resulting in more than one question per block, slide navigation will appear next to Edit Quiz, along with additional options to Remove this question and Reorder questions.
Currently, quiz responses aren’t collected, though we’re actively exploring capabilities like that for the future. If you have feedback about the quiz block or ideas for how it could evolve, we’d love to hear from you in Esri Community.
Learn about the efficacy of giving your readers moments of pause and reflection in our March 2026 | Finding your rhythm issue of StoryScape℠.

Image to chart/table conversion
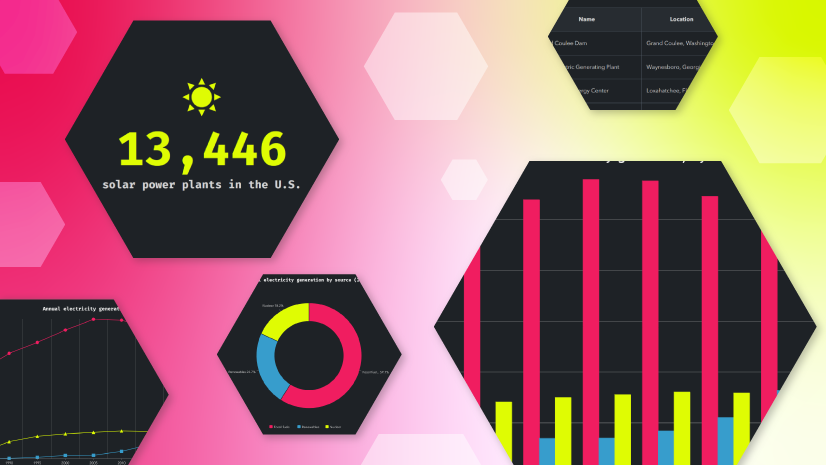
Speaking of giving your readers a break from long sections of text, we continue to level up your data visualization capabilities in stories. We know that recreating existing charts and tables can be time-consuming, but adding a screenshot to your story can be a buzzkill — they’re neither dynamic nor accessible. Enter image to chart or table conversion.
Now, after adding an Image of a chart or table to your story, the option to Convert image will appear in the editing toolbar for that image; select Convert to chart or Convert to table to initiate. After the conversion is complete, it is imperative that you select Edit to review the Data and Settings for accuracy.
In June 2026, we introduced the document to story conversion capability. Image to chart/table conversion can further streamline the process of transforming PDF and DOC-based content into stories.
Learn how to use charts, infographics, and tables effectively in ArcGIS StoryMaps.
Open a pop-up using map actions
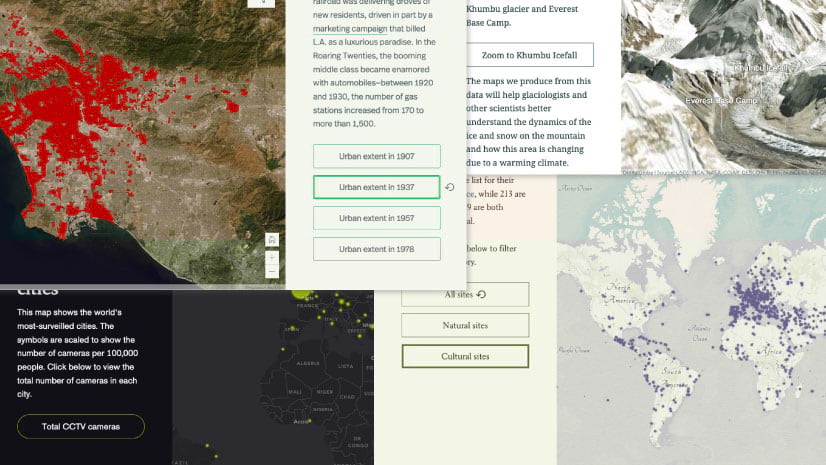
Maps are most effective when they reinforce your narrative — and map actions make that connection more direct by enabling interactive buttons or text links that let readers change a map’s view, turn specific data layers on or off — or now, open pop-ups directly from the narrative text.
To open a pop-up using map actions, select the text that you want to apply Action to and Configure map action in the map editor by opening the desired feature’s pop-up and Save the action with that pop-up showing.
Map actions in briefings and frames
And that’s not the only big change when it comes to map actions. You’ve long been able to guide readers’ attention to compelling places and patterns in stories, but now it’s time to bring that same interactivity to your briefings and frames.
To get started, add a slide containing both a Map and Text. Then select the text that you want to apply Action to and Configure map action in the map editor.
Get inspired by this collection of stories that use map choreography and map actions to craft immersive geospatial narratives.
Pictograph enhancements
In June 2026, we introduced the Pictograph, a visualization option in the Infographic block that’s effective for making data more tangible through recognizable symbols. New this month, you can now:
- Choose between Single value or Part to whole.
- Arrange Icons per row using Automatic or Custom settings.
- Place up to three pictographs side-by-side.
Get inspired by this collection of stories that use data visualization to communicate their message.
Collection enhancements
Also in June 2026, we introduced the capability to add web maps, scenes, and express maps to your collections. This month, we’ve expanded those capabilities, enabling you to configure maps and edit images directly within a collection.
For maps, clicking Edit opens the familiar Adjust map appearance panel, where you can modify Layers, Bookmarks, and Options.
For images, Edit launches the image editor, where you can Crop, Markup, Rotate and more. The Options menu provides additional media settings including Fit or Fill, Color or Blur background, Attribution, Alternative text, and more
Start your first ArcGIS StoryMaps collection with this blog sharing best practices for curating a navigable ecosystem of content.
Theme builder enhancements
Theme samples
Themes are used across all ArcGIS StoryMaps content types — stories, collections, briefings, and frames — so, it only makes sense that you’re able to preview your theme across each experience. Now, in the theme builder, you can Choose preview content to check out how your theme selections appear for all content types.
Slide background customization
In May 2026, we added the capability to customize your slide backgrounds in the briefing builder. Now, those same customization options are also available in the theme builder via a new Briefing slide background section. Enable Use custom background and choose a Color, Gradient, or Image style to apply a consistent look across your briefing.
And more…
- The ArcGIS StoryMaps assistant now supports your preferred language when generating alternative text and story insights summary information
- Briefing slide numbers now display in print preview.
- The capability to suggest alternative text has been expanded to express maps.
- Featured themes now include a High Contrast Dark option.
Check out the release notes for more details about other small changes and fixes released this month.
Build a story with us. Register for 2026 ArcGIS StoryMaps Live, a chat series that walks through practical techniques for crafting geospatial stories that resonate.
How are you bold in the pursuit of better? Learn more about the 2026 ArcGIS StoryMaps Competition opening on September 8, 2026.
Thank you to Ashley Du and Will Hackney for their contributions to this post.
All Adobe Stock images are © 2026 Adobe Stock. All rights reserved.


Article Discussion: