ArcGIS StoryMaps is the professional tool for harnessing the power of maps to communicate your work using geospatial storytelling. The easy-to-use builder enables you to combine maps, 3D scenes, embedded content, multimedia, and more to create an interactive narrative that can inspire interest—and action—from your readers.
Each month, our team uses community feedback to help inform new capabilities that can enhance your storytelling adventures. To begin the year, check out the many updates made to some of your favorite features:
Quick links
- Add a footer to briefing slides
- Generate theme from reference image
- StoryMaps content page
- Charts
- Documentation
- And more…
Add a footer to briefing slides
Briefings continue to serve the slide-based presentation needs of our user community—and we continue to respond to your feedback! We are excited to introduce the capability to add a footer to your briefing slides, making it seamless to add further context, attribution, or branding to your presentations.
In the Design panel, there is now a section to add and modify a Footer:
- Toggle on Show footer to reveal a Text field where you can enter the desired footer text.
- Highlight text to reveal a stylization menu with Bold, Italic, and Hyperlink options.
If you have a logo uploaded to your briefing via the Logo section of the Design panel and have Footer enabled, your logo will appear in the footer.
Learn five ways to use footers in ArcGIS StoryMaps briefings.

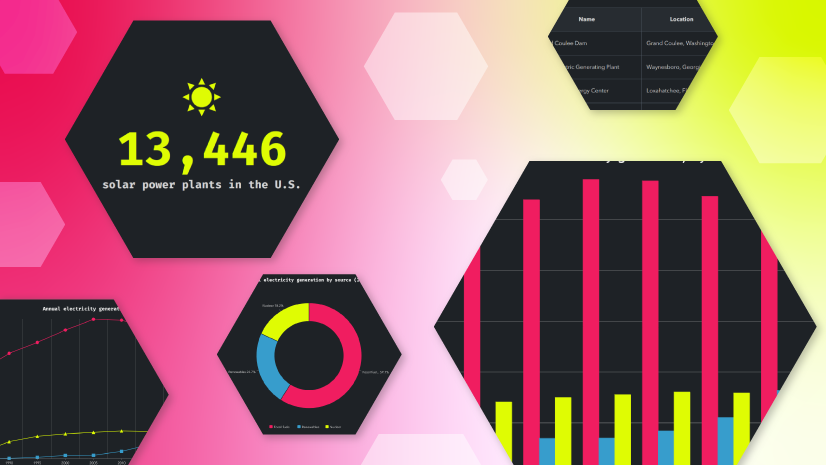
Generate theme from reference image
In July 2025, we introduced four AI assistants designed to serve as thoughtful collaborators in your storytelling endeavors. This month, the theme assistant received a major boost, enabling you to generate your theme from a Reference image.
In the theme builder, select the Generate theme option from the starting panel; you will then see the options to Add image and Generate. If you’re satisfied with the result, select Save and edit to fine-tune your generated theme. Not satisfied? Select Regenerate for a new option. Note: You can still provide a text prompt in addition to the reference image; it doesn’t have to be one or the other!
Learn more about using a custom theme to create a little world for your readers with these Nine steps to great storytelling.
StoryMaps content page
In October 2025, the StoryMaps content page received major updates to improve usability and accessibility. This month, we’re excited to add a much-requested feature: view counts. Now, the view count is visible on the item card when viewed in Grid, or in its designated column in Table view.

Charts
In December 2025, we added the option to stack multi-series data in column and bar charts; this month we added the choice between Stacked and 100% stacked:
- Stacked shows both the total size of each category and the absolute contribution of each series within that total. This helps readers compare total amounts and understand the breakdown of those totals.
- 100% stacked converts each stack to the same height (100%), showing only the proportional contribution of each series, not absolute values. This helps readers compare ratios instead of raw amounts.

Documentation
In December 2025, we introduced several updates to the ArcGIS StoryMaps Documentation page to improve its organization for better navigation and learning; this month, explore the new and improved Collaborate and Share, Learn, and Design sections and new Accessibility topics.
And more…
- In the theme builder, Shape now applies to the quote and link styles.
- Frames can now be duplicated from the item card on your StoryMaps content page and the frame viewer.
- The capability to Switch panel placement has been added to the swipe block.
- Several text stylization options have been added to the Time and date portion of the timeline block; highlight the text to reveal the menu of options.
Thank you to Ashley Du and Will Hackney for their contributions to this post.
All Adobe Stock images are © 2026 Adobe Stock. All rights reserved.


Article Discussion: