
During the eclipse in 2017, my team worked with the Smithsonian on acoustic biomonitoring. We heard the bats come out and go back in as if they were watching the show. In the middle, the prairie dogs started chattering and telling everybody, ‘Hey, there's a problem here.’ It was really fun.
Dr. Sharolyn Anderson is a physical scientist with the Natural Sounds and Night Skies Division at the U.S. National Park Service. Among other groundbreaking scientific endeavors, the division uses geospatial modeling and computer science to identify light sources — both within and outside the parks — that affect the quality of the night sky. They also develop solutions to reduce, mitigate, and prevent excessive nighttime light, which involves working inside parks and with surrounding communities.
Spend a little time with Dr. Anderson and the StoryMaps team, and rediscover the wonder of dark skies and the science behind your nighttime view. The following conversation has been edited for brevity and clarity.

Q. Can you please tell us a little bit about your background?
A. I have one of those twisty stories with unexpected turns and a thread of computer science running through it.
I was one of very few women in my computer science program at the University of New Mexico, and my degree led to an IT position at San Juan College in Farmington, NM. They had a brand-new Unix system and no one who knew Unix — except me. The position brought new opportunities and a new direction.
One day, a colleague displayed the output of my code converting BIL to BSQ showing a remote sensing image of the La Plata River where different temperatures merge. The zeros and ones exploded and became this amazing colorful river.
And that visualization led me back to the University of New Mexico for a master’s degree in geography, a stint as a GIS manager, and Arizona State University for my PhD. I knew then that GIS would change the world and was the way of the future. For many years, I expanded my knowledge through research and teaching GIS, remote sensing, spatial analysis, and environmental modeling at Texas State University, University of Denver, and University of South Australia.
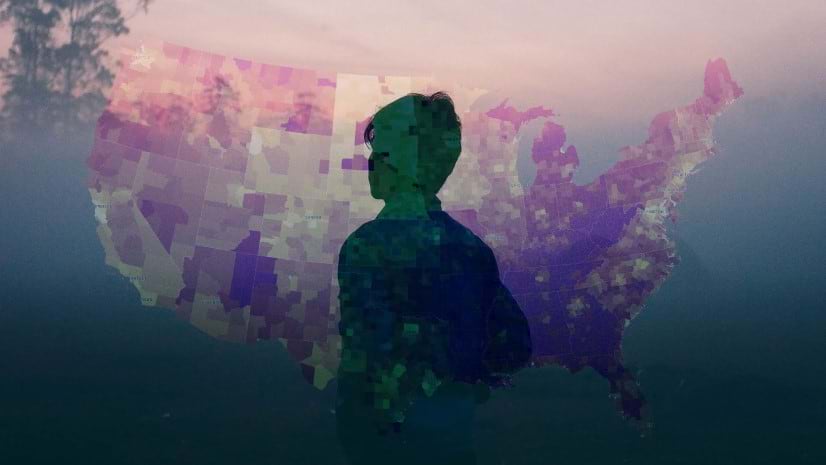
Then in 2017, a position opened with the U.S. National Park Service, Natural Sounds and Night Skies Division (NSNSD). I had never worked in a park, or even volunteered in a park, but I loved parks. I had developed an interest in night sky imagery from the first Defense Meteorological Satellite Program (DMSP) nighttime lights image that I was given for a project.
Now I’m a physical scientist for the U.S. National Park Service, and I love it.
Q. What is the Natural Sounds and Night Skies Division and what does your work entail?
A. The Natural Sounds and Night Skies Division is a national office that support national parks across the U.S. We have three primary responsibilities. We support parks in the preservation and restoration of acoustic and photic environments. We advance scientific understanding. And we inspire public appreciation of soundscapes and dark night skies.
Most of NSNSD uses GIS — both ArcGIS Pro and ArcGIS Online — in both the night skies and natural sounds work.
We like to think of acoustics as a geospatial science. GIS helps us select “where we monitor,” like the distance to flowing water. The location is important as it helps explain natural ambient sounds.

In my position, I work on the landscape modeling of both natural sounds and night skies. I tend to work more with the night skies team where we use ArcGIS Online to inventory the lighting of parks and work on replacing lights that harm the environment. I also collect night sky data to evaluate the quality of the night. We use a combination of python and ArcGIS to model night skies.
Q. Are you trying to manage light pollution just coming from the park, or are you working with local communities to mitigate light pollution?
A. That’s a really good question. Yes and yes.
We work with the International Dark Skies Association, local cooperatives like the Colorado Dark Sky Cooperative, and cities or towns just outside the national parks called gateway communities.
Often parks come to us and ask, “What can we do?” We help with their inventories and measurements since the tools can be expensive, and this also provides for consistency across all the different NPS units.

Those collaborations often lead to innovative research in or around parks, like a recent study at Colter Bay Village in Great Teton National Park. In Colter Bay, the 32 lights illuminating their large parking lot were retrofitted to shine in different color spectra of both warm-white and red lights. NSNSD and our partners have monitored the influence on wildlife and humans — with positive results for both. Parks offer the ability to test scientific assumptions, and when it works, other parks can adopt similar management tools. It’s a win–win.
Q. What role does communication play in achieving your work and mission?
A. The bad news is that light pollution grows seven to ten percent annually. The good news is that it’s possible to reduce and even remove light pollution with education and mitigation techniques.
So for our team, clear and engaging communication can drive real change. Fortunately, we have a great relationship with the agency’s communication team — and for good reason.
The Natural Sounds and Night Skies Division has three staff members who also happen to be amazing photographers. With cameras in hand, they head out for field work and return with beautiful photos as a bonus.

The field work itself results in eye-catching data visualizations — like maps, dashboards, and stories made with ArcGIS StoryMaps — that make science more accessible to the public. And because the National Park Service has its own web content management system and built-in widgets, our communications team can easily drop in those GIS products seamlessly.
Q. Your Night Skies of the U.S. National Park Service story, created with ArcGIS StoryMaps, does a great job of communicating science. Can you walk us through the basics?
A. During my first months with the Park Service, I worked on a Simplified All-Sky Light Pollution model with a write up for a scientific journal. The work was exciting! To share the model beyond, NSNSD turned that complex scientific model into an engaging night sky story with ArcGIS StoryMaps. That idea blossomed into what we have today.
Night Skies of the U.S. National Park Service, meant for every park visitor or anyone in the public, opens with an introduction to night sky science including why the National Park Service protects darkness. The story then dives into more complex scientific ideas. The story has been extremely popular. In mid-2023, before we took it down for an update, we had almost 30,000 views.

Technical cameras, sky data, and more come to life with compelling photos, videos, and maps. Through an interactive map tour, readers visit the darkest sky parks in the U.S. and find dark skies nearby.

The experience ends with a clear call to action — how individuals can support dark skies.
Q. How did you become familiar with ArcGIS StoryMaps? Why ArcGIS StoryMaps for this narrative?
A. My ArcGIS StoryMaps experience goes back to the University of South Australia. My students built and presented stories for their final class projects.
When I joined the National Park Service, I used ArcGIS StoryMaps in a similar way. There was so much to learn about the many parks nationwide and the scope of our scientific work. Where would I start? How would I organize the information?
Enter storytelling. I created an interactive story with ArcGIS StoryMaps that captured the history, geography, science, and administrative responsibilities of our division. In the process, that story helped me understand and communicate the science that we do quickly. Other team members in NSNSD were also working on study maps, including Dr. Adam Beeco who created the story about the history of overflights.
The team now leverages ArcGIS StoryMaps as a hands-on learning tool — for us and our park visitors.
Q. What role do ArcGIS StoryMaps and other map-based tools play in engaging younger generations in science and technology?
A. I’ll answer with an example.
The updated version of our night skies story was updated by JaneAnne Stockton, our Scientist in the Parks Intern. I brought JaneAnne onto the team because she was a math musician, which aligned with my acoustical work. And she, in return, offered a new perspective on projects.
She was excited by the ArcGIS StoryMaps project and reimagined it with a regional component and updated format. The platform empowered her to use her creativity and analytic skills in a new and visual way.
That’s what youth need — something that meets the needs of a digital-minded generation.
Q. Do you have any final advice or thoughts for our readers?
A. Storytelling is a valuable skill and always a work-in-progress.
I have multiple degrees. I can model and code and build things. However, with all these skills, I find writing and storytelling a great challenge.
Thus, my advice is to spend time crafting your writing and communication skills or other informal learning like improv, ABT training, and mentors. I’ve taken many storytelling and science writing courses, and every time, the training is useful at my job, where I volunteer, and life in general.
Your carefully crafted communication skills make science fun, accessible, and inclusive.
This featured storyteller interview was prepared as a part of the April 2024 Issue of StoryScape℠ | Celebrating dark skies.
For more interviews and articles like this one, be sure to check out StoryScape℠, a monthly digital magazine for ArcGIS StoryMaps that explores the world of place-based storytelling — with a new theme every issue.
Article Discussion: