
GIS Day 2023, a worldwide recognition of geography, is just two weeks away — November 15. And the theme this year is Celebrating the GIS Professional.
Celebrate GIS and the people behind the maps with us!
When it comes to the many applications of GIS, we often think first about how GIS tools can be used to solve the critical problems that are facing our world. Those endeavors are vitally important, of course, but it turns out there are so many less predictable uses of GIS.
Had it ever occurred to you that GIS could be used to improve your golf game? Or in conjunction with your woodworking hobby? Or to provide talking points for your college football banter? Those are just a few of the creative ideas that are brought to life by the six featured storytellers in the November 2023 Issue of StoryScape℠ magazine.
Meet our featured storytellers below and learn what inspires their GIS work.

The combination of data collection apps and analytics tools allowed me to quickly turn their data points into analytics revealing the power of spatial analysis and saving me having to explain how cool GIS can be.
Warren Davison
Warren is a cartographer and graphic designer on Esri’s StoryMaps team. As a former GIS Analyst, he used GIS to solve practical problems. Now, he shares the incredible stories of GIS applications and interesting datasets through maps and graphics.
Featured story: Divots and dashboards

Read Warren’s inspiration for the story: Analytics are present in so many aspects of our lives, and televised sports are no exception. There’s a lot of time and effort being spent on where a ball, or a player, goes. While this data primarily seeks to help players and teams gain an edge over their opponents, sometimes the humble spectator gets to enjoy a map or chart aggregating these data points. In my mind, these are all gateways to GIS and demonstrate both the power of spatial analysis and the pervasiveness of location.
So often these crazy ideas pop into my head, and I cannot rest until I either try it or it becomes obvious that the idea is simply too crazy. Fortunately, in this case, it was an interesting challenge, and I was able to use GIS to map disparate shots in hopes of detecting patterns that might guide improvements to my golf game. That being said, keeping a digital scorecard is also a great way to keep track of who’s the better golfer among your friends.
GIS tools made this playful adventure possible. Without the resources of an entire sports coverage team at my disposal, I needed tools to help me collect and analyze the data. More importantly, the data collection needed to be fast and easy if I had any hopes of also convincing my friends to contribute their data for comparison. The combination of data collection apps and analytics tools allowed me to quickly turn their data points into analytics, revealing the power of spatial analysis and saving me from having to explain how cool GIS can be.
Read Warren’s posts on the ArcGIS blog.

Part of the appeal of the Humboldt project was understanding how to adapt the technology to preserve the experience of walking through an art museum exhibition.
Eleanor Jones Harvey
Eleanor is the Senior Curator of 18th and 19th century paintings at the Smithsonian American Art Museum (SAAM). As a curator she develops exhibitions, writes the accompanying books, seeks out artworks for the collection, plans and installs the permanent collection galleries, gives lectures, and develops programs to encourage lifelong learning in the arts.
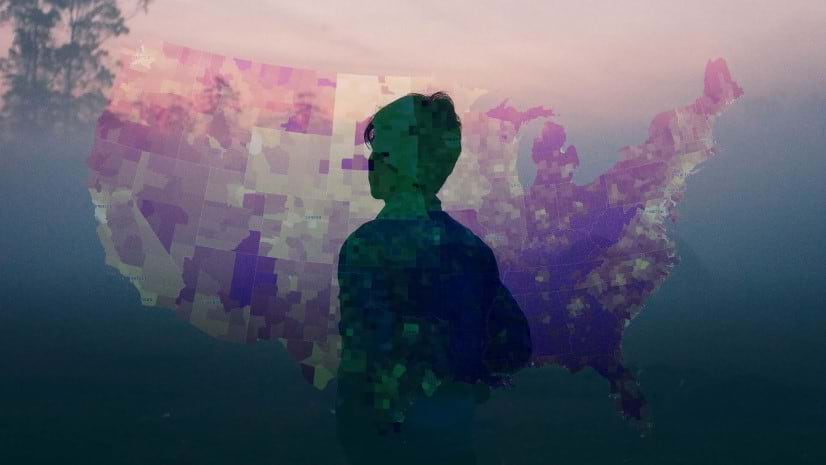
Story: Alexander von Humboldt and the United States

Read Eleanor’s inspiration for the story: The inspiration was my exhibition Alexander von Humboldt and the United States: Art, Nature, and Culture, a project that featured Humboldt’s 6-week visit to the United States in 1804 and its downstream impact on American art, our cultural identity tied to natural monuments, and the exploration of the American west. Humboldt’s friendship with [Thomas] Jefferson, his advocacy for American democracy, respect for indigenous cultures, and his strident support for the abolition of slavery were also prominent features of this exhibition. I created this exhibition and wrote the accompanying book as a capstone to 30 years of working on the cultural significance of American landscape painting; this project extended beyond the normal inclusion of paintings and sculptures, featuring maps, scientific instruments, and the mastodon skeleton excavated by artist Charles Willson Peale, which Humboldt saw in Philadelphia.
GIS tools allowed us to create an evergreen virtual tour of that exhibition, focusing on specific objects that represented each of the themes teased out in the exhibition galleries. By combining our Sketch-Up 3D model of the installation space, high-resolution images of the key works, and texts drawn from the gallery labels and informational panels, the resulting story provides a fantastic way to encounter the project and absorb the key messages. The powerful GIS armature allows us to make this a rich viewing experience, and serves as an archival interpretive tool for studying how installation design contributes to unfolding exhibition narratives.
This was my first experience working to create a GIS story, and I believe this is a compelling way to capture the essence of a museum project. Part of the appeal of the Humboldt project was understanding how to adapt the technology to preserve the experience of walking through an art museum exhibition. I hope I will have more opportunities to partner with Esri in the creation of additional art museum-related GIS projects!
Explore the Alexander von Humboldt and the United States: Art, Nature, and Culture exhibit online.

The map tour at the end of this story specifically let me map real-world places to my own interpretation of the river, guiding readers through a virtual show-and-tell of the project and river.
Aaron Koelker
Aaron is a member of the Enterprise GIS team at the Florida Department of Environmental Protection. The team supports the spatial needs of multiple state agencies and their mission projects — from mapping sea turtle nests to tracking water quality. Aaron applies these experiences to personal projects, where he flexes his creativity and cartographic skills.
Featured story: From trash to topographic

Read Aaron’s inspiration for the story: The Apalachicola River holds a special place in my heart — supporting both a deep human history and one of the most biodiverse ecosystems found in all of North America — and I made the table featured in From trash to topographic as a sort of personal memento. The story came together soon after as a way to document the process of building the table, and to share some of what makes the Apalachicola River such an interesting place with others.
In most of my map projects, I try to take a holistic look at whatever topic I’m covering, and the versatility of ArcGIS StoryMaps helps me to accomplish that with the ability to combine a variety of mediums and interactive tools into a single narrative. The GIS components, like the maps and interactive tour, help me tell parts of the story from a uniquely place-based point of view, connecting disparate parts of the story in ways I otherwise couldn’t. The map tour at the end of this story specifically let me map real-world places to my own interpretation of the river, guiding readers through a virtual show-and-tell of the project and river.
Explore Aaron’s portfolio for more maps and stories.

I use various GIS tools for all my Earth Science research, and in this case, ArcGIS StoryMaps was a perfect, user-friendly format to enable anyone to easily explore and interact with the Cliff and the Old Man model.
Matthew Maclay
Matt completed the Old Man of the Mountain in 3D story as a graduate student in the Department of Earth Sciences at Dartmouth College. For the next five months, he’s working as a Research Data Analyst at the Scripps Institution of Oceanography in San Diego, California.
Featured story: Old Man of the Mountain in 3D

Read Matt’s inspiration for the story: When I began my research on bedrock weathering, erosion, and rockfall in the White Mountains of New Hampshire, I quickly discovered what must be one of the most famous rockfalls of all time. Despite falling 20 years ago, the Old Man of the Mountain remains a cultural icon and the official state emblem of New Hampshire. Locals, tourists, visionary thinkers, artists, and even presidents have come to Franconia Notch to view the remarkable silhouette of ‘the great stone face’ for over 150 years.
With the 20th anniversary of the Profile’s collapse in May of 2023, I worked with Brian Fowler and The Old Man of the Mountain Legacy Fund to source some incredible historical imagery, mainly from their Richard F. Hamilton Collection. These photos from unique angles and perspectives enabled the application of digital photogrammetry to recreate the geometry of the Old Man in 3D.
The 3D model is a powerful means of digitally preserving and sharing the Old Man with the public. It also let us estimate for the first time the total mass and volume of granite that fell when the Old Man collapsed.
When sharing my research, I was amazed by how enthusiastic and interested people were about the Old Man of the Mountain; it was a perfect case study and example to explain my research on rockfall. I wanted to create an immersive and interactive experience where users could get a sense of the setting in Franconia Notch, and understand how the cliff is a dynamic place by seeing changes before and after the 2003 collapse. I use various GIS tools for all my Earth Science research, and in this case, ArcGIS StoryMaps was a perfect, user-friendly format to enable anyone to easily explore and interact with the Cliff and the Old Man model.

Maps answer questions, but their best gift is in the nudging toward better questions.
John Nelson
John is a cartographer and UX design expert for Esri’s ArcGIS Living Atlas of the World Team.
Featured story: College football playoff recruiting footprints

Read John’s inspiration for the story: Years ago, when Jim Harbaugh was newly hired as the University of Michigan football head coach, I wondered about the effect his tenure might have on recruiting. Specifically, with all the national coverage around this high-profile hire, I wondered if the recruiting class was likely to broaden, attract athletes from greater distances. How might that change year over year? Is there a likelihood for hometown kids to be more likely to stick it out than those from more homesick-inspiring distances? It was too late for me not to map this.
Once I ask myself a geography-related question, it’s nearly impossible to resist the urge to dive into mapping it. And if the early results are intriguing, which invariably they are (particularly in this case), I am motivated to design the map in earnest because I know I’ll want to show it around. Making is fun, but sharing the result and process is so much more of an adventure. So, like most maps, this one came from a seed of curiosity and then energized with plenty of show-it-to-others-ism.
GIS was really the only way that this story could come about. There is only so much hand-waving and speculating on the spatial effects of hometown proximity, in-state loyalty, raw ambition, and collegiate rivalries that can happen before quantification and visualization (and cartographic conflagration) becomes inevitable. This story is the sort that, yes, has many statistics and visuals, but invites the reader to do their own thinking about the deeper phenomena driving the patterns that appear onscreen. Maps answer questions, but their best gift is in the nudging toward better questions.
Explore more of John’s stories on Adventures in Mapping.

When Pancakes & Silver was named the story of the year by Esri in 2019, I gained confidence as a map librarian and started providing ArcGIS StoryMaps workshops for our students, staff, and faculty.
Andria Olson
Andria Olson is a content specialist on Esri’s StoryMaps team and a former map librarian at Stanford University. She began using ArcGIS StoryMaps to learn more about maps and GIS and to connect with the academic community; this led to a love of distilling complex topics using place-based storytelling. Andria now finds much joy in enabling others to creatively communicate the work that they do.
Featured story: Pancakes & Silver

Read Andria’s inspiration for the story: In 2019, I was a new map librarian at Stanford University, and our annual Western Association of Map Libraries conference was being held in Reno, Nevada, that year. Due to Reno’s proximity to Virginia City, an old mining town, my former supervisor, Julie Sweetkind-Singer, suggested we present together on early mining maps.
As we began taking a closer look at the mining maps in our collections, the complexity of the aboveground and subsurface architecture depicted in the maps was really tickling my brain. With no knowledge of how to actually do it, I wanted to create a digital 3D model from data extracted from the paper maps — naturally.
I’ve always been drawn to the value of storytelling, especially in an academic or scientific setting. As a map librarian, I was eager to explore how I could use that technique to engage with our patrons and collections more meaningfully. Pancakes & Silver was an opportunity to develop my own GIS and place-based storytelling skills while capturing that experience to then teach others — a big thank you to our libraries’ GIS instruction specialist, David Medeiros, for very patiently answering a lot of questions.
And it worked! When Pancakes & Silver was named the story of the year by Esri in 2019, I gained confidence as a map librarian and started providing ArcGIS StoryMaps workshops for our students, staff, and faculty. Everyone I interacted with in those workshops was so excited to have a bit of creative freedom while communicating the work they were doing.
Explore Pancakes & Silver: Mining Maps and Views exhibit at Stanford Libraries online.

This featured storyteller interview was prepared as a part of the November 2023 | Thinking outside the box issue of StoryScape℠.
For more interviews and articles like this one, be sure to check out StoryScape℠, a monthly digital magazine for ArcGIS StoryMaps that explores the world of place-based storytelling — with a new theme every issue.


Commenting is not enabled for this article.