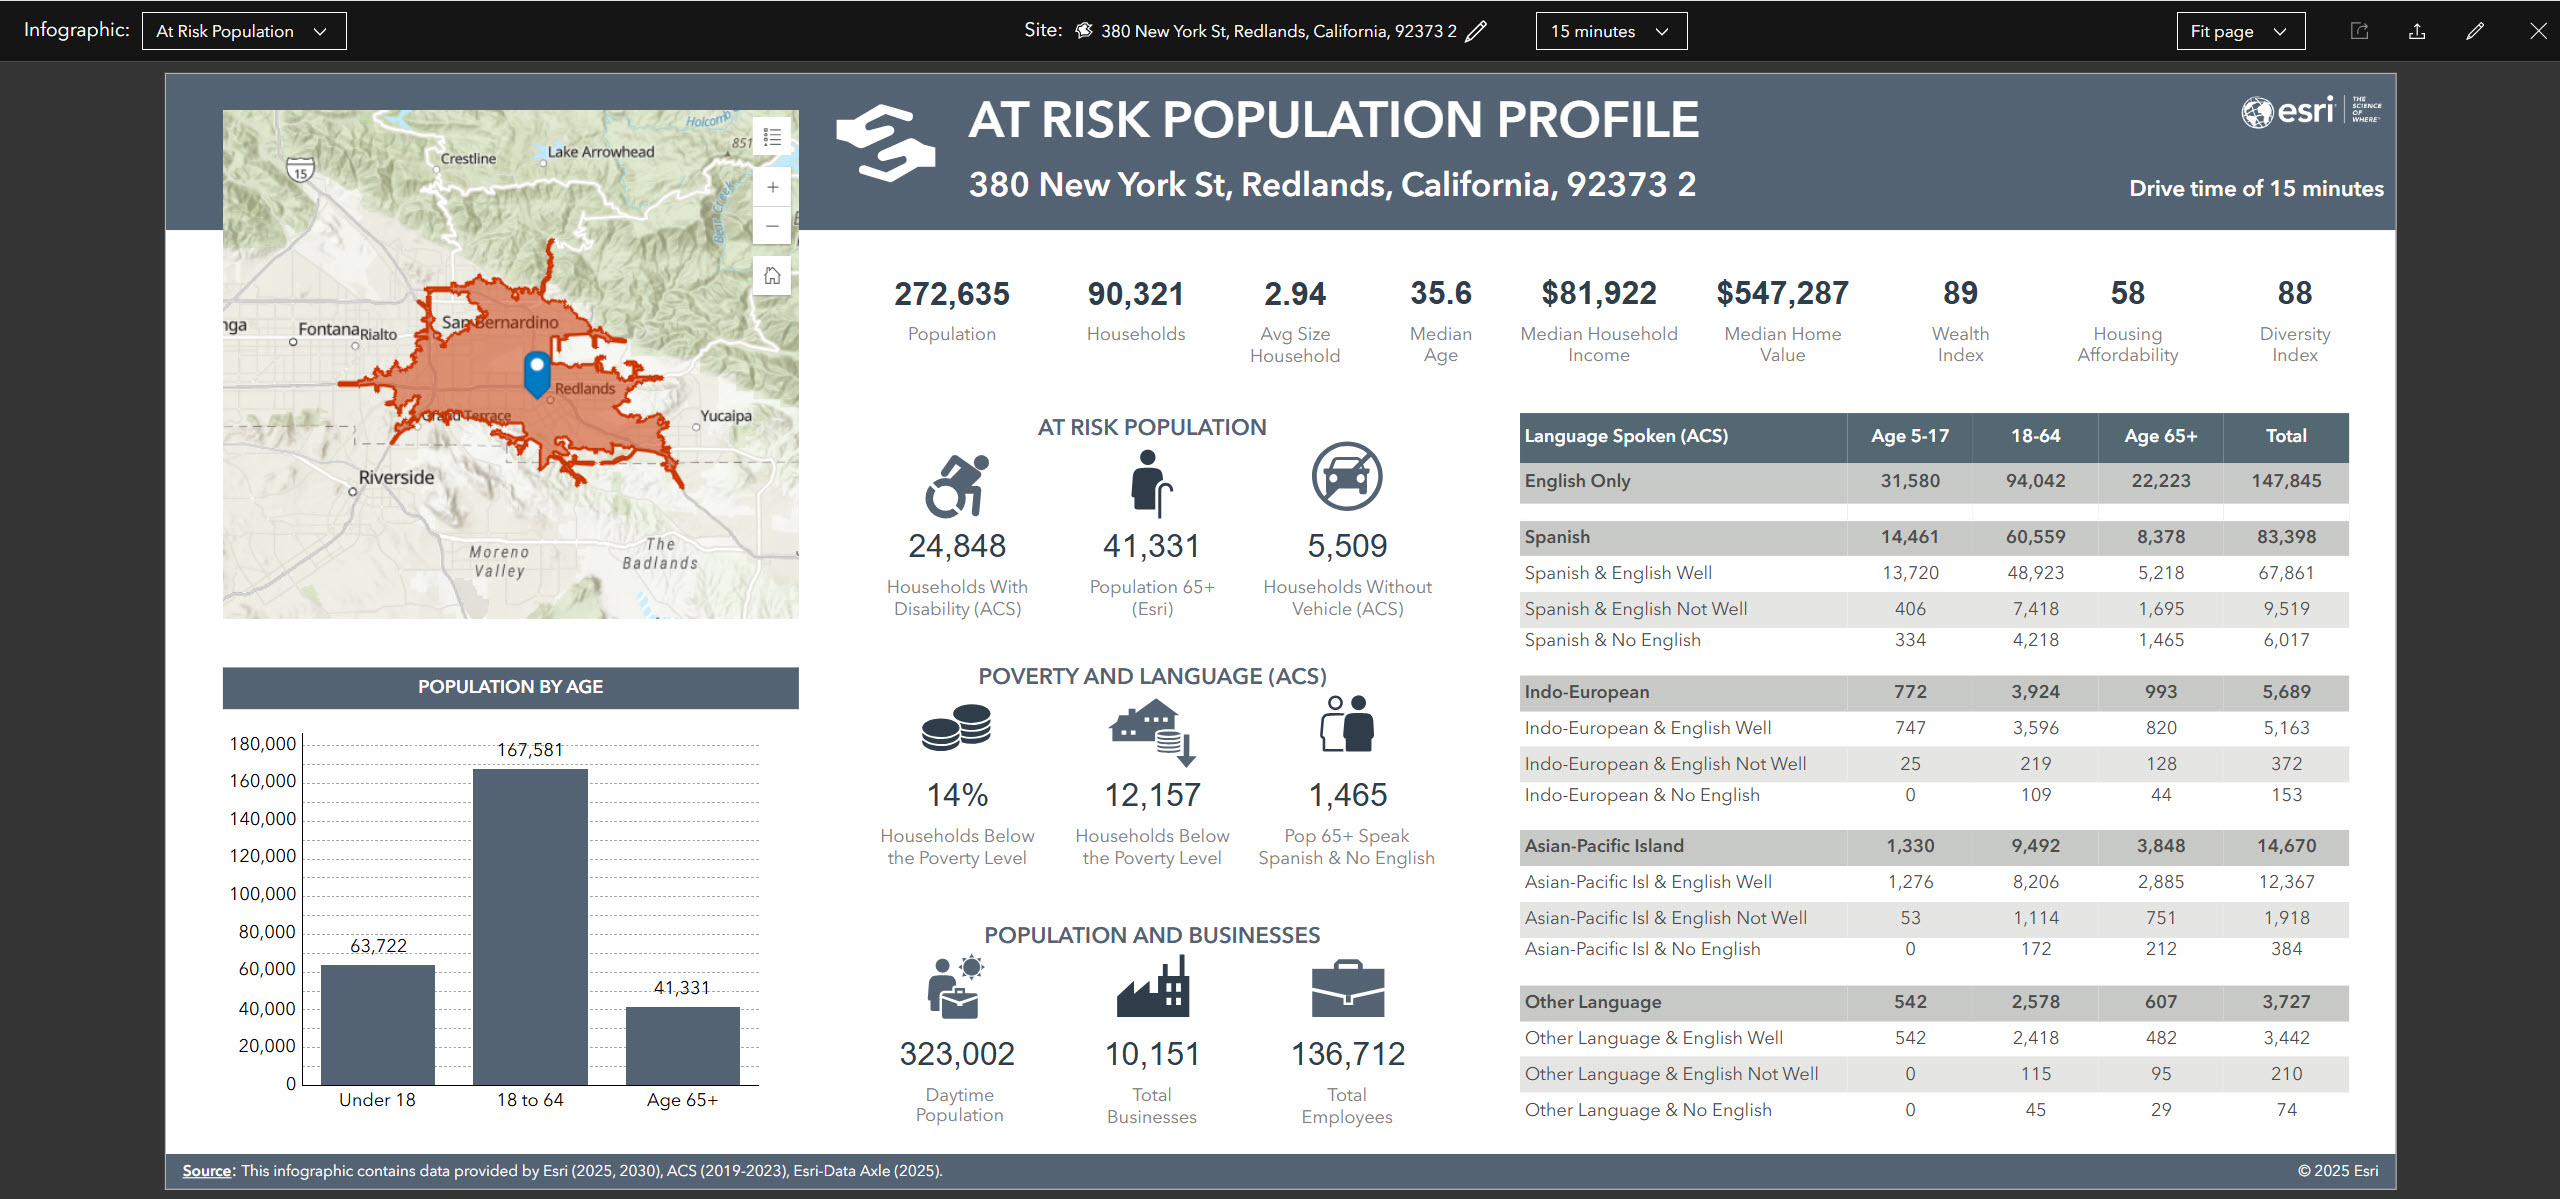
Have you ever wondered how businesses select a business site? Or how government agencies equitably distribute resources within their communities? Well, many organizations, public and private are leveraging the power of location intelligence by overlaying demographic, lifestyle, and spending data. ArcGIS Business Analyst helps users identify underperforming markets, find where your target customers live, and share this analysis via ready to use infographics.
In the third blog of the Esri Expert Voices series, Garry Burgess, Esri Product Development Director for ArcGIS Business Analyst shares insights into Esri’s demographic mapping software. Let’s dive in.

1. Could you please introduce yourself and explain your role at Esri? When did you join the team, and how has your role evolved over time?
My name is Garry Burgess and I am a Product Development Director at Esri and I lead the ArcGIS Business Analyst team. ArcGIS Business Analyst is Esri’s location-based market and community intelligence software that combines demographic, business, lifestyle, spending, and census data with map-based analytics for smart decision-making.
I have worked at Esri for 25 years and throughout my time at Esri, the GIS and software industries have evolved significantly. When I first joined Esri, we used to deliver ArcGIS Business Analyst software and content once a year. We have moved from delivering software in–a–box once a year to constantly evolving the delivery of continuous updates in desktop, enterprise and cloud-GIS software.
2. Esri is known for delivering world-class services, including the integration of multiple data sources and a rigorous vetting process for authoritative data. In your opinion, what sets Esri’s data products and location services apart from those offered by other companies?
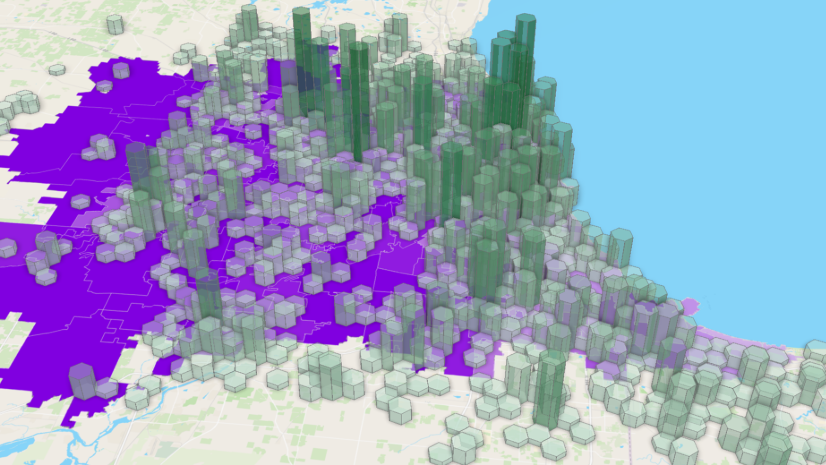
The breadth and depth of data available in Esri software sets us apart from other companies. Esri offers a wide range of data spanning various categories, including demographics (population, age, race, income), and business and behavioral (consumer spending habits, lifestyle and neighborhood segmentation). Esri data is available on a global and national scale and even down to smaller neighborhoods and city blocks. The size and scale of this data is enormous!
This content is well integrated in Esri software and joined to the latest geographic administrative and statistical boundaries. This seamless integration of content makes it easy to work with demographic data in ArcGIS.
Esri also has a wide selection of GIS tools that can be used to visualize and analyze this data. ArcGIS Business Analyst is a key tool that provides seamless integration with Esri’s demographic data. One of the key advantages of ArcGIS Business Analyst is that it comes with an extensive catalog of ready-to-use data that you can use to make maps, create reports and execute analysis.
The ArcGIS Business Analyst web app (standard) was recently included with the Creator User Type and above. This means thousands of users now have access to ArcGIS Business Analyst to explore and use thousands of demographic attributes for many countries. I am really excited that the reach of ArcGIS Business Analyst is going to expand to so many new users.
3. Products, such as basemaps, geocoding, and routing services are regularly updated. How do you and your team manage the influx of new data and ensure its integration into the services?
This is an ongoing challenge that our team continues to work on and improve. We have developed a series of automated pipelines that ingest, process, test and deploy data as it becomes available. Because we are integrating data from so many different countries and sources, keeping this content updated in a timely manner is one of our fundamental goals.
Keeping demographic data updated for so many countries requires an enormous amount of effort. The scale of the demographic data that Esri provides is massive. Data is available on a global scale and down to smaller neighborhoods and city blocks for 177 countries. We are able to leverage modern cloud-computing and data science techniques to process massive amounts of data in timelines that would have seemed inconceivable several years ago. Ultimately, this means that we can expand the breadth of data for our users and keep that data updated rapidly.
4. How do you ensure the accuracy of the data products and location services you create?
High-quality software and content development hinges on a multifaceted approach. Our team employs an agile development methodology where rigorous testing is integrated in every step. We do this by leveraging test automation and fostering a culture of making sure we always deliver high quality data, software and services. We have developed a comprehensive testing framework that ensures data is accurate. This testing framework and holistic testing is spearheaded by a dedicated team of professionals, including data scientists, demographers, geographers and software developers.
Our agile approach also allows us to rapidly triage and resolve any issues that are found during internal testing or problems identified by our users. We are able to hotfix issues rapidly.
5. How crucial is high-quality data in the development and provision of location services?
The quality of our data is of paramount importance for Esri. We understand that poor data will ultimately lead to poor decisions by our users. The process of delivering data to our users requires meticulous research, creation, processing, and testing to ensure accuracy. Our users rely on Esri’s data to gain a more detailed understanding of their communities. Without trust in the accuracy of our data, our users would not have faith in the results of their analysis.
6. What advice would you give to users or organizations when searching for or working with location data?
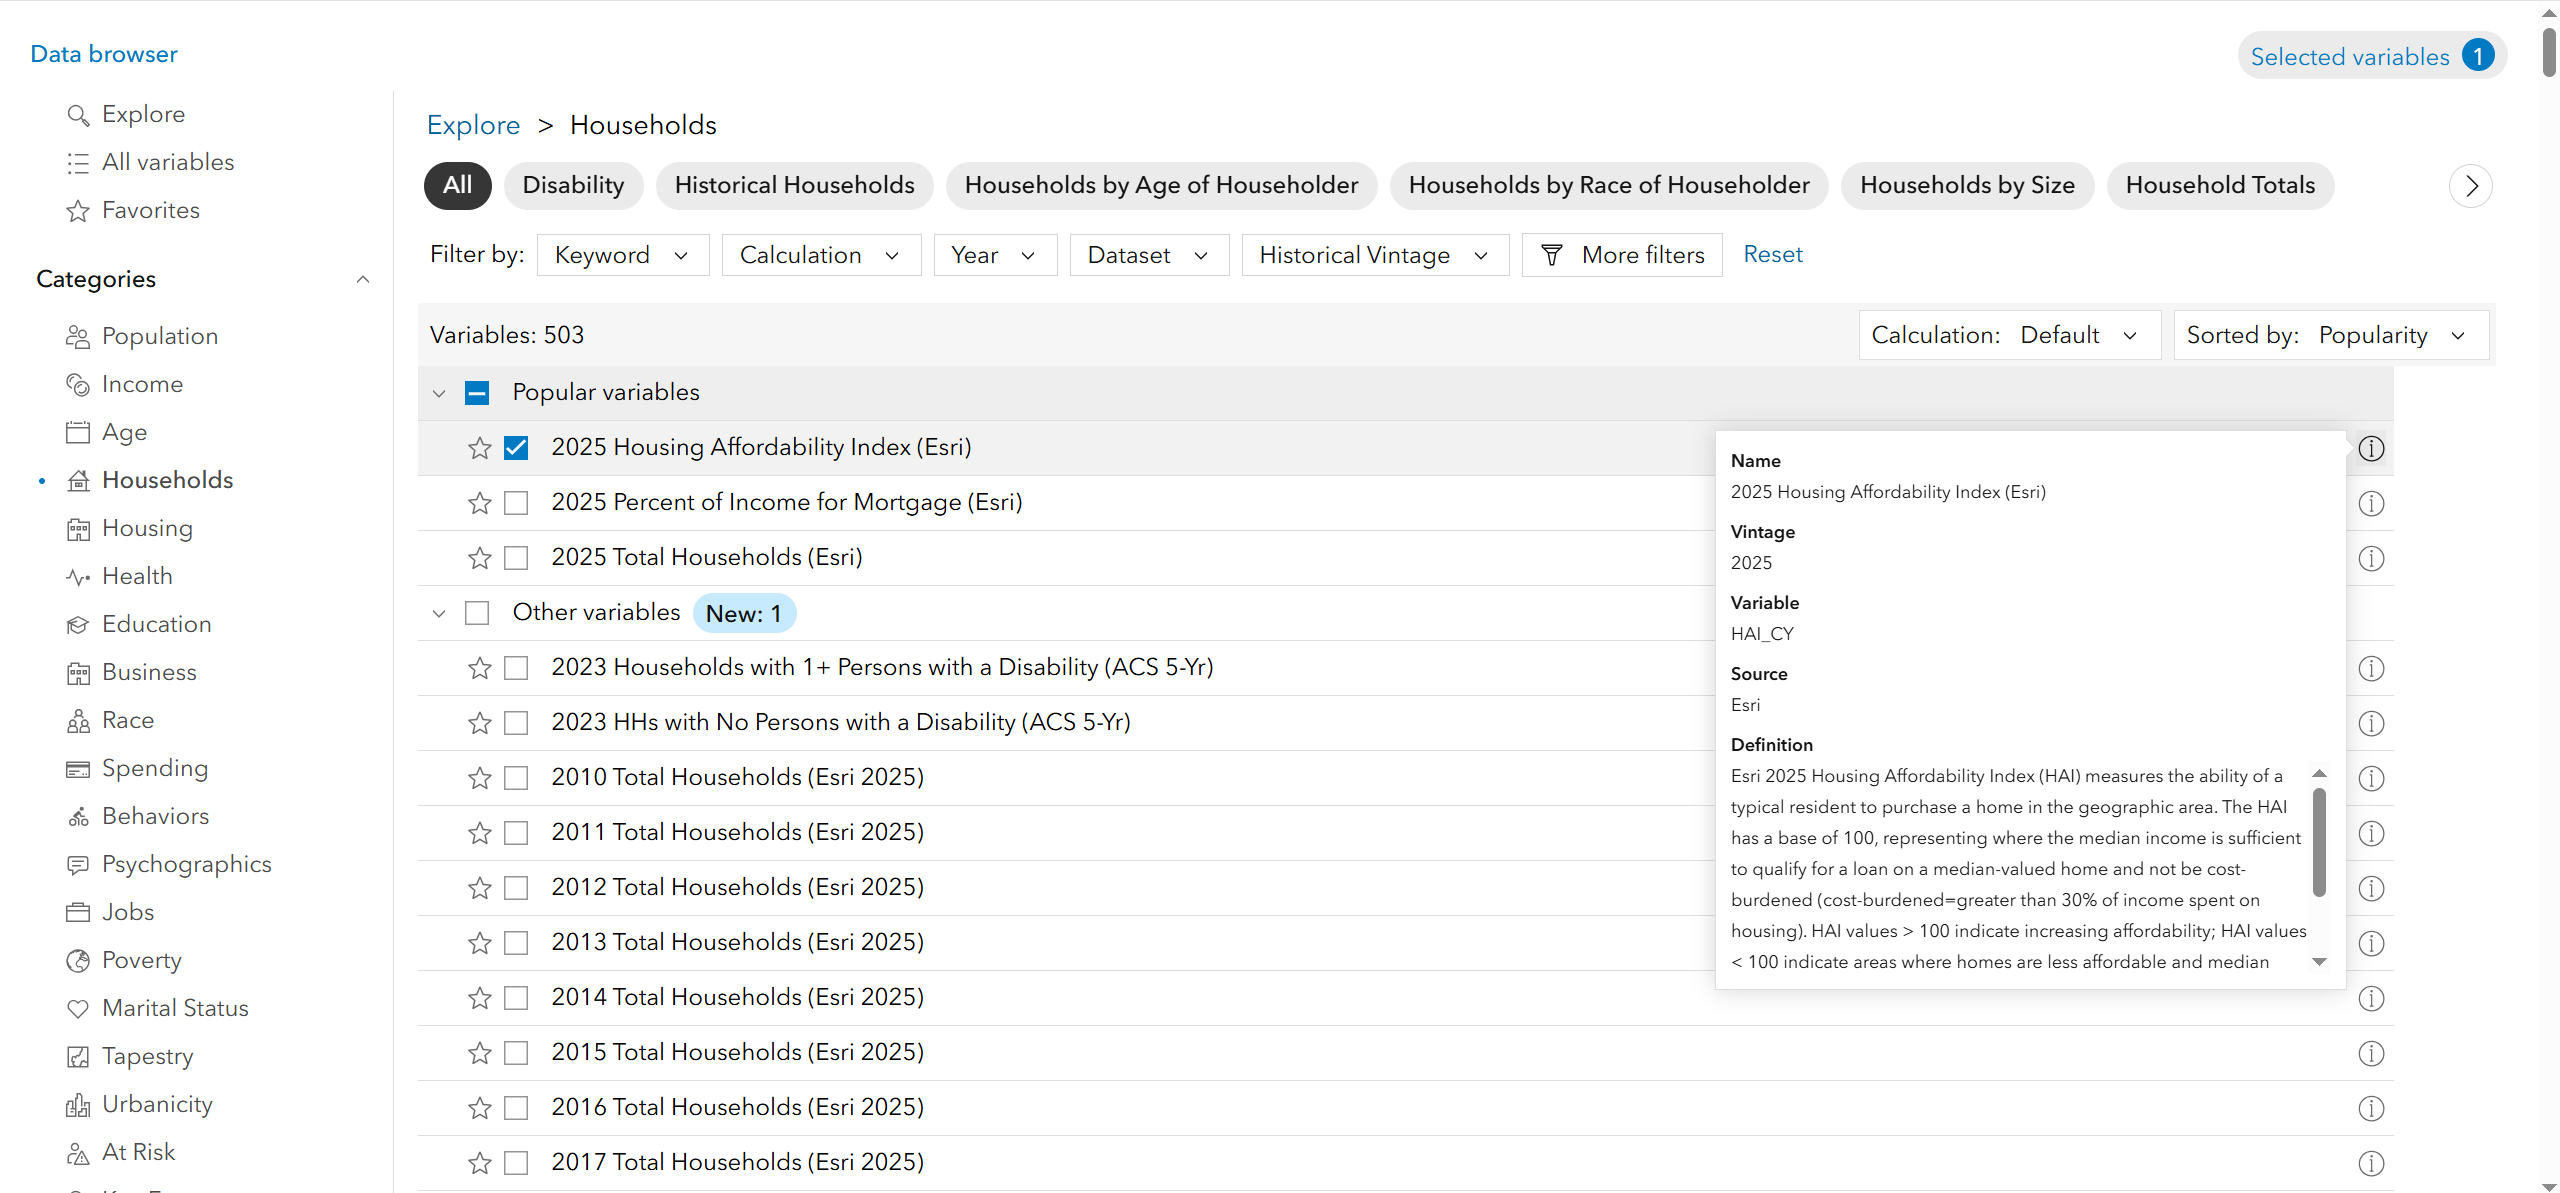
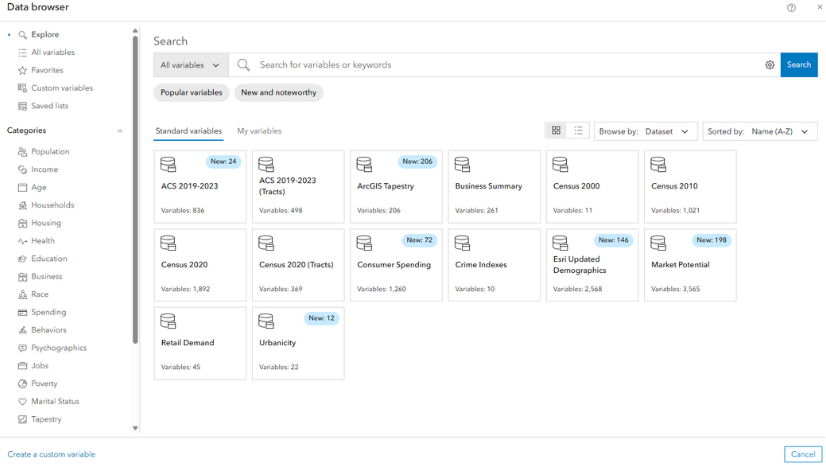
I would encourage users to leverage the new data browser in our data documentation which is also integrated into ArcGIS Business Analyst to understand what demographic data is available. We recently updated our data browser to provide new capabilities to search and browse for data seamlessly. We also added a new section for “New and noteworthy” data that highlights recent additions to our demographic data and added a long definition and link to related documentation for each variable.
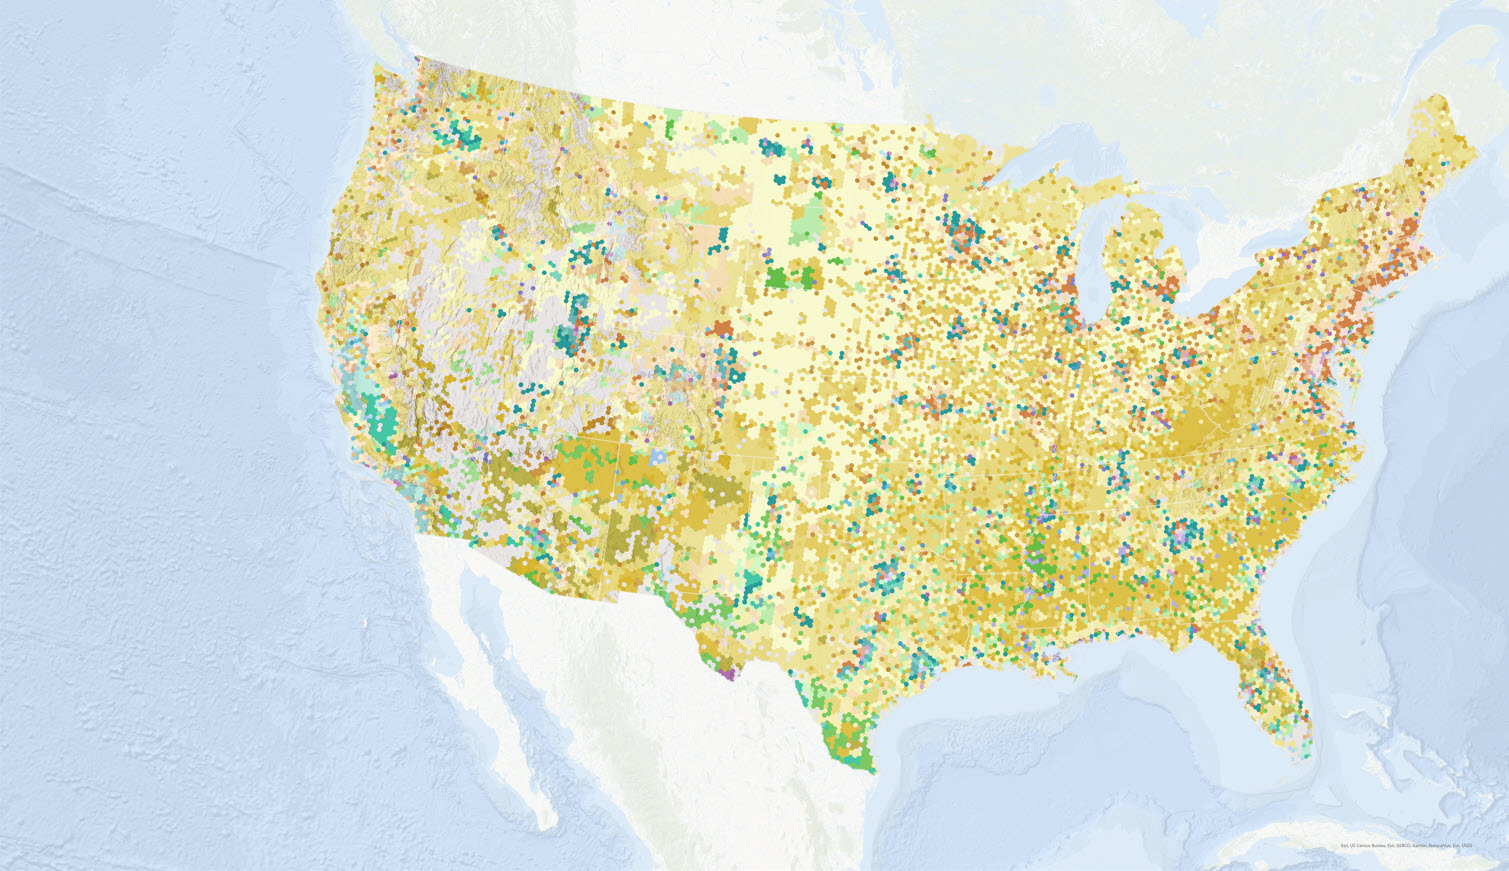
Esri also provides a wealth of support materials so that our users can better understand the data available in ArcGIS. I would encourage our users to read the many blog articles that our team has created to gain a more detailed understanding of the content that is available in Esri software. As an example, we recently created a blog series on the third generation of ArcGIS Tapestry data that was recently updated.
7. Throughout your experience working with global data, what has been the most surprising discovery you’ve made?
I am constantly amazed at what our users are able to do with our data and software. We have users that are working on problems at the neighborhood or even down to the individual household level. We also work with organizations that are working on regional and global issues that span country borders. The scale and the size of the problems they are working on are vastly different, but the desire for accurate and robust data that underpins their analysis is the same. I have been surprised that there are such common needs for data and related capabilities that span so many industries and organizations.
8. What motivates you and your team to continuously strive for excellence in your work?
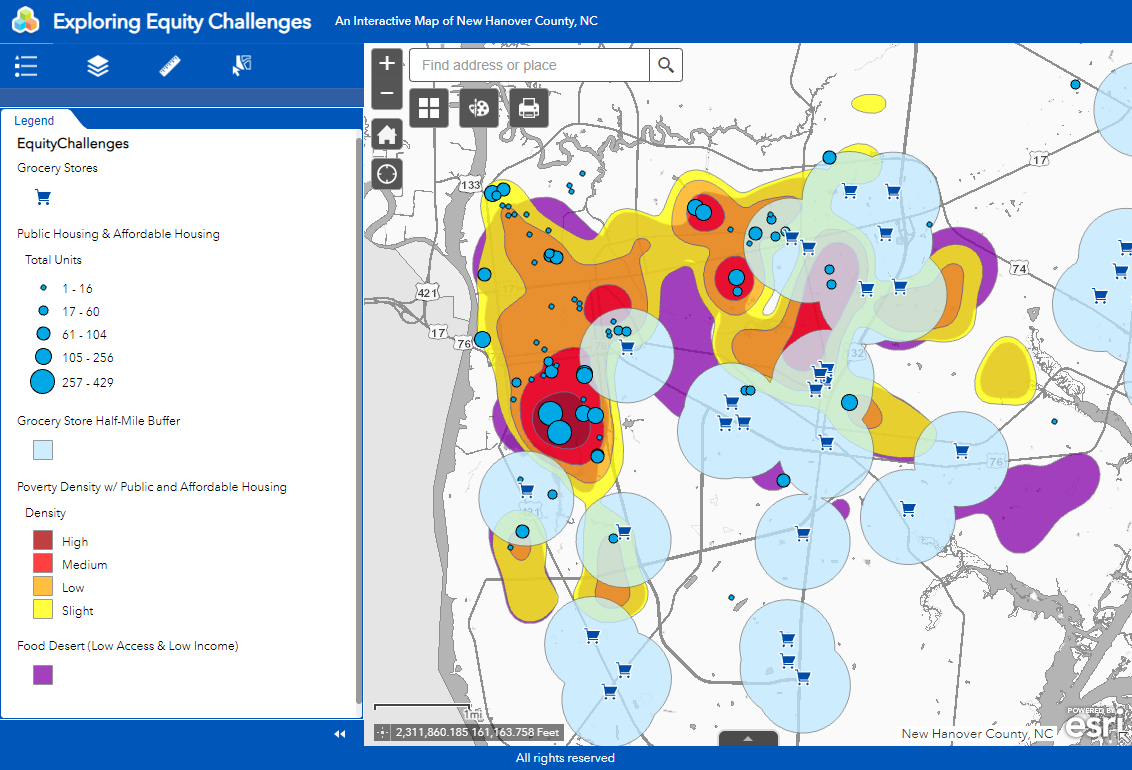
One of the main reasons I love working for Esri is how user centric our organization is. We strive to develop world-class data and software to help our users address their challenges. Challenges like disaster response and social and economic inequality are interrelated and inherently tied to issues of geography. A science-based, geographic approach helps our users understand these interconnected problems holistically by integrating all kinds of data. The mission of our team is to provide data, software and services to empower our users to make smarter decisions.
8. Can you share any updates or improvements that you and your team are currently working on or planning to make in the near future to enhance the quality and functionality of your data and location services?
Each year, I get the opportunity to talk to many of our users in San Diego at our User Conference. They share some success stories of how they are able to use GIS to solve their problems. I am always impressed at what our users are able to accomplish with our data and tools. They also share current challenges and in some cases frustrations with limitations in our software and content. These conversations help us shape the direction of our product development. Some of the areas we are working on are to include some new techniques to understand the relationship of different data sets. For example, are the demographic variables used in your analysis highly correlated? We also want to provide new tools and techniques to better leverage proximity metrics throughout Business Analyst. For example, utilize the distance to the closest park, school and community center in an analysis.
Get Started Today
ArcGIS Business Analyst is not only a mapping product but a product that combines demographic, business, lifestyle, spending, and census data to enhance a user’s decision making. Leveraging Esri’s mapping software and extensive data sets allow you to truly understand the communities you serve. The Esri team is committed to ensuring its users have access to the best tools and services and as Garry mentioned is always improving the product based on user feedback.
If you would like to apply data driven decisions to your organization sign up for a free 21-day trial.


Article Discussion: