The first ArcGIS Business Analyst release of 2026 is here and there’s a lot to be excited about. The ArcGIS Business Analyst Web App February 2026 release introduces a redesigned search experience to find addresses, geographies, and places, new story layouts, enhanced points of interest search, more accessible infographics, new infographic templates, and refreshed data for demographics, places, business summaries, crime, and traffic.
ArcGIS Business Analyst is Esri’s location-based market intelligence application designed to help you make smarter decisions for market planning, site selection, and customer segmentation. As of June 2025, any ArcGIS Online user with a Creator user type or above has access to ArcGIS Business Analyst Web App Standard included with their license and can launch the app from the app switcher to get started with ArcGIS Business Analyst.
If you’d like to learn more or want to try ArcGIS Business Analyst Web App, sign up for a 21-day free trial.
Highlights of this release include:
- Redesigned search experience
- Smarter points of interest search
- Updated share to a story workflow
- New infographic templates
- Additional infographic improvements
- Infographic accessibility improvements
- Modernized reports
- Credit estimation enhancements
- Other enhancements
- Data and boundaries updates
- Esri Tapestry Segmentation retirement
- SIC Codes Transition to NAICS Codes
- ArcGIS Community Analyst retirement
- Additional resources
Redesigned search experience
The core of any analysis begins with finding the right location. In this update, we have completely reimagined the location search tool to provide a more intuitive and efficient experience.
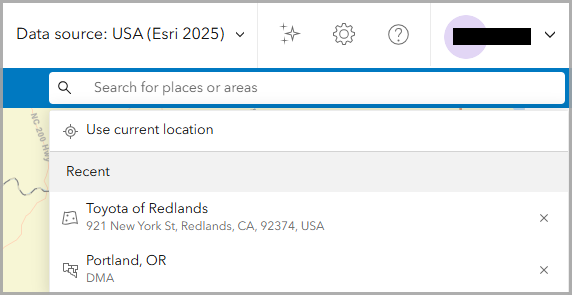
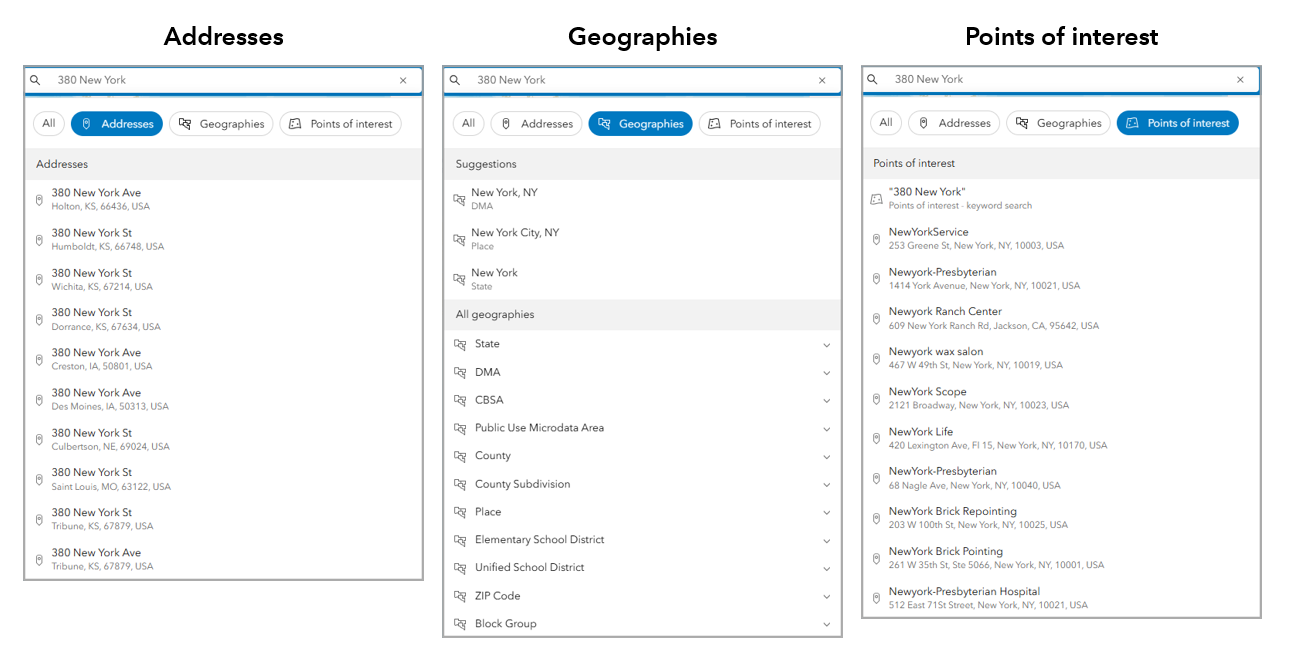
Now users can search for addresses, standard geographies, and points of interest in one streamlined search. Enter your search terms, use your current location, or select a recently searched location.
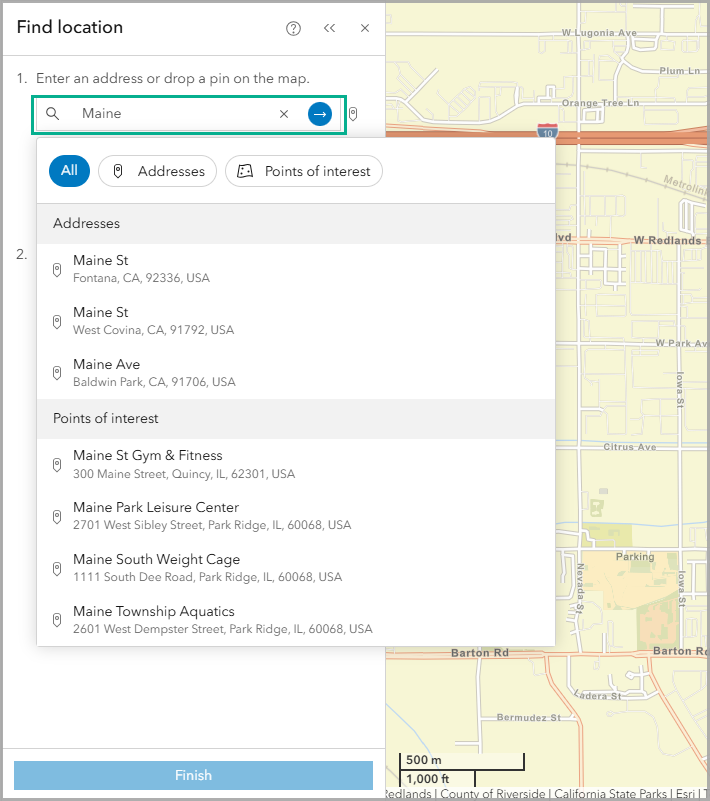
You will notice the updated search design is also applied to the find location and create threshold area workflows. This unified search bar eliminates the need to manually toggle through drop-down menus to select a search type, saving you time in your analysis. The new system organizes results into clear, distinct groups, allowing you to identify and select the correct locations at a glance.
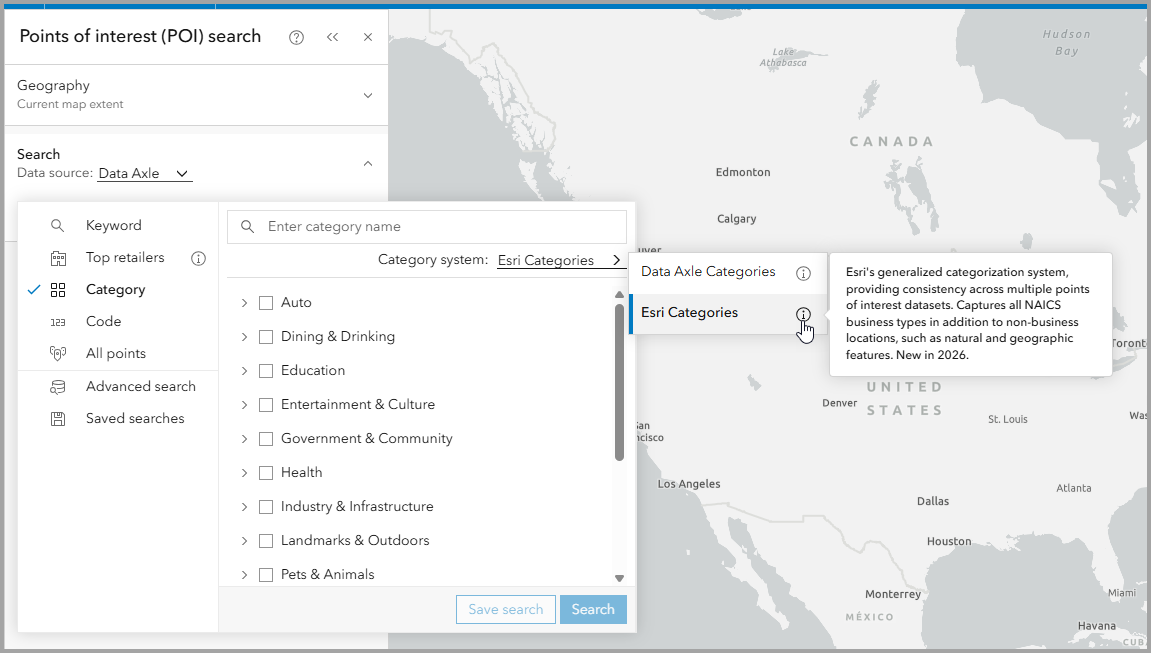
Smarter points of interest search for clearer results
Updates to the points of interest (POI) search workflow provide clearer consistency and precision with the introduction of the Esri Categories system. Esri Categories is a proprietary classification system that standardizes POI category searches across the Data Axle, SafeGraph, and Foursquare data sources, combining the search results into a single consistent system. This means you can use the same POI categories and saved searches across different data sources, allowing you to find relevant businesses, facilities, and services quickly and accurately.
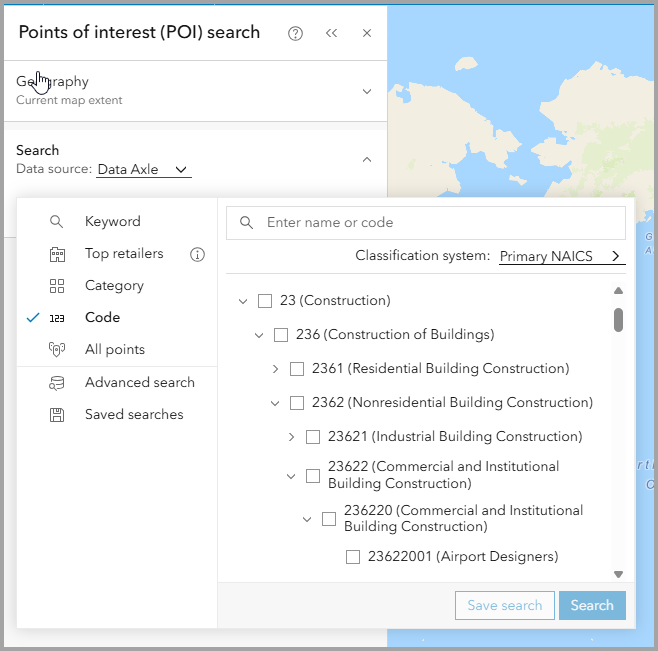
Navigating to specific industries is also easier now with an expandable code hierarchy in the code search tab. Easily expand and collapse check boxes in your search and drill down into subcategories for improved results.
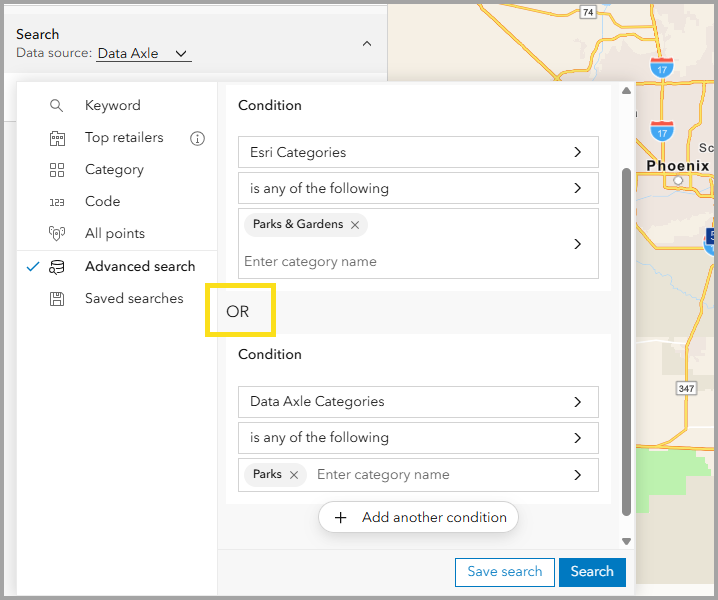
Previously, the use of the OR operator when combining conditions based on categories was restricted. Now, there is added support for advanced “OR” search logic, making it possible to combine multiple categories into one complex search query. Start with a condition using categories and then add a second condition. And don’t miss the option for “Any of the following are true” to further segment your analysis conditions.
Places icons are curated icons that provide quick visual identification for the types of places represented on the map. Places icons are now the default style used for improved interpretation.
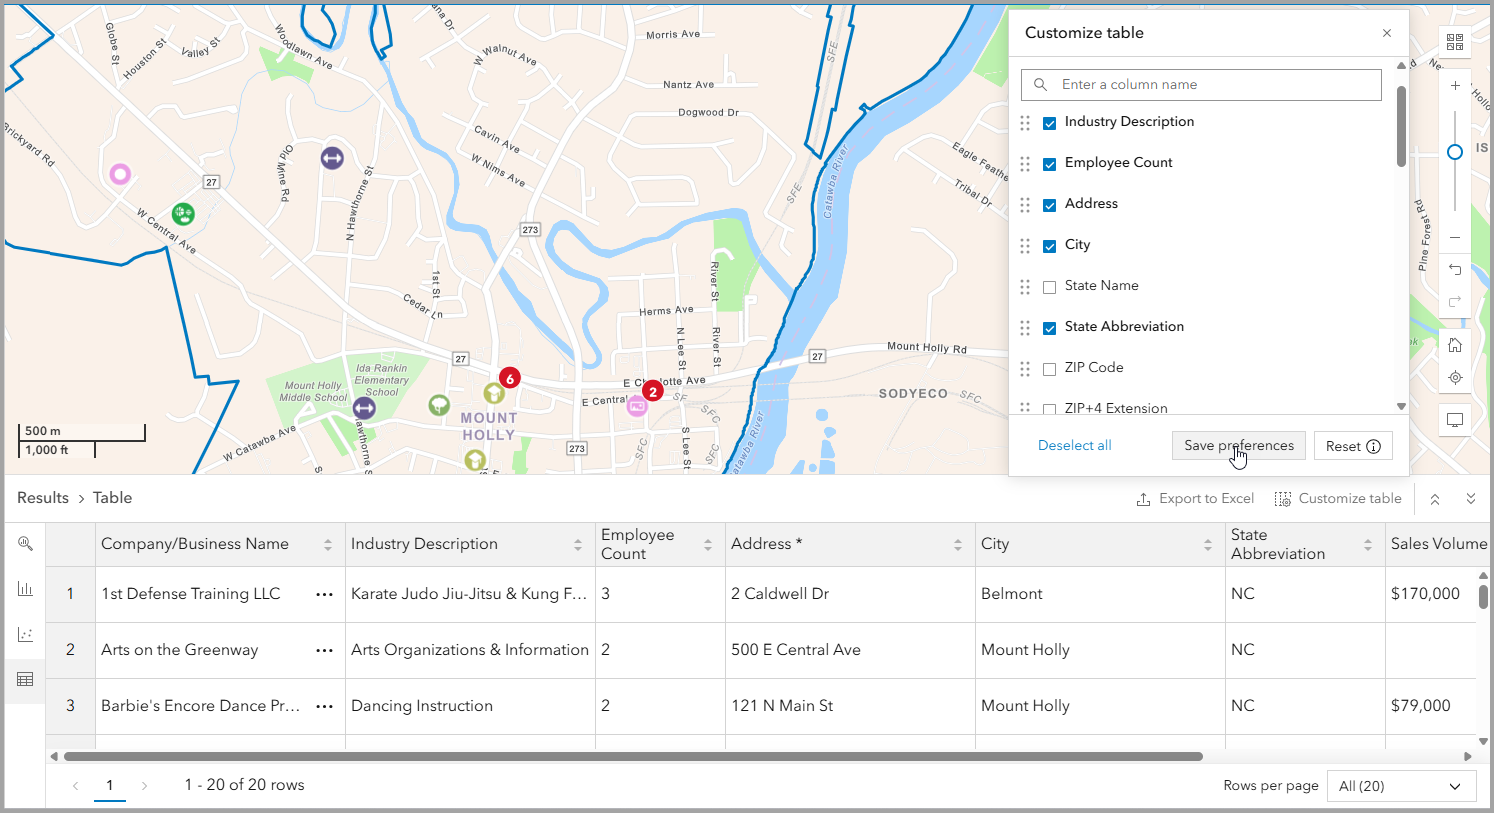
Experience total control over your POI results! Table preferences can be configured and saved, and fields are customizable for each data source under the table customization options. A reset button has also been added to quickly revert to the default settings.
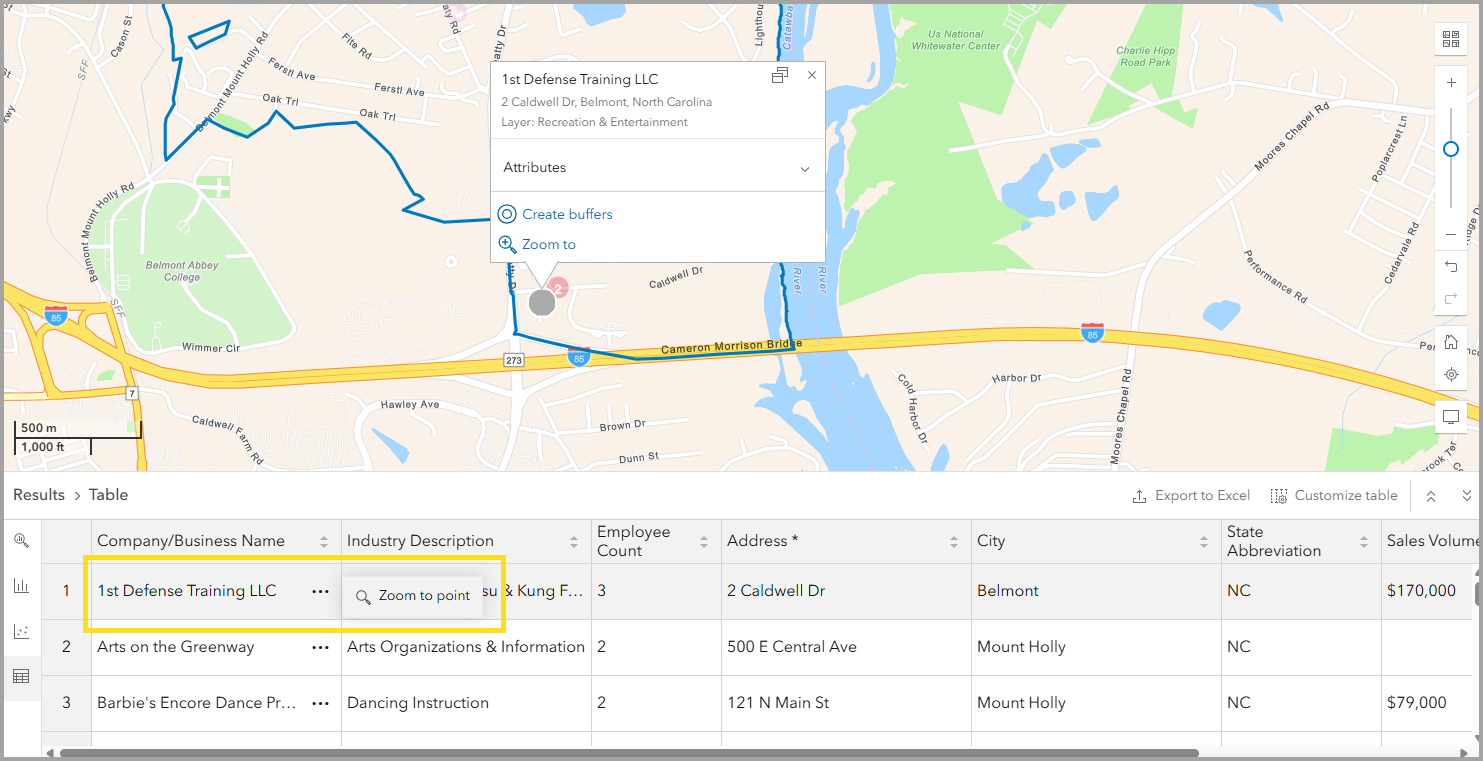
The Results pane now offers a greater level of detail. A new option in the Table tab helps you locate points of interest more easily on the map by providing the option to zoom to a point.
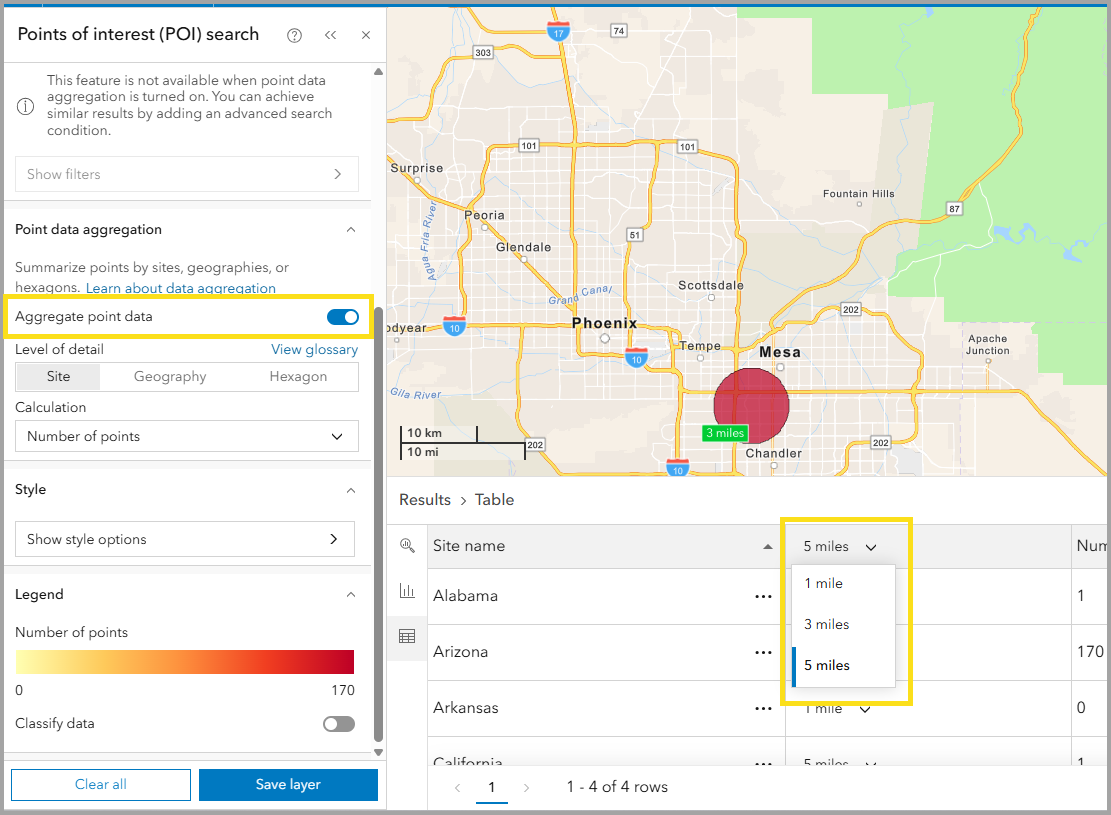
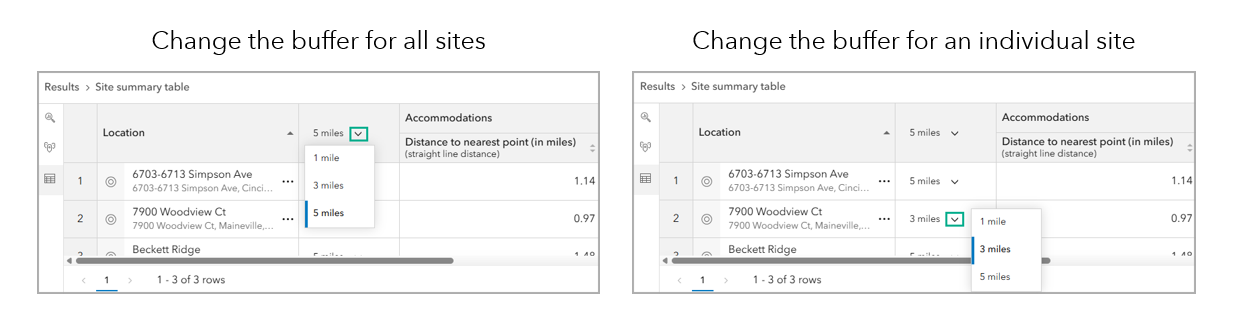
When using the Aggregate point data option with multi-buffer sites, you will now see a switcher column added to the table tab, enabling custom buffer selection. You can change the buffer size for individual sites or use the column header to switch the buffer for all sites.
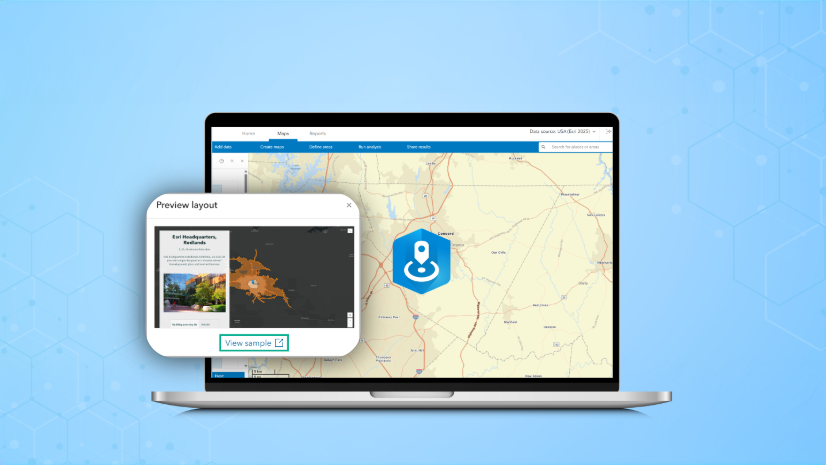
Updated share to a story workflow: More layouts, more impact
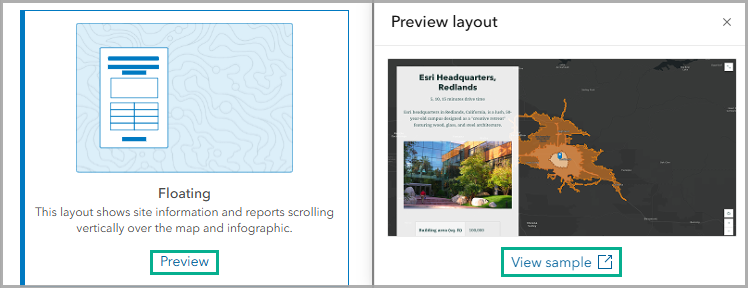
Sharing your sites, maps, infographics, and reports to an ArcGIS StoryMaps story just got more creative. Explore new floating, docked, and slideshow layout options in the Create a story workflow.
Experience three new layouts in addition to the Classic layout for sharing to a story:
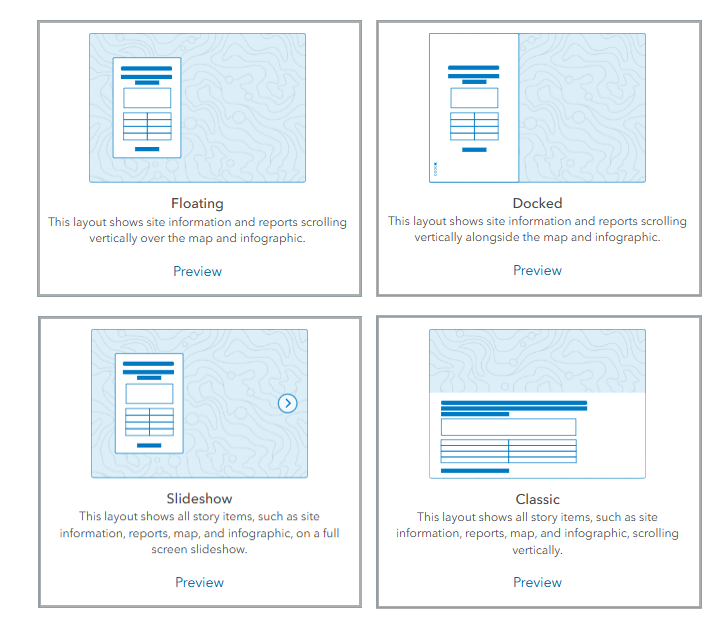
You can click preview to view a thumbnail of your layout option. Or, if you want a more immersive preview, simply click view sample to open the preview in a new full-screen tab. Easily visualize the layout options and select the one that best suits your story.
New infographic templates
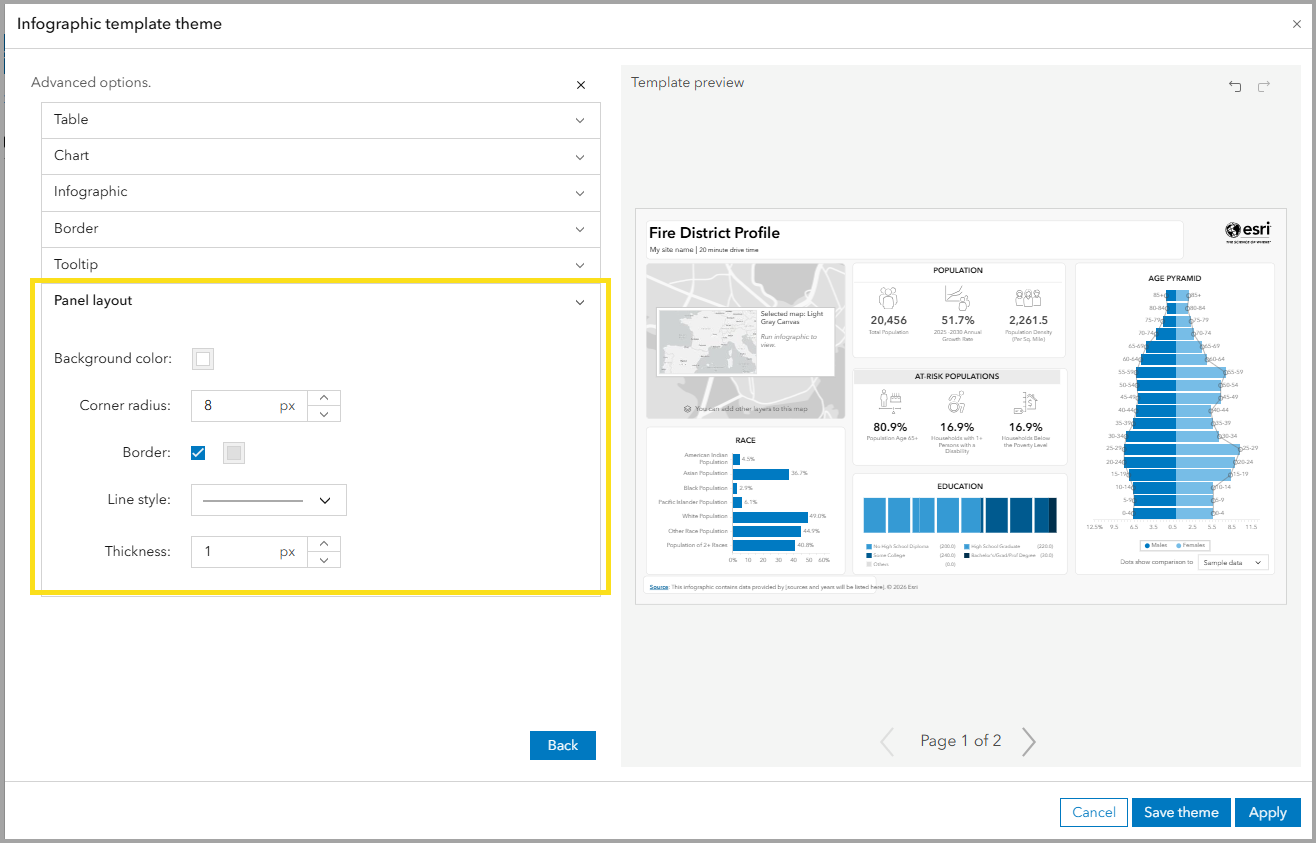
Fire District Profile
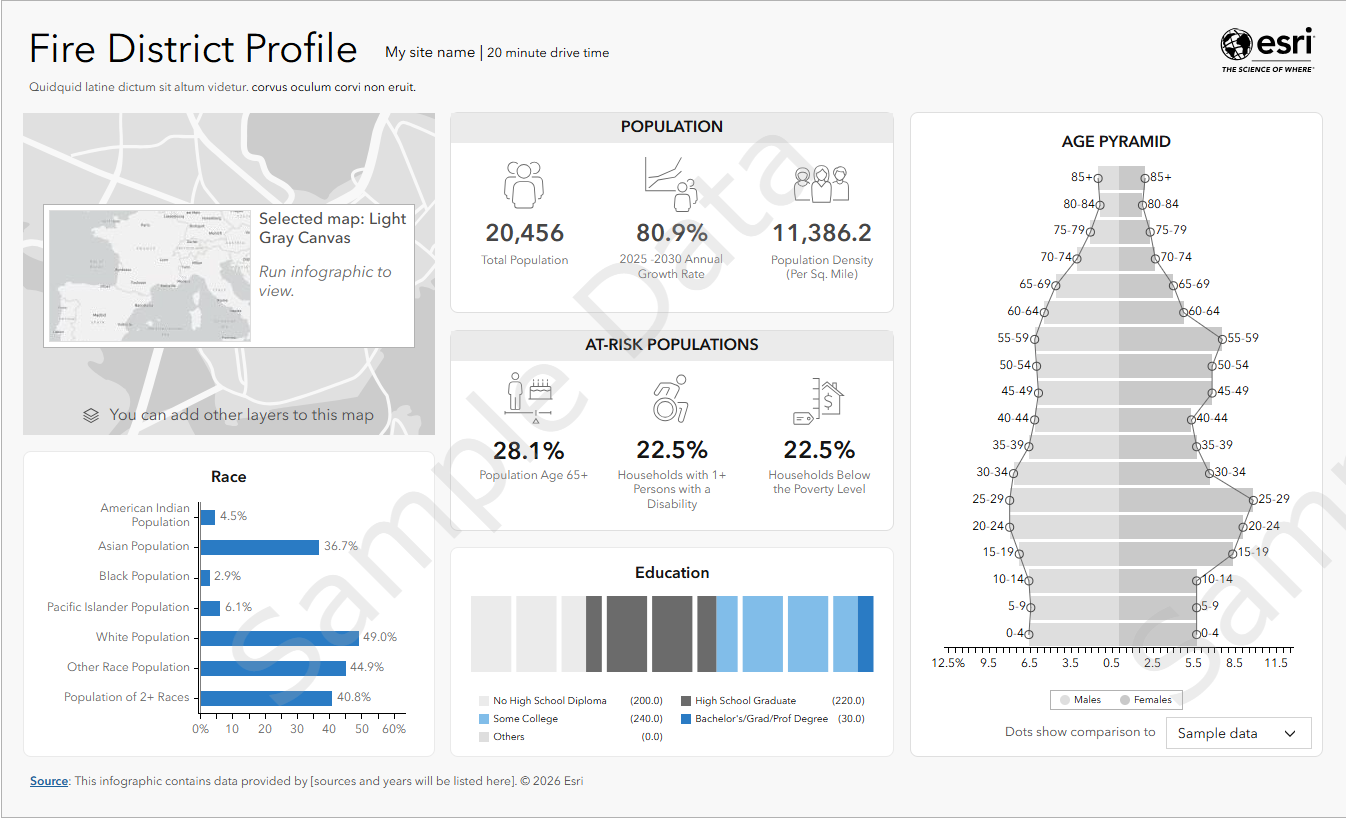
Fire District Profile is a new two-page Standard infographic template available in the United States. This infographic has a great use case for local emergency service planning in the event of fires. It provides a comprehensive overview of at-risk populations and housing for natural disaster planning. Variables included in the template present information on at-risk population, age, housing information, and high-risk occupancies. It contains demographic and/or points of interest data provided by Esri, Data Axle, and the U.S. Census Bureau from the Esri Updated Demographics, ArcGIS Places, and American Community Survey datasets.
Community Risk Profile
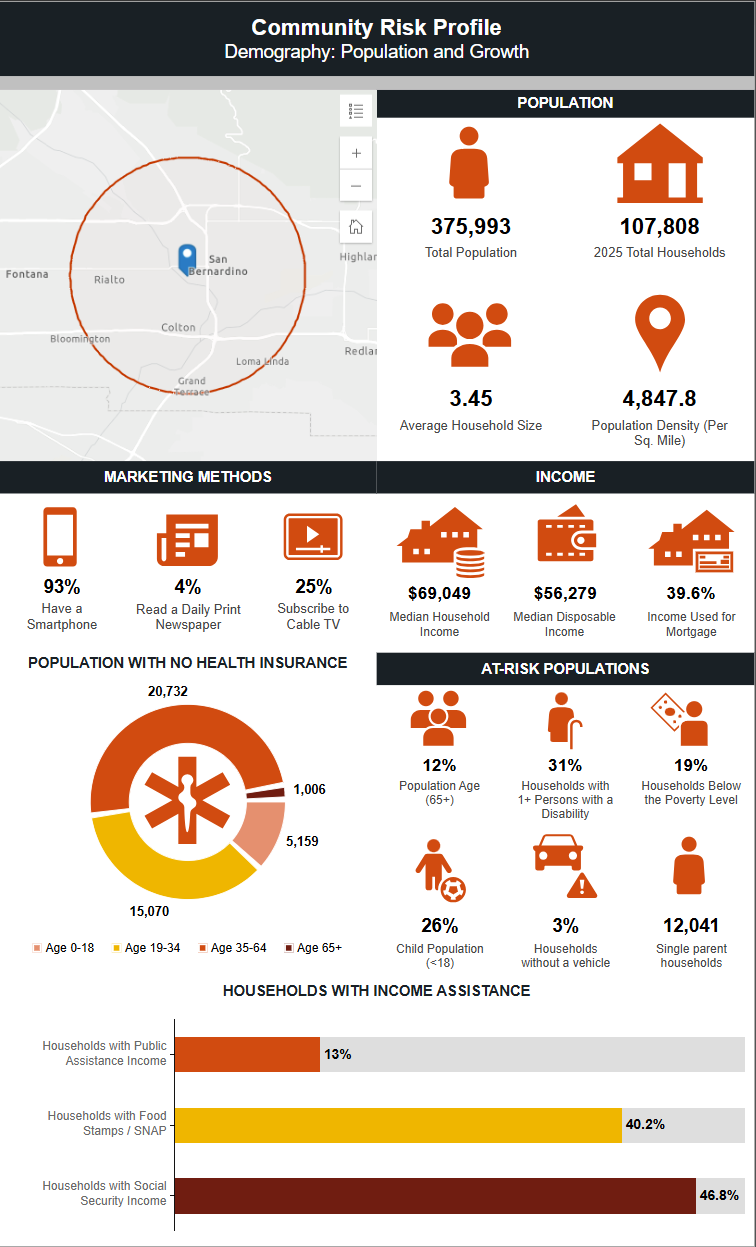
Community Risk Profile is a three-page Standard infographic template that provides an overview of a community’s risk in the event of natural disasters. This infographic is valuable for local governments assessing the risk level of their communities as it presents information on at-risk populations, how people receive news, income, health insurance, households with income assistance, age, language spoken, and housing. It contains demographic and/or points of interest data provided by Esri, Data Axle, and the U.S. Census Bureau from the Esri Updated Demographics, ArcGIS Places, and American Community Survey datasets
Tapestry Poster
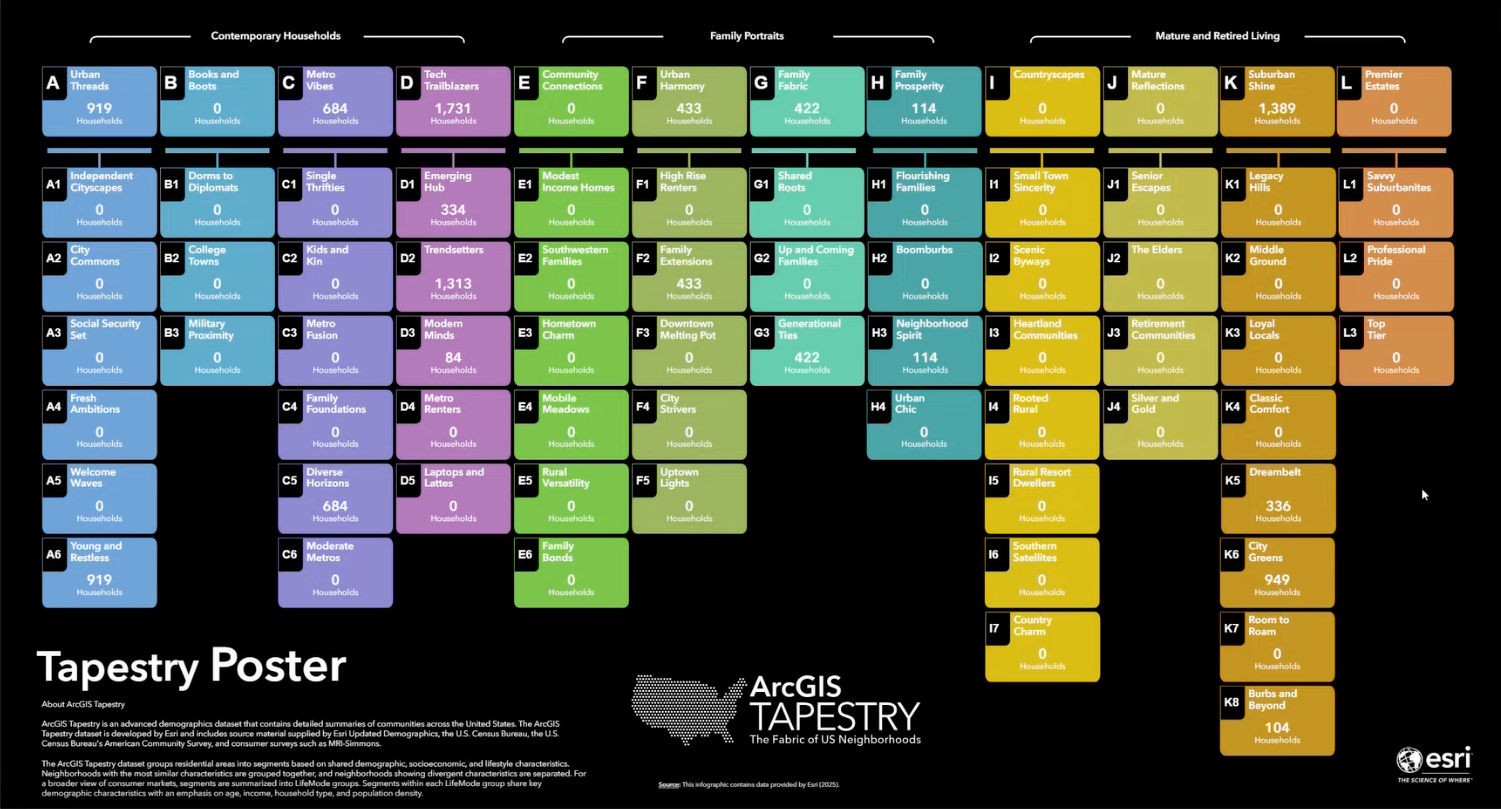
The ArcGIS Tapestry poster is a new template added to the Gallery using United States Esri Tapestry segments will be interactive to display details of each life-mode group.
Additionally, many infographic templates are now availble for use internationally and have been localized for additional languages. Several infographics have been moved from Standard to Gallery. See the table below for more details:
| Data Source | Type | Infographic |
| Esri 2025 | Gallery |
|
| Esri Japan | Standard |
|
| Germany NEXIGA | Standard |
|
| Türkiye | Standard |
|
| Iceland (Esri & Michael Bauer Research) | Standard |
|
| Luxembourg (Esri & Michael Bauer Research) | Standard |
|
| Malta (Esri & Michael Bauer Research) | Standard |
|
| Albania (Esri & Michael Bauer Research) | Standard |
|
| Moldova (Esri & Michael Bauer Research) | Standard |
|
Additional infographic improvements
The infographic editing and saving experience is now streamlined. The infographic builder offers greater precision and flexibility with expanded theme layouts, more controls for gauge charts, Tapestry panels, tables, and comparison tables. Additionally, infographic names are now more consistent when you export into PDFs.
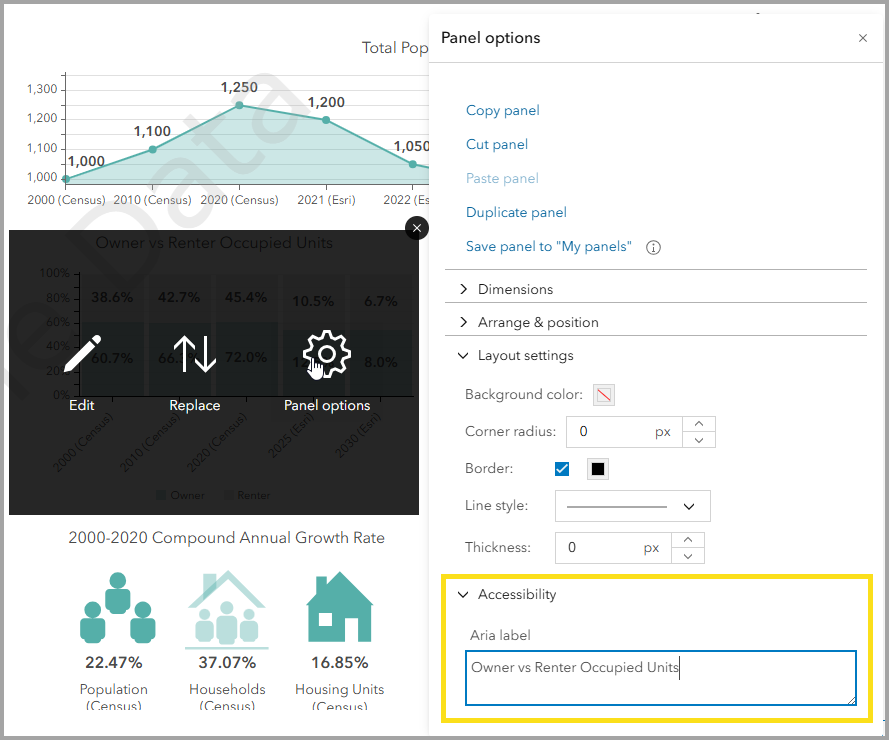
Accessible infographics for all
We have improved keyboard access and screen-reader support, specifically for complex elements like charts and grouped panels. Standard infographic design now complies with WCAG 2.1 Level AA accessibility standards, making data more accessible to all users. Not only have we made efforts to improve accessibility in the infographic player and Standard templates, but new settings, like Aria labels, are added so your template designs meet Accessibility compliance.
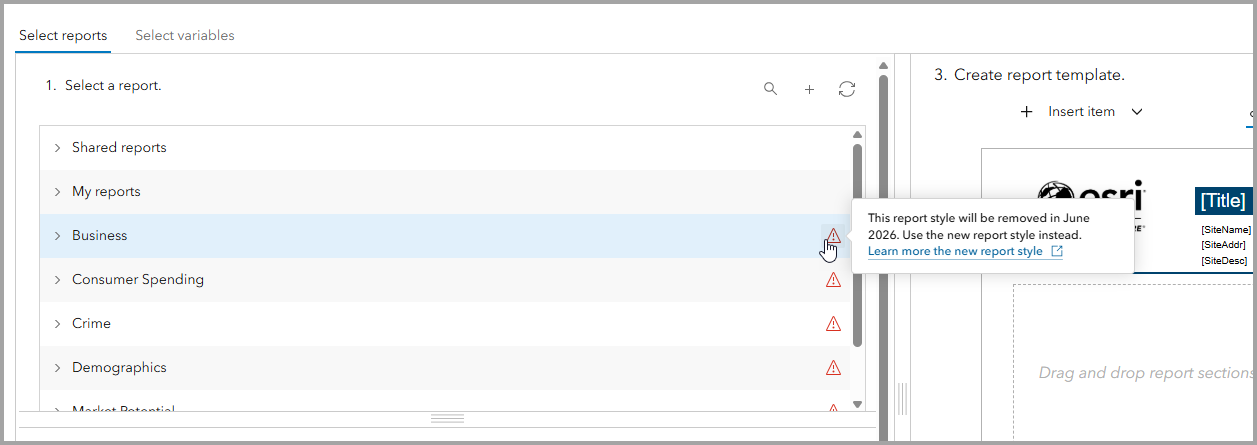
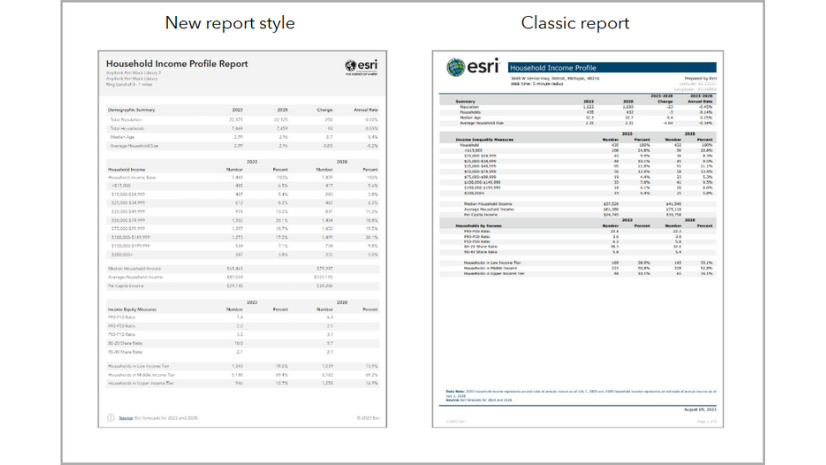
Modernized reports: A new era for insights
You may recall that in the February 2025 release of ArcGIS Business Analyst Web App, we rolled out a new report style. In June 2026, the Classic Esri Report style will be removed in favor of this more polished reporting experience. Working with the new report style offers presentation-ready designs and accessibility out of the box.
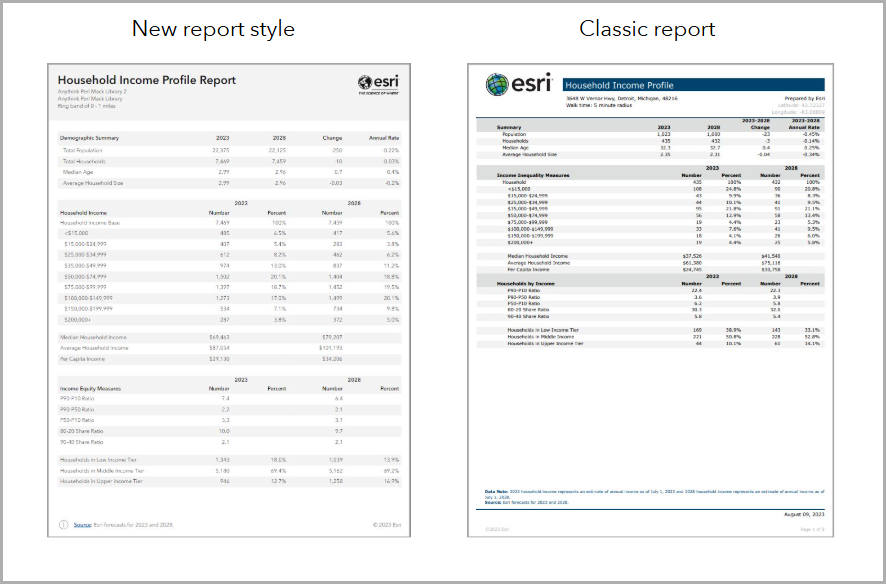
You will still be able to edit existing custom report templates, including adding, removing, or replacing variables. However, we strongly encourage that you get a head start on migrating your workflows to infographic building. This early adoption and familiarity will ensure you have the easiest transition to a more intuitive editing experience.
For more details on this new report style and future updates on migration, read the New report style in ArcGIS Business Analyst Web App blog article.
Know your credit costs up front
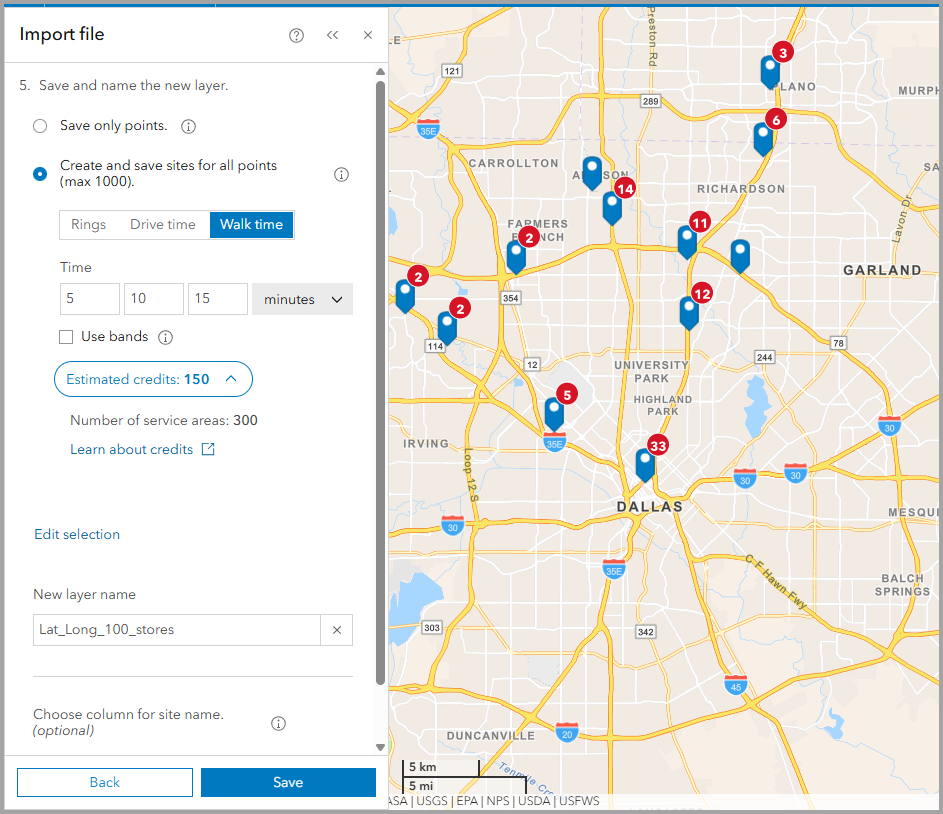
In the October 2025 release of Business Analyst Web App, we were excited to announce our in-app credit estimation tool. Building on this enhancement, you can now expect this same credit clarity in the Add data workflows. Now, you can estimate the amount of credits used for geocoding and site creation when importing files, allowing you to better manage your credit balance
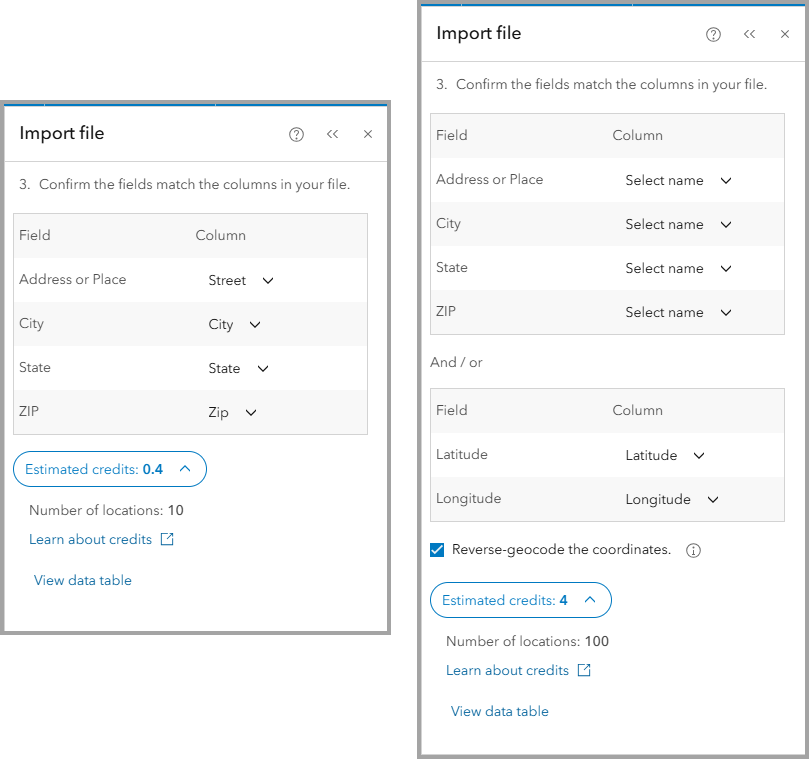
When importing a file using addresses or when using the option for Reverse-geocoding, geocoding is used to return address information for the points. Use the Estimate credits button to see the amount of credits that will be used before adding the points to the map.
Other enhancements
Updates to ArcGIS Living Atlas
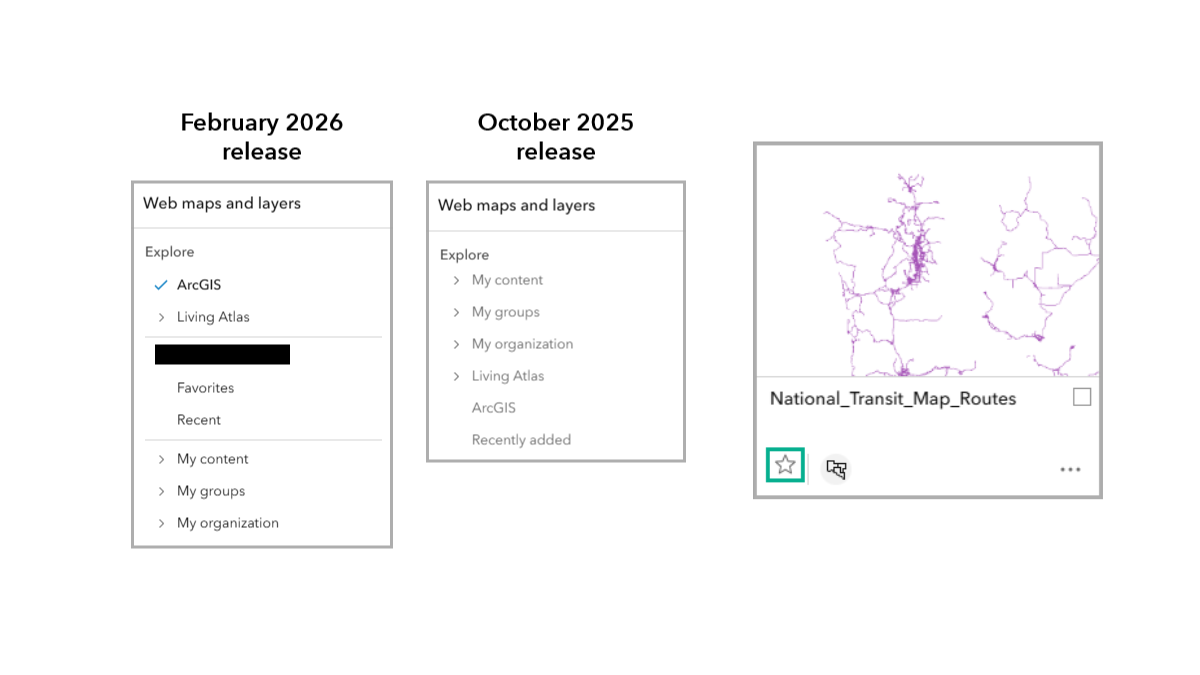
The ArcGIS Living Atlas of the World discovery experience has been refined to be more intuitive and reliable, helping you find the data you need faster. Navigating your content is seamless with clearer layer information and higher-quality thumbnails. If you find yourself using the same map components often, you’ll be pleased to know you can now “favorite” web maps and layers for easy access and better organization in future projects.
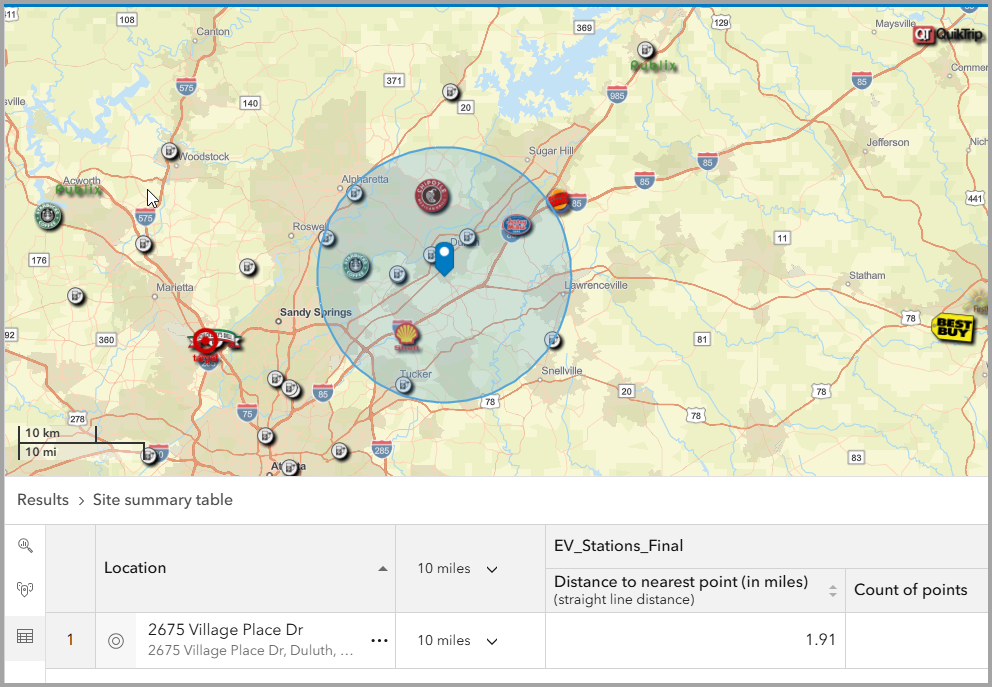
Enhancements to nearby analysis
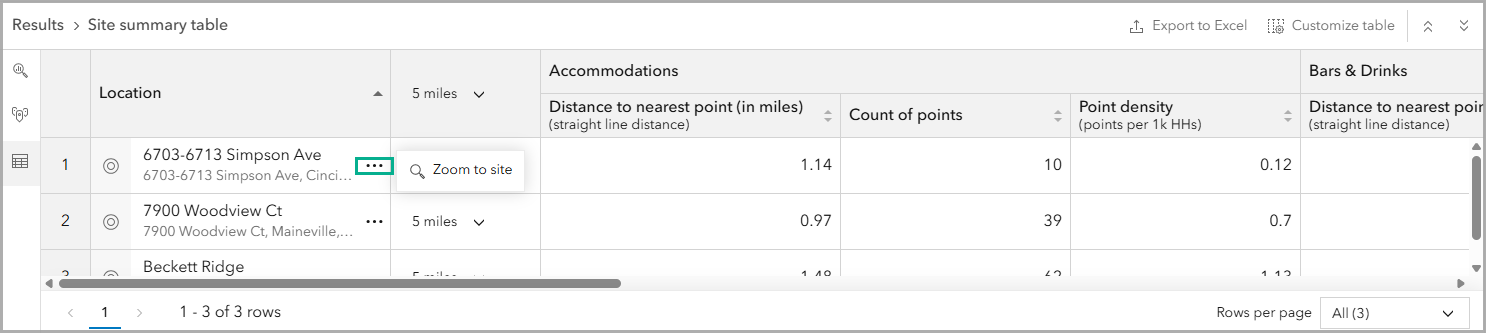
The newly released nearby analysis workflow from the October 2025 update has been updated. Experience enhancements when working with custom layers, improved table sorting, and a new ability to zoom to a point or site in the results table. Also, explore new buffer size selections in the Site summary table.
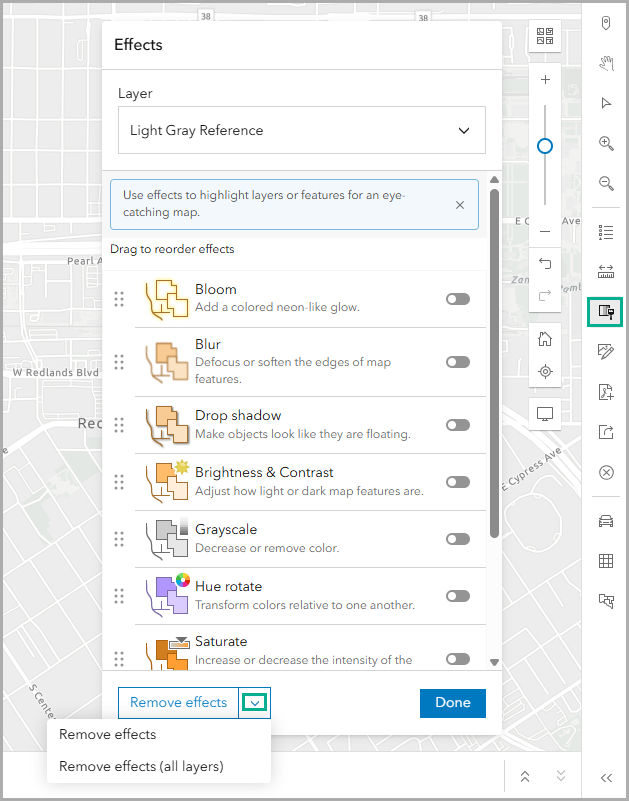
Map effects
Need to take it back to square one? Remove all map effects with a single click using the new Remove effects option
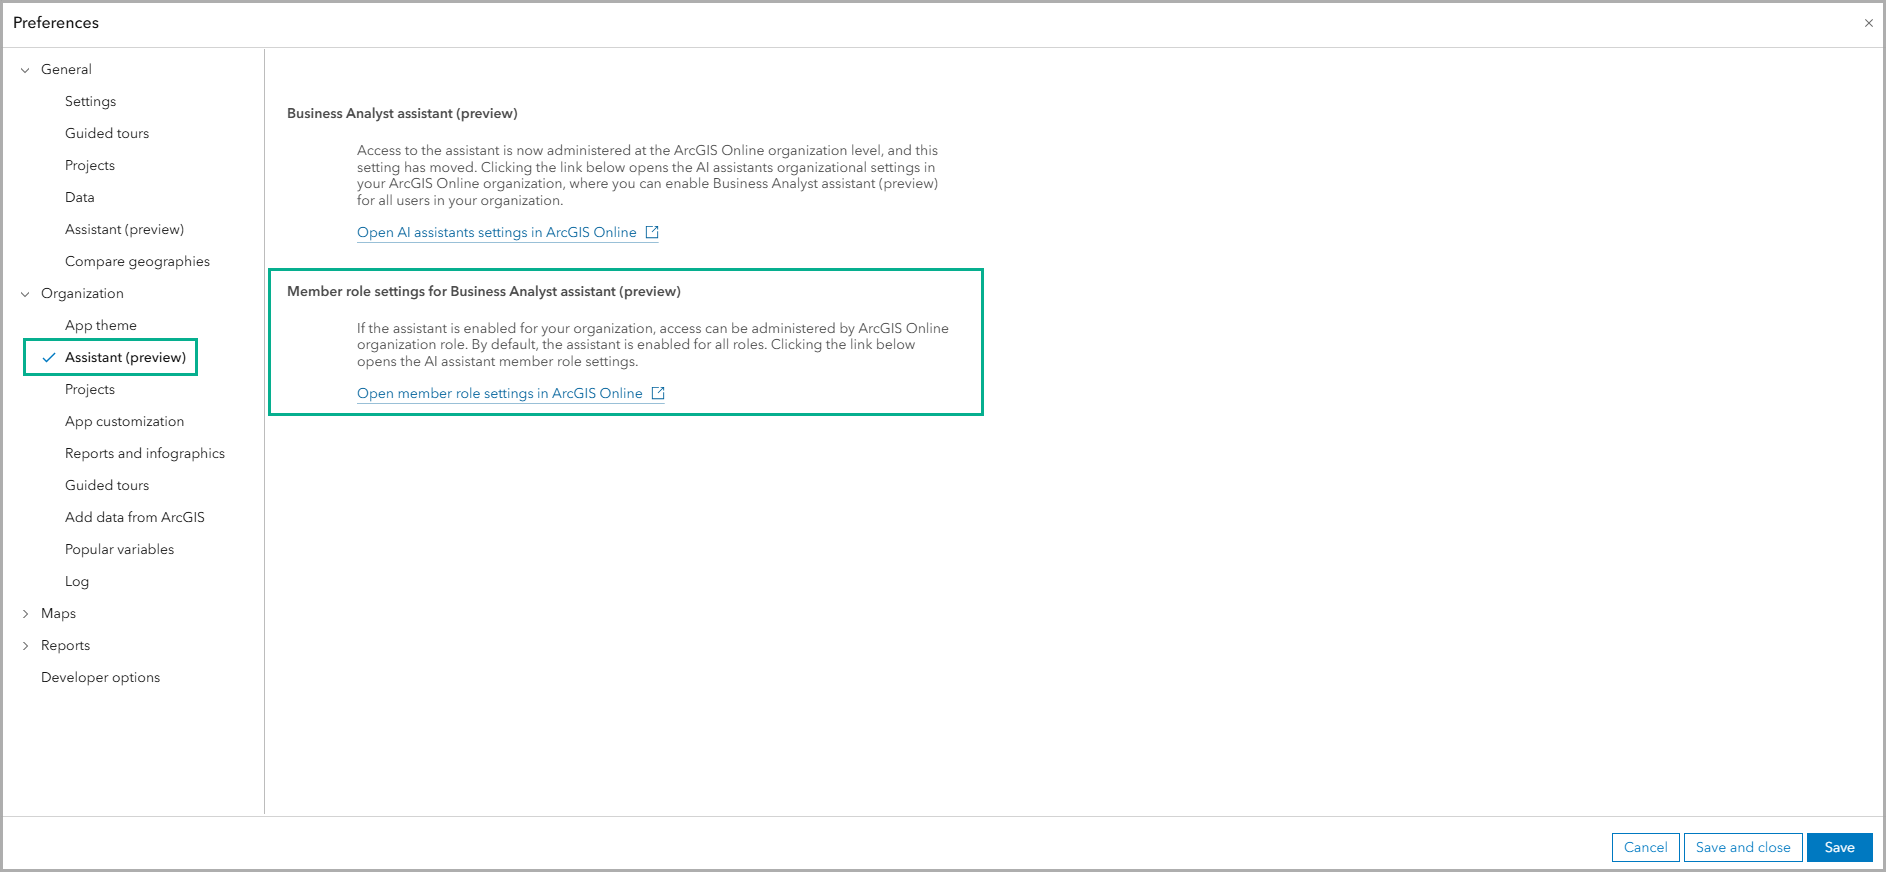
Administrative updates for Business Analyst assistant (preview)
At the ArcGIS Online administrator level, there is a new preference to administer AI assistant access by member roles. In Business Analyst Web App, the administrator preferences include a hyperlink to the new preference setting. This means administrators can set Business Analyst assistant (preview) access through the preference center.
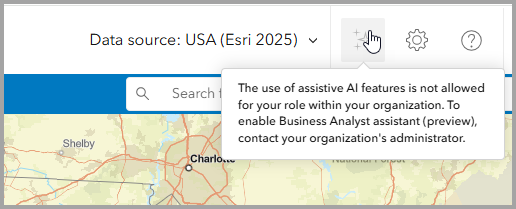
When a user has a role that does not allow the use of AI Assistants, they will see BA Assistant as grayed out with messaging.
Data and boundaries updates
Every Business Analyst Web App release welcomes new or updated datasets for use in your analysis. This release includes updates to the following datasets:
United States data updates:
For the United States, the following datasets have been updated:
- Business Summaries (Data Axle) – December 2025
- Crime Indexes (AGS) – 2025B
- Traffic Counts data (Kalibrate) – Q4 2025
General points of interest (POI) data updates:
Global points of interest (POI) data, including:
- Data Axle (United States and Canada) – December 2025
- Safegraph (United States, Canada, and Puerto Rico) – December 2025
- Foursquare Global Open Source – September 2025
- NOSTRA (Thailand) – October 2025
Global data updates
Global data updates include standard updates for 25 Western and 20 Eastern Europe countries, as well as premium data updates for the following sources:
- Esri Japan (2026)
- Germany NEXIGA (2025)
- Esri Thailand (2024)
For more details on data and demographics updates, refer to the What’s new in Esri Demographics February 2026 blog article.
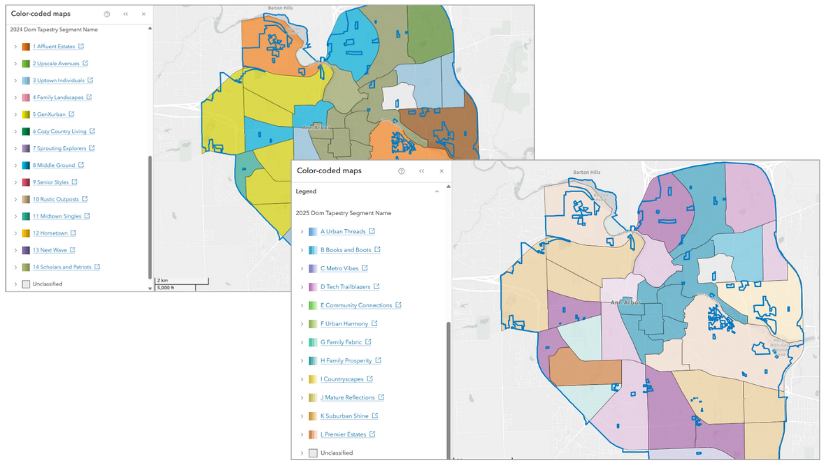
Esri Tapestry Segmentation retirement
In June 2026, the Esri Tapestry Segmentation system and 2024 dataset will be retired. It is recommended that ArcGIS Business Analyst Web App users act now to migrate to the new and improved ArcGIS Tapestry dataset.
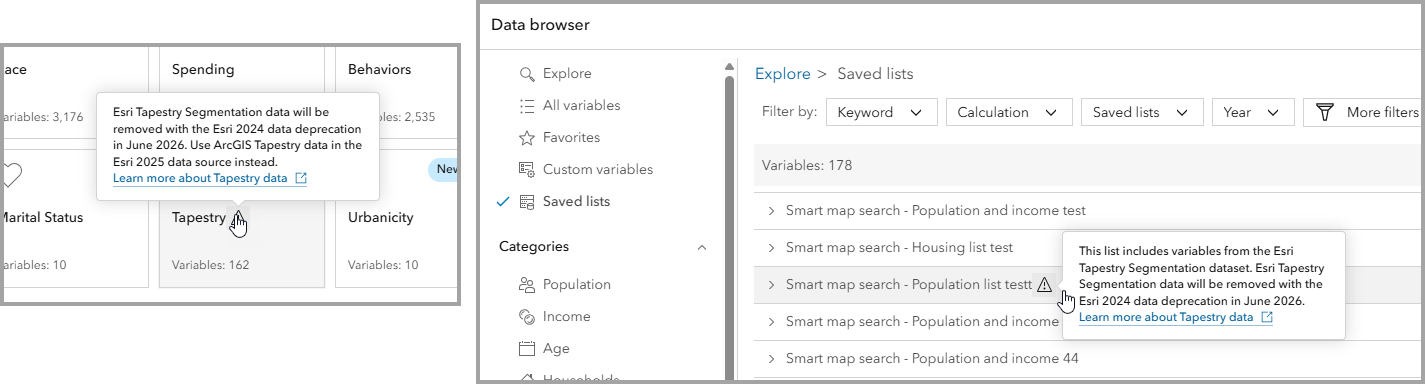
To learn what migration steps you should take, refer to the blog article: Migrate from Esri Tapestry Segmentation to ArcGIS Tapestry using ArcGIS Business Analyst.
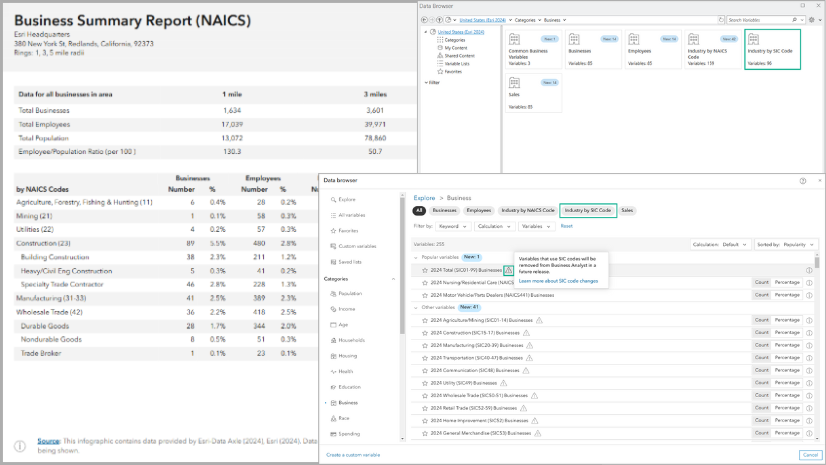
SIC Codes transition to NAICS codes
SIC (Standard Industrial Classification) codes will be removed from Business Analyst in the June 2026 update to ArcGIS Online. Users are required to transition using NAICS (North American Industry Classification System) codes for POI searches. SIC codes will continue to be available as a Data Axle POI data attribute, but SIC-based business summaries will be discontinued.
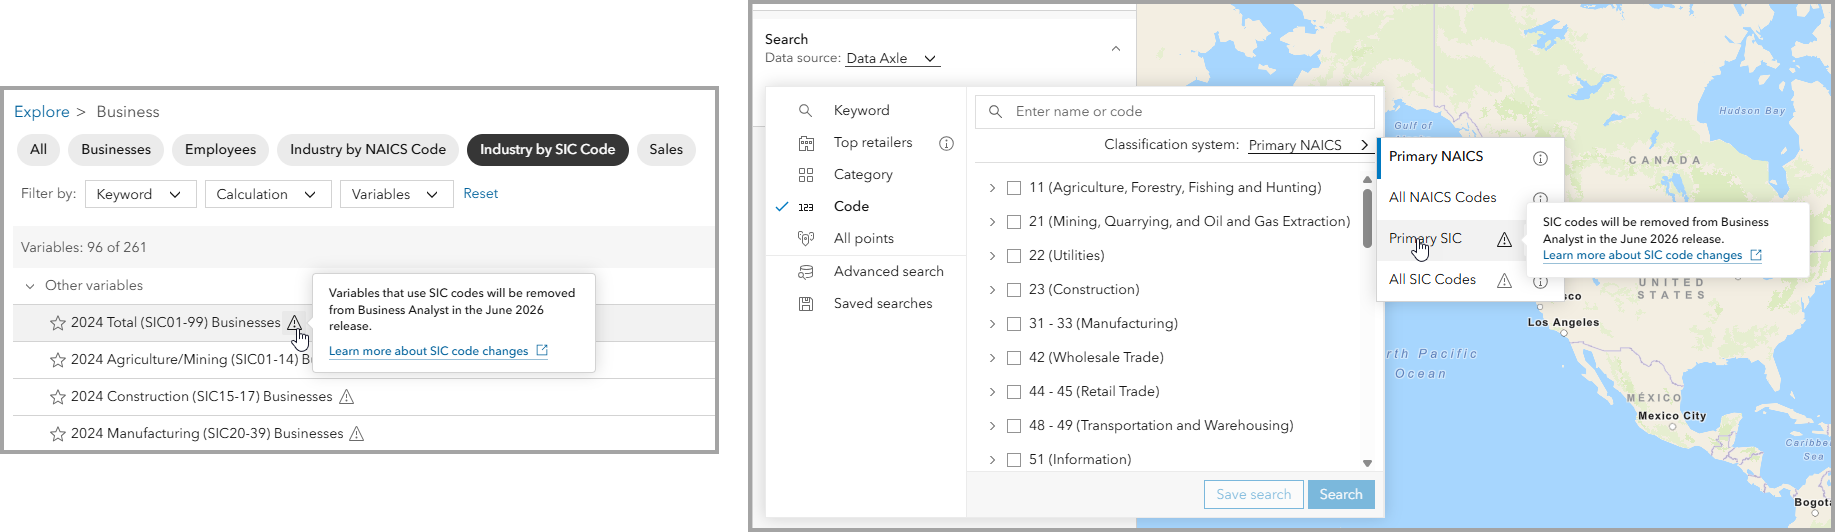
Learn what action to take to be prepared for the June 2026 changes in the SIC Codes transition in Business Analyst blog articl
ArcGIS Community Analyst retirement
ArcGIS Community Analyst retires March 1, 2026. Users must migrate to either ArcGIS Business Analyst Web App Standard or Advanced. For further details, refer to Deprecation Notice for ArcGIS Community Analyst: Transition to ArcGIS Business Analyst Web App.
Additional resources
We’re so happy to share this latest release of ArcGIS Business Analyst Web App and ArcGIS Business Analyst Mobile App with you.
Below, we’ve added resources to help you with your ArcGIS Business Analyst journey:
- Business Analyst product overview page
- Review pricing and purchase Business Analyst
- Join our LinkedIn Business Analyst User Group
- Join our Business Analyst Esri Community
- Follow us on X @ArcGISApps
- Read more Business Analyst blog articles on ArcGIS Blog
- Watch Business Analyst Web App videos
- Watch Business Analyst Mobile App videos
- Visit the Business Analyst Resources page

Article Discussion: