Once you have created a site in ArcGIS Business Analyst Mobile App, there are many actions that can be performed on it. One popular workflow is running a report or infographic. Let us see how to run a report or an infographic for an already created site.
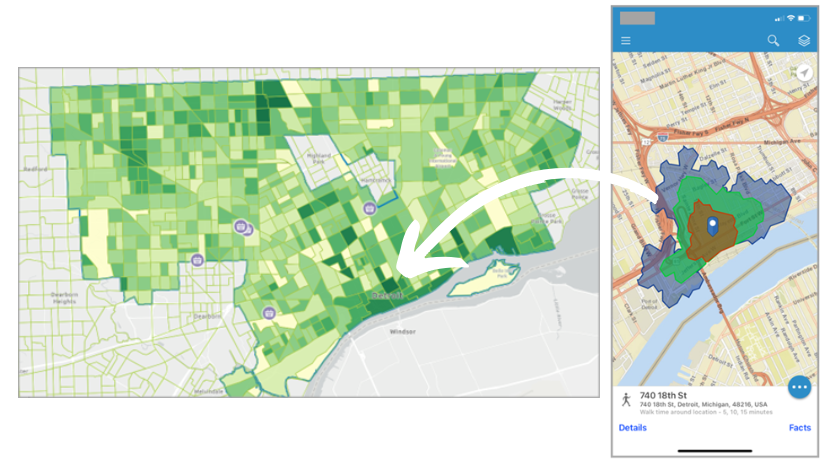
For example, let’s take a site in New York City. Once the site is loaded on the map, tap on Details in the Site Card.

This will open up the Location Details page. In this page, see the Site Actions Menu right below the site information.

Tap on Reports from here. This will open up the Reports page.

There will be two tabs: Infographics and Classic Reports.

Infographics
Under Infographics, there are two sections.
The first section, labeled Current Site, displays the details for the site on which you are going to run the infographic.
The second section, labeled Choose Report, shows the different categories of infographics:
- Favorite Infographics – A list of your favorite infographics, if you have set any in the Business Analyst Web Application.
- My Infographics – If you have built your own infographics using the tool in the Business Analyst Web Application, you will find them here.
- Esri Infographics – Esri provides a default list of infographics for any site within a particular country.
- Shared Infographics – A list of infographics shared with you, or within the organization you belong to.

For this example, let’s run one of the Esri-provided default infographics, Demographic Profile.

When you click on the infographic title, the Mobile App will run the infographic on your site immediately. You can now view the infographic to make any decision based on your needs.

Reports
Under Classic Reports, there are two sections.
The first section, labeled Current Site, displays the details for the site on which you are going to run the report.
The second section, labeled Choose Report, shows the different categories of reports:
- Favorites – A list of your favorite reports, if you have set any in the Business Analyst Web Application.
- My Reports – If you have built your own report using the tool in the Business Analyst Web Application, you will find them here.
- Esri Reports – Esri provides a default list of reports for any site within a particular country.
- Shared Reports – A list of reports shared with you, or within the organization you belong to.
- Previously Run Reports – A list of reports that have already been run for any site within your current project via the Business Analyst Web App or Business Analyst Mobile App.

For example, let’s run one of the Esri-provided default reports, Demographic and Income Profile.

When you click on the report title, the Mobile App will run the infographic on your site immediately. You can now view the report to make any decision based on your needs.

You have now learned how to run reports and infographics for any site from the Business Analyst Mobile App. You can view reports you’ve run in the Mobile App, via the Web App and vice versa.
Banner image courtesy of Fabien Bazanegue on Unsplash.

Article Discussion: