You might be familiar with the points of interest (POI) data available in Business Analyst Web App. For example, maybe you’ve added restaurants, hotels, or grocery stores into a site selection or competitor location analysis.
What you may not know, however, is that one of the POI data sources has an open hours attribute, and importantly, you can leverage this information to perform analyses based on specific hours of operation. Have you ever wanted to compare your store’s hours with other competitors in the area? Identify clusters of nighttime entertainment venues to locate a potential new restaurant nearby?
Good news, with the June 2026 release, you can do this in the United States and Canada using the Safegraph POI data source in Business Analyst Web App. Safegraph provides open hours data for many (but not all) locations in their data, and using new tools available in Business Analyst Web App, you can leverage open hours as part of your analytical workflow.
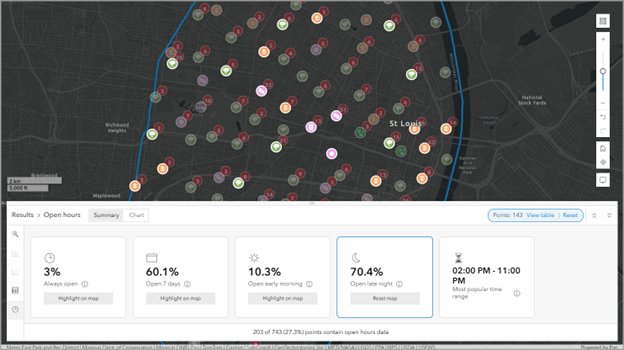
What is open hours data?
Open hours data represents the operating hours for points of interest (POI). For example, map convenience stores open early in the morning (3 a.m. to 8 a.m.), concert venues open late at night (10 p.m. to 3 a.m.), pharmacies open all the time (24 hours a day, 7 days a week), or gas stations open 7 days a week.
How do you find open hours data?
Open hours data is accessible through the SafeGraph POI data source and is available for Canada and the United States.
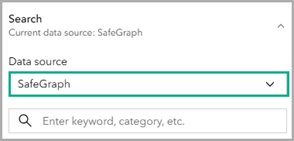
To find open hours data, use the SafeGraph POI data source and perform a points of interest search.
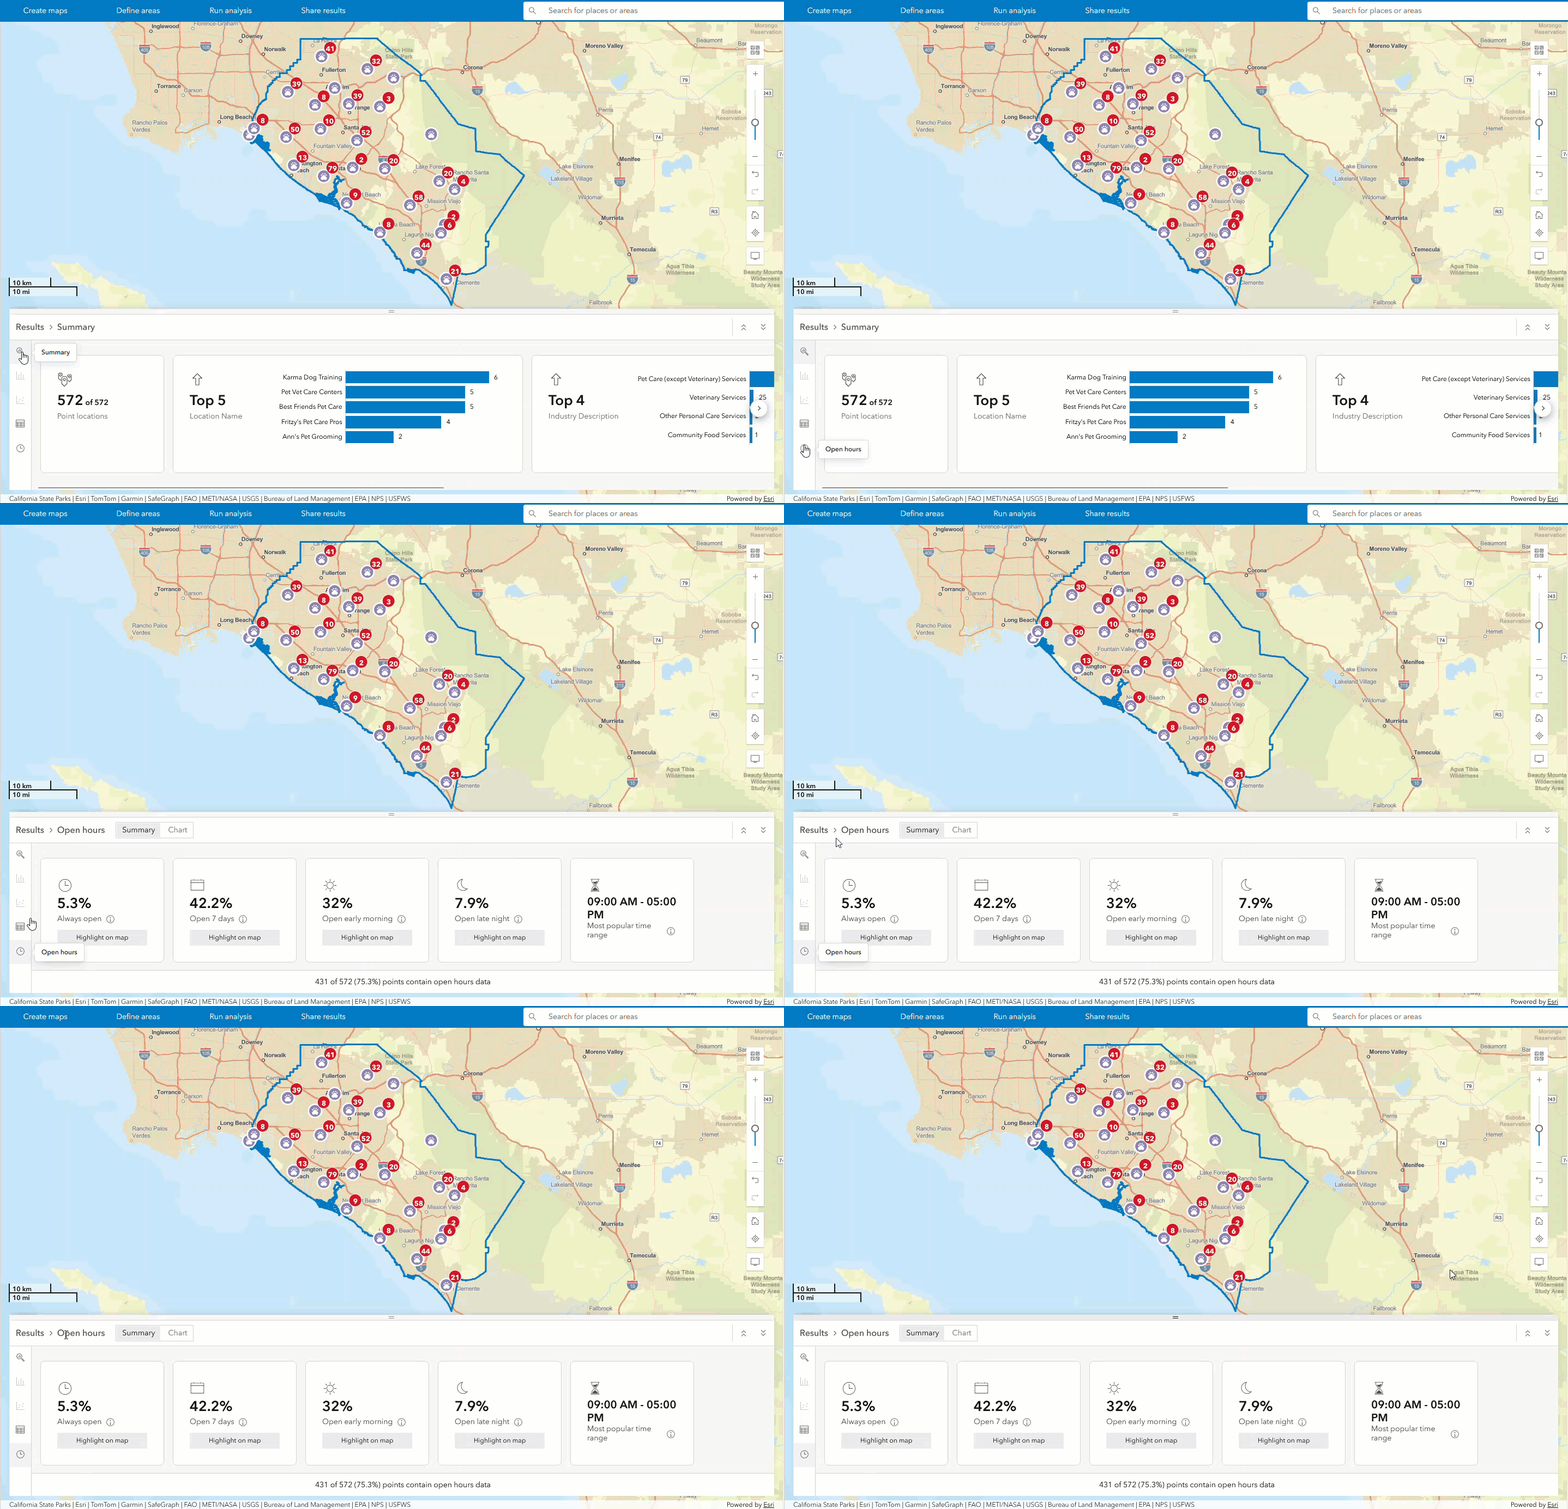
The results (locations) appear on the map and are summarized in the Results pane. Click on the tab with the clock icon to access the new view dedicated to open hours information, with related summaries and charts.
If you click a point on the map, you can find open hours attributes in the pop-up window.

You can also find open hours data in Business Analyst Pro. Perform a POI search using SafeGraph as the online data source. The preview and attribute table shows open hours when it is available for locations.
What can you do with open hours data?
To use open hours information for your analysis, set SafeGraph as the data source in POI search and select the business categories of choice for an area of interest (example, pet care services in Orange County, CA). The results matching your search criteria are visualized on a map.
To further refine your search and identify which among them operate during specific hours such as early morning + late night hours, 24/7, or weekends, use the dedicated filter for open hours, accessible by clicking Show filters, under the By attributes section.
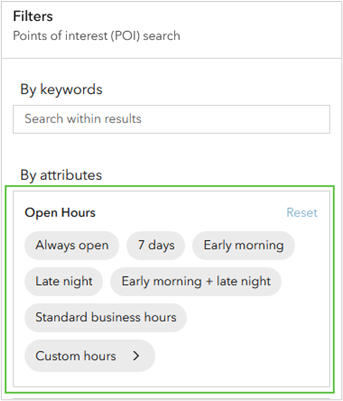
You can select preset ranges of open hours, for example, Always open, 7 days or Early morning/Late night, or define a custom range by clicking on the Custom hours chip under filtering options and clicking on a time block (Shift click to select multiple time blocks, click and drag to select a continuous range).
You can further configure the match condition to Any or All to filter the results by any or all the time ranges selected.
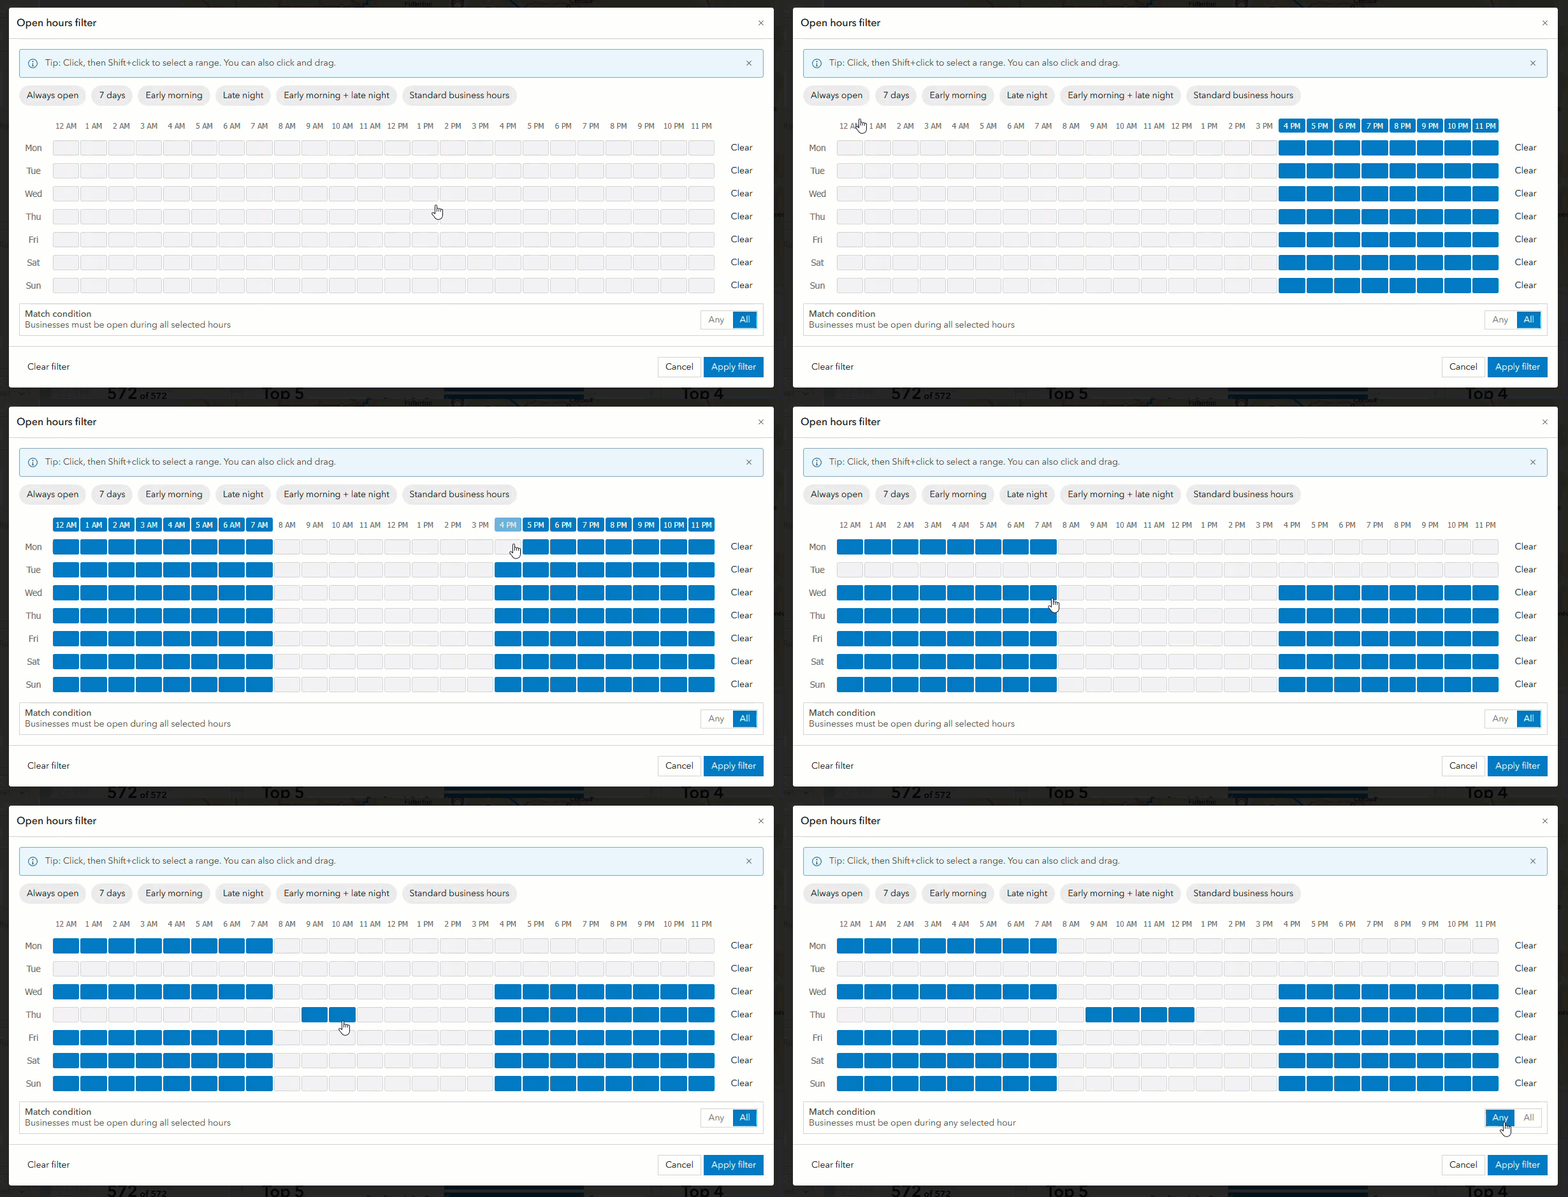
When the filter is applied, only the points that meet the defined criteria are displayed on the map.
The points of interest search results pane now has a dedicated view for open hours information, where results are summarized and visualized in different chart formats.
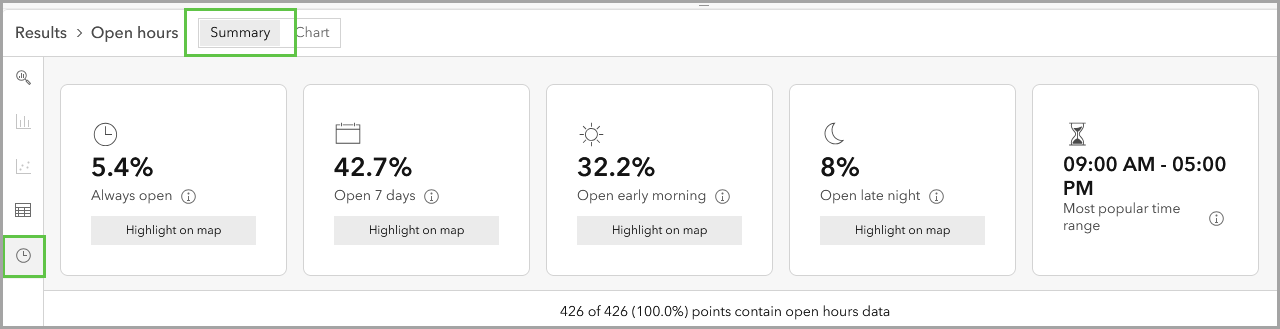
The default Summary view includes cards summarizing results based on different operating hour ranges (Always open, Open 7 days, Open early morning, Open late night) and provides the most popular time range for the businesses in the search results.
You can click Highlight on map under the Always Open card to display the locations of pet care services that are open 24/7. You can also view the filtered results as a table by clicking the View table option.

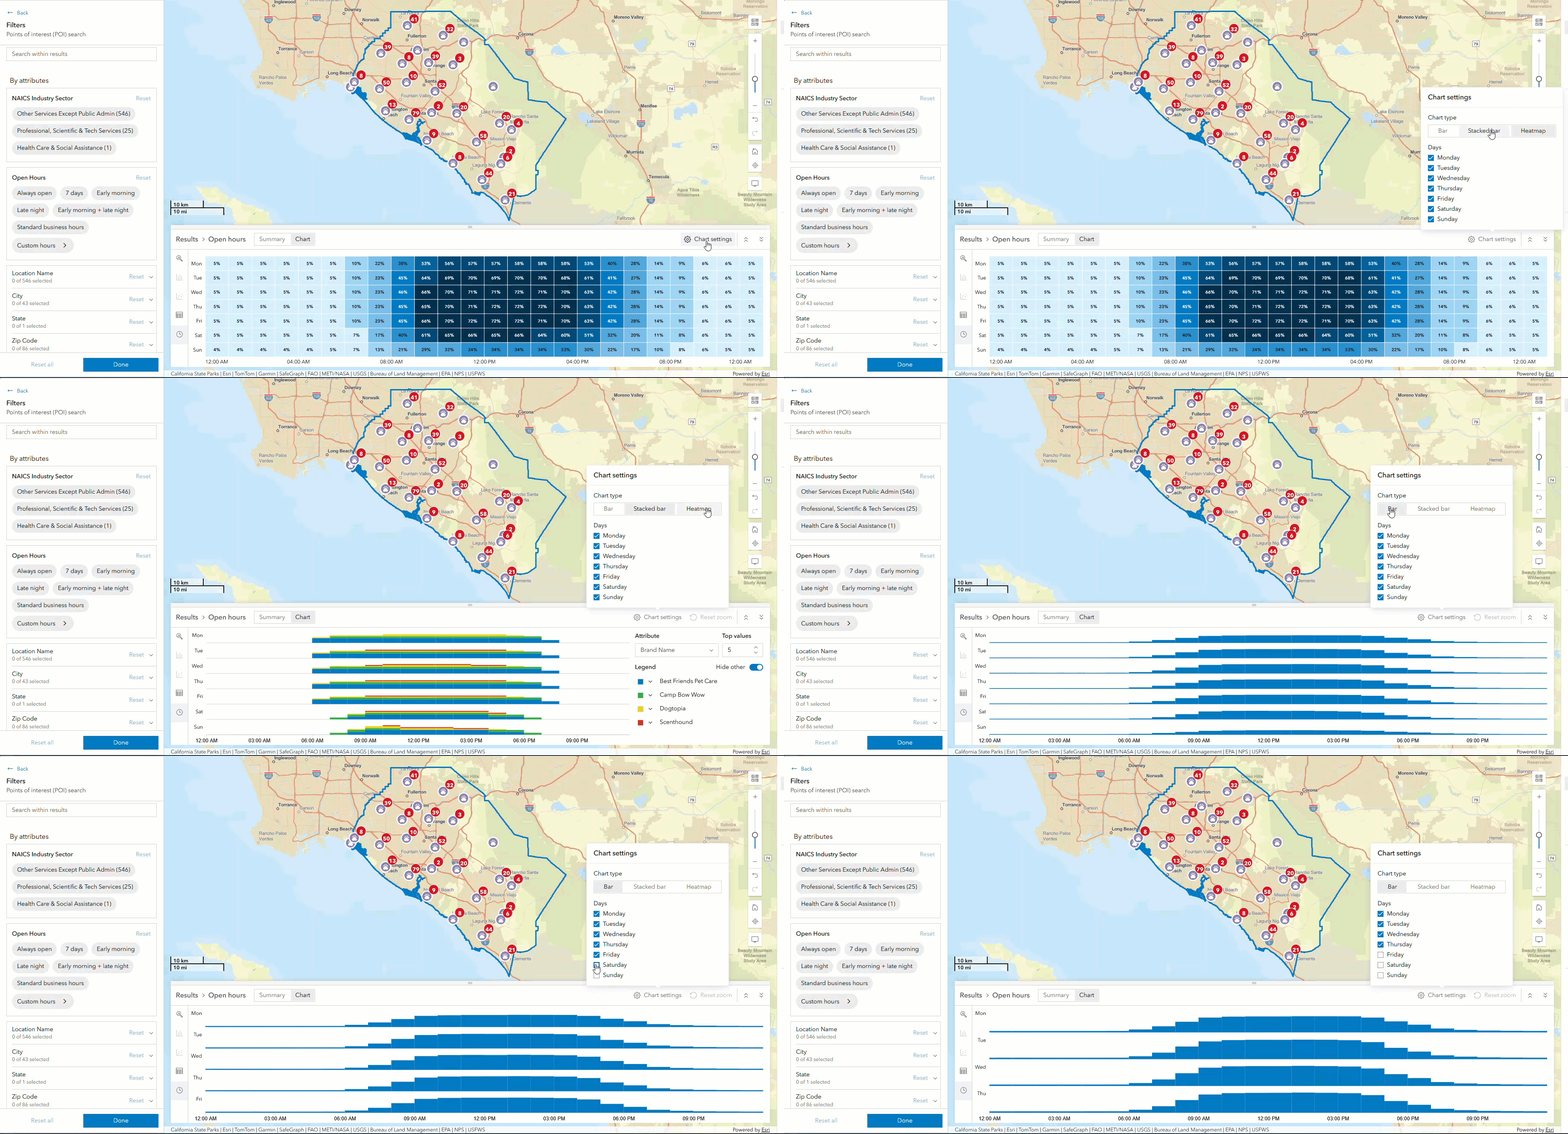
The Chart view visualizes the open hours information as a heat map, bar chart, or stacked bar chart.
The default heat map displays the percentage of businesses operating by hour of day and day of week. This information is useful when determining availability across time ranges.
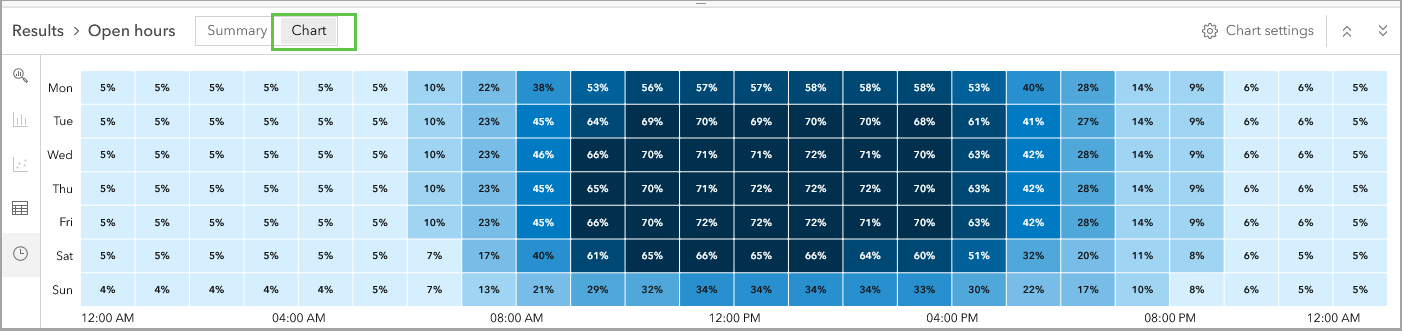
When open hours filters are applied (Filter by attributes), the heatmap updates on the fly to display summaries of the updated search results. Hovering over each hour block displays the number of businesses open during that hour.
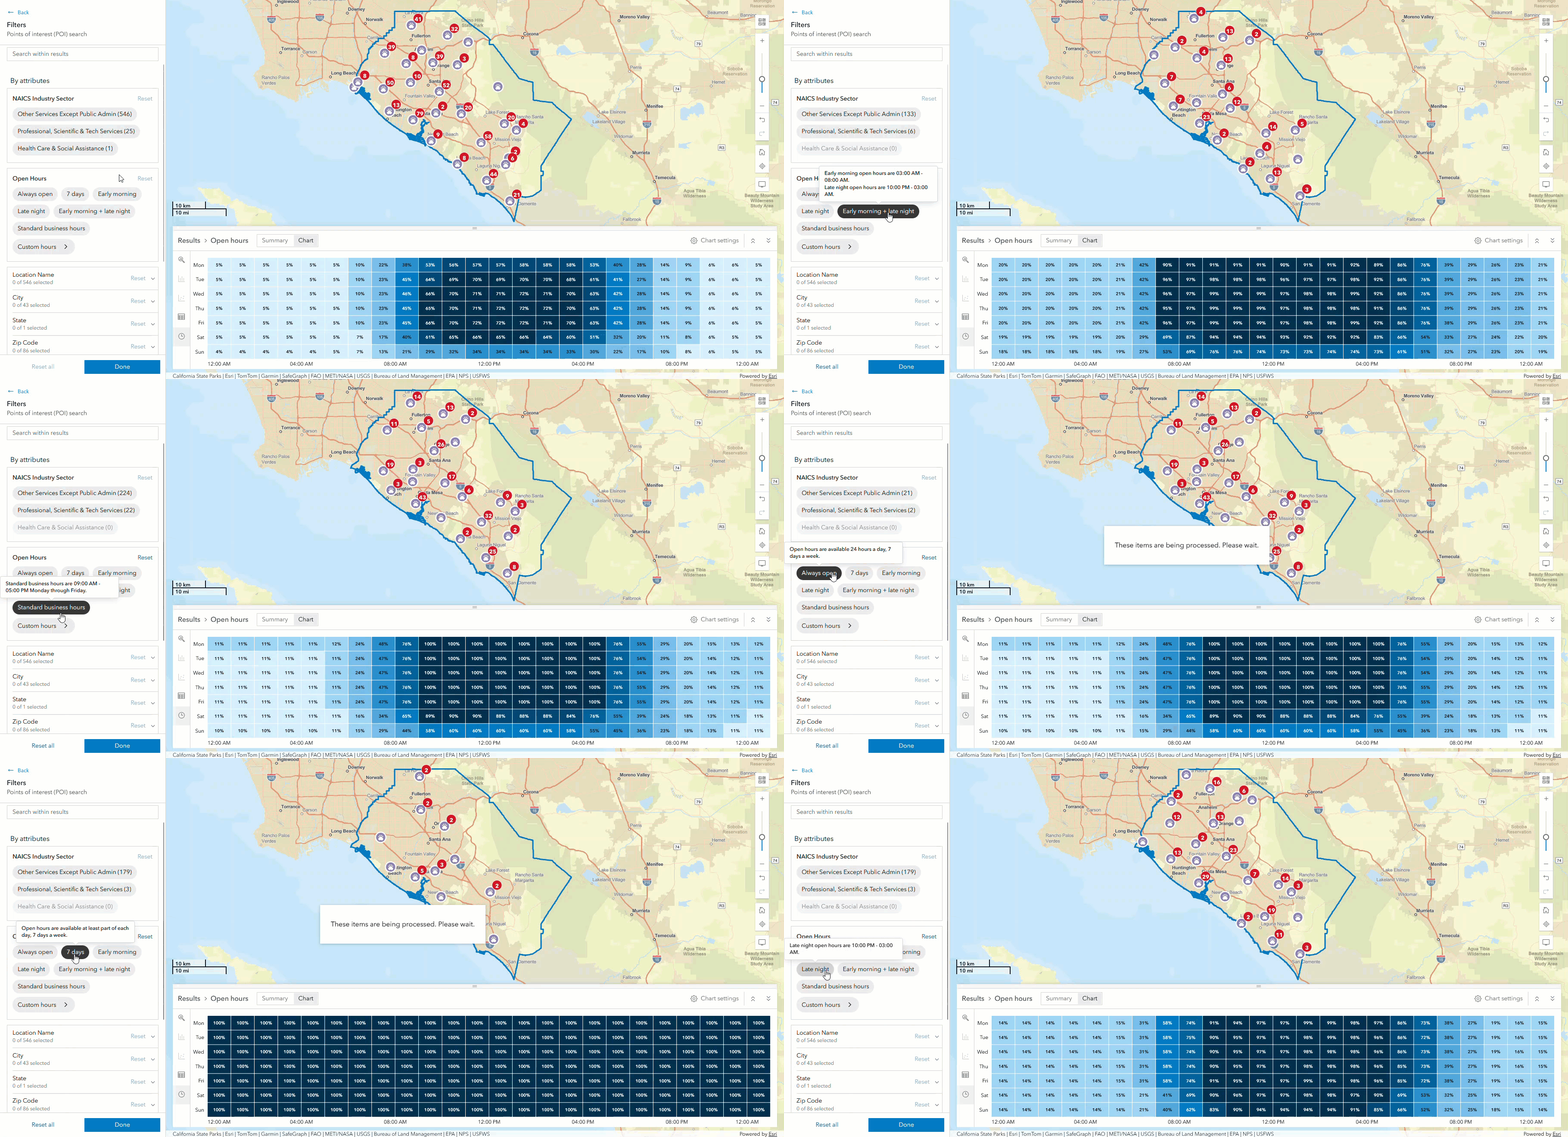
The chart type and the days included in the chart/results can be modified within the Chart settings pop-up.
The bar chart is a quick way to view the total number of points (businesses open) by hour and day.
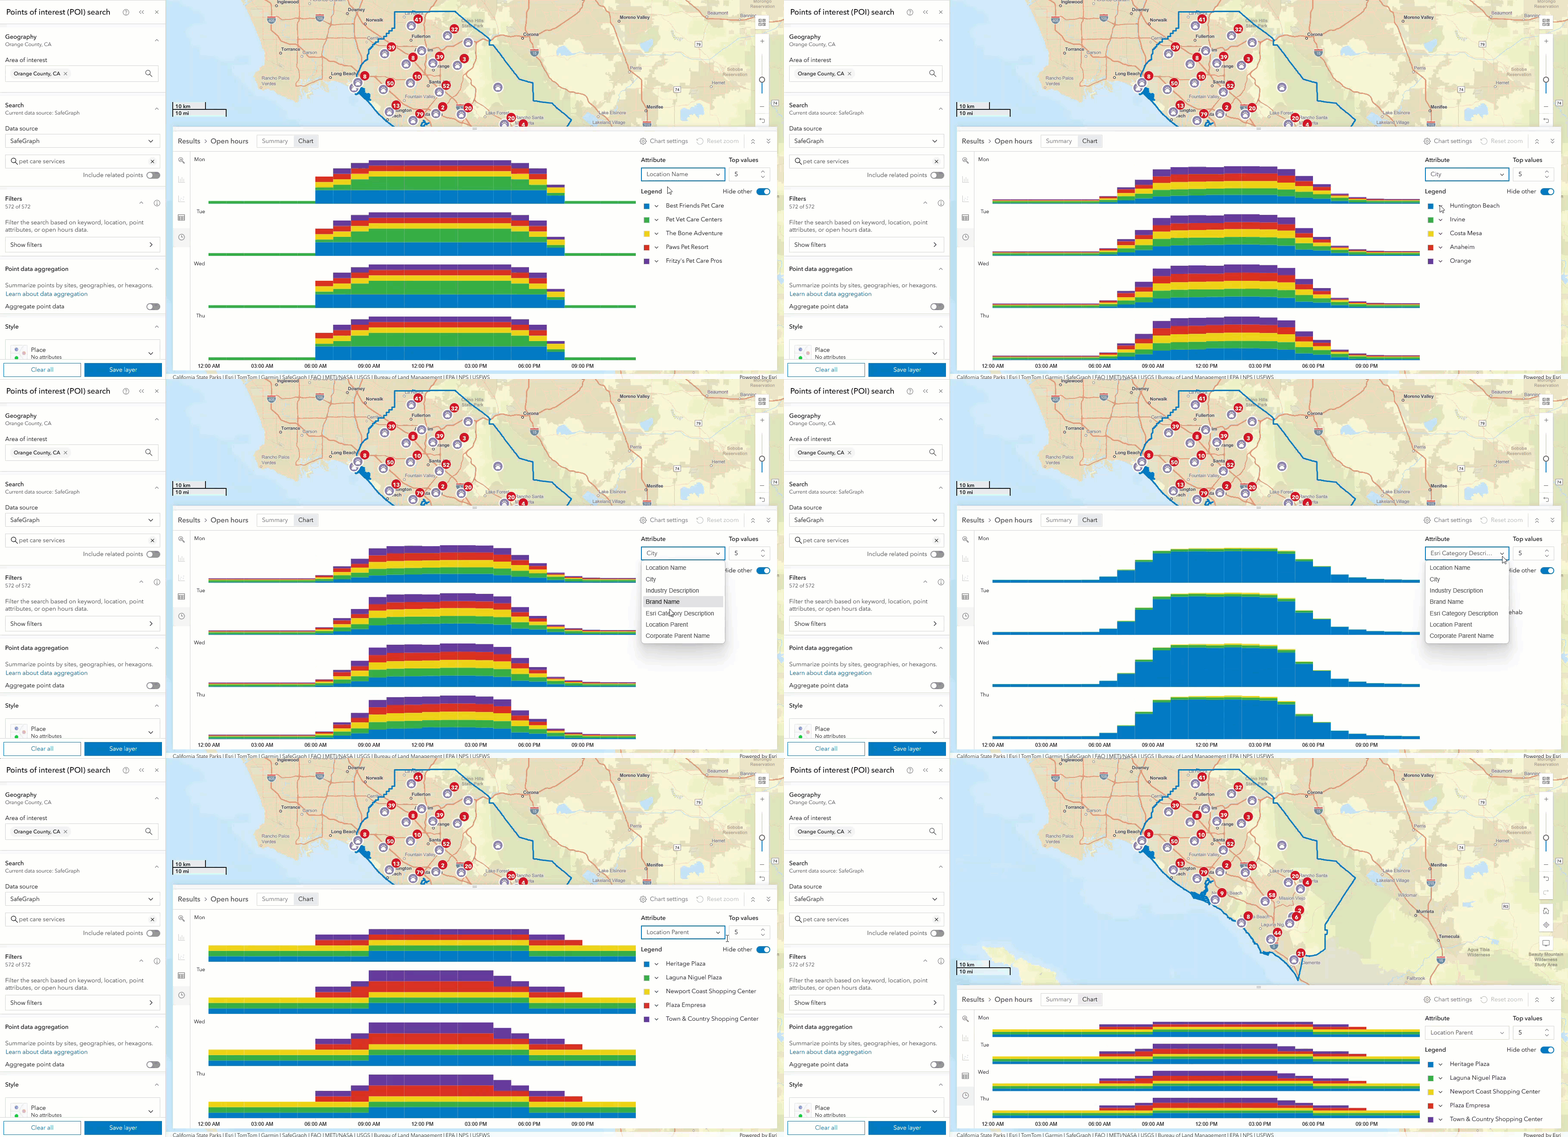
The stacked bar chart is a great option to see open hours results (by hour of day), allowing you to categorize the data by business attributes such as Location Name, Location Parent, City, and Industry Description.
For example, you can use the stacked bar chart and categorize results by the City attribute to identify which cities have a higher number of pet care related businesses that match your operating hours search criteria.
Additionally, you can also zoom into a particular time range and hover over the categorized bars to view the total number of open businesses by category or, in the case of a bar chart, the total businesses open during that hour.
Overall, open hours information helps you understand the distribution of business operations over a day/week and can be a powerful attribute for analysis when hours of operation are a crucial decision-making factor.
Some applied examples where open hours could be useful are described below.
Scenario 1: Locate a new 24 hour emergency vet clinic
Emergency veterinary services are critical to support pet ownership, but many cities are lacking in 24/7 clinics. To address this issue, a nonprofit organization is looking to fund the opening of a new emergency clinic in Spokane, Washington. Spokane has a high number of households owning more than one pet and ranks in the top ten cities for cat lovers.
Create a color-coded map of total population and pet ownership. Use the variables 2026 Total Population and 2026 Household Owns 1+ Pets (Index). The index value shows which areas are above (over 100) or below (under 100) the national average of pet ownership. The color scheme uses four colors:
- Dark blue represents high total population and high pet ownership.
- Pink represents high total population, low pet ownership.
- White represents low total population, low pet ownership.
- Sky blue represents low total population, high pet ownership.
Perform a POI search using SafeGraph as the POI data source. Use Esri Categories to perform a category search for Veterinary Services. The map displays a purple icon with a bear print to indicate a veterinary service location. Use the Open hours view in the Results pane to highlight locations that are open 24/7.
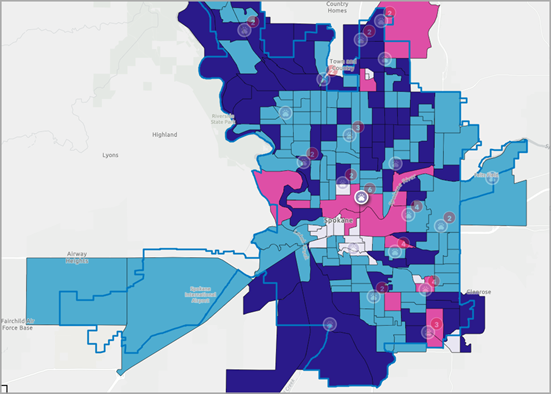
Only 1 location in the city (out of 29 with open hours data) has 24/7 open operating hours. It’s located in a pink section of the map, which has a high total population and low pet ownership.
For more information, explore the open hours heatmap. Click the Chart tab, and if necessary click Chart settings and select Heatmap. Hover over items in the heatmap to see how many locations are open at certain times.
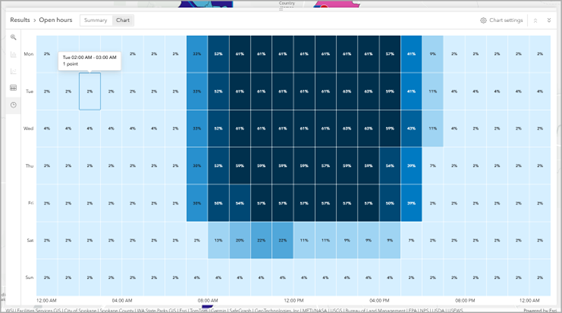
The nonprofit can use this information to target grant allocation to the northern or southern outskirts of the city, where coincidentally pet ownership is high and veterinary clinic density is low.
Scenario 2: Identify where parking might be tight around restaurants
Kansas City has a buzzing culinary scene, especially late-night barbeques and bars. Parking around these nightspots is not always convenient though, a bummer that can stop a fun night from even starting.
Inspired by this issue, a start-up is looking to launch a valet service to help foodies visit restaurants without worrying about parking. They use Business Analyst Web App to perform a points of interest (POI) search to map restaurants and parking open late at night as a way of locating optimal locations for their valet stand.
Their advanced search matches any of the following conditions:
- Esri Categories is any of the following: Parking Lots & Garages.
- Esri Categories is any of the following: Drinks & Dining.
The results appear on the map and in the Results pane, including the new Open hours view. For example, a trendy foodie neighborhood, Crossroads, has 45 points with open hours data, including 13 points open late at night. Only problem? None of those points are parking.
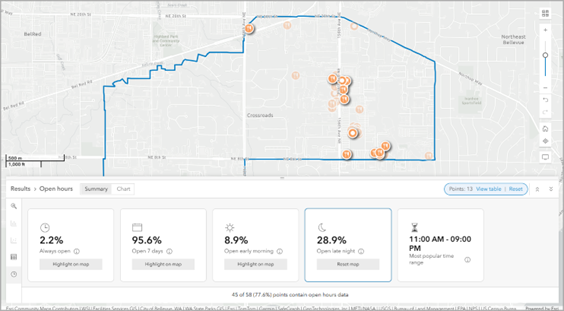
The nearest parking garage is almost a mile away from the heart of the culinary scene in Crossroads.
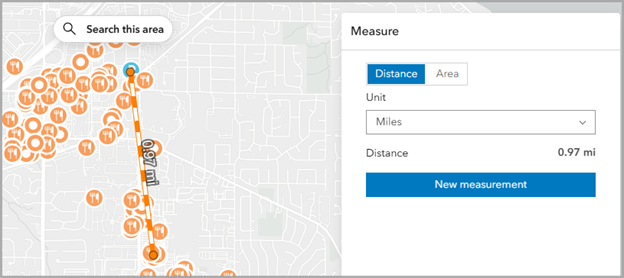
The start-up can use this information to create a digital campaign targeting Crossroads to advertise their valet services, driving between restaurants in Crossroads and the nearest parking garage so that diners don’t have to.
How often is open hours data updated?
Open hours data is part of the SafeGraph POI data source. It is updated three times per year.
Summing it up
Open operating hours data contextualizes points of interest activity. Understanding time-based data can help you locate what’s pertinent to your industry and can lead you to discover data you didn’t even know you needed. Explore what time ranges are competitive for your business using points of interest (POI) search in Business Analyst Web App. Highlight results on the map and view interactive data visualizations to better understand patterns in customer activity.
For more information on open operating hours in Business Analyst, see the following:
- Walk through the workflow in Map points of interest (Business Analyst Web App) or Search points of interest (Business Analyst Pro).
- Learn about underlying open hours calculations in Results pane reference.
- Find out which data sources are available in Points of interest (POI) data sources.
- Read about the open hours data source provider, SafeGraph.
Resources
Now that you’ve learned about open hours, we hope you’ll explore more capabilities in Business Analyst. To continue your Business Analyst journey, visit the following resources:
- Business Analyst product overview page
- Review pricing and purchase Business Analyst
- Business Analyst resources page
- LinkedIn user group
- Business Analyst Web App video channel
- Business Analyst Pro video channel
- Business Analyst on Esri Community
- Business Analyst Web App login page
- Email the team: businessanalyst@esri.com
This article uses ArcGIS Business Analyst Web App Standard to map points of interest. This article uses the ArcGIS Places dataset by Esri, the SafeGraph POI data source, and basemaps provided by Esri.



Article Discussion: