Some background information
Gothenburg is the second-largest city in Sweden, fifth-largest in the Nordic countries, and the capital of the Västra Götaland County. It is situated by Kattegat, on the west coast of Sweden, and has an approximate population of 570,000 in the city and about 1 million inhabitants in the metropolitan area.
The challenges and how to deal with them
I think most of us have heard the term “Smart City” at least once by now, but what exactly is it and why is it hailed as the future of urban planning?
As the earth’s population increases by around 1% each year, it’s vital that cities and their supporting ecosystems address ways of living (e.g. ensuring there is enough housing and that it’s affordable), transportation (e.g. infrastructure in place to deal with the influx in population), energy solutions, public health, quality of life and economic growth (to name a few).
On top of this, we face other challenges as a global society like the recent COVID-19 crisis or impacts of climate change in the form of drought, seismic activity or rising sea levels.
So how can we handle these challenges?
One answer to this is to build a digital twin of a city and/or its surroundings in order to analyze historical or real-time data and study simulations of potential future scenarios.
This is exactly what Gothenburg decided to do with the aim of releasing a digital version of Gothenburg by 2021.
Why digital twins?
It’s important to know that a digital twin is not just a visual copy of the physical assets (i.e. the 3D city model as a Scene Layer).
To be truly useful, a digital twin also needs to accurately consume and represent all the information connected to it.
Accordingly, Digital Twins can be used for many different things:
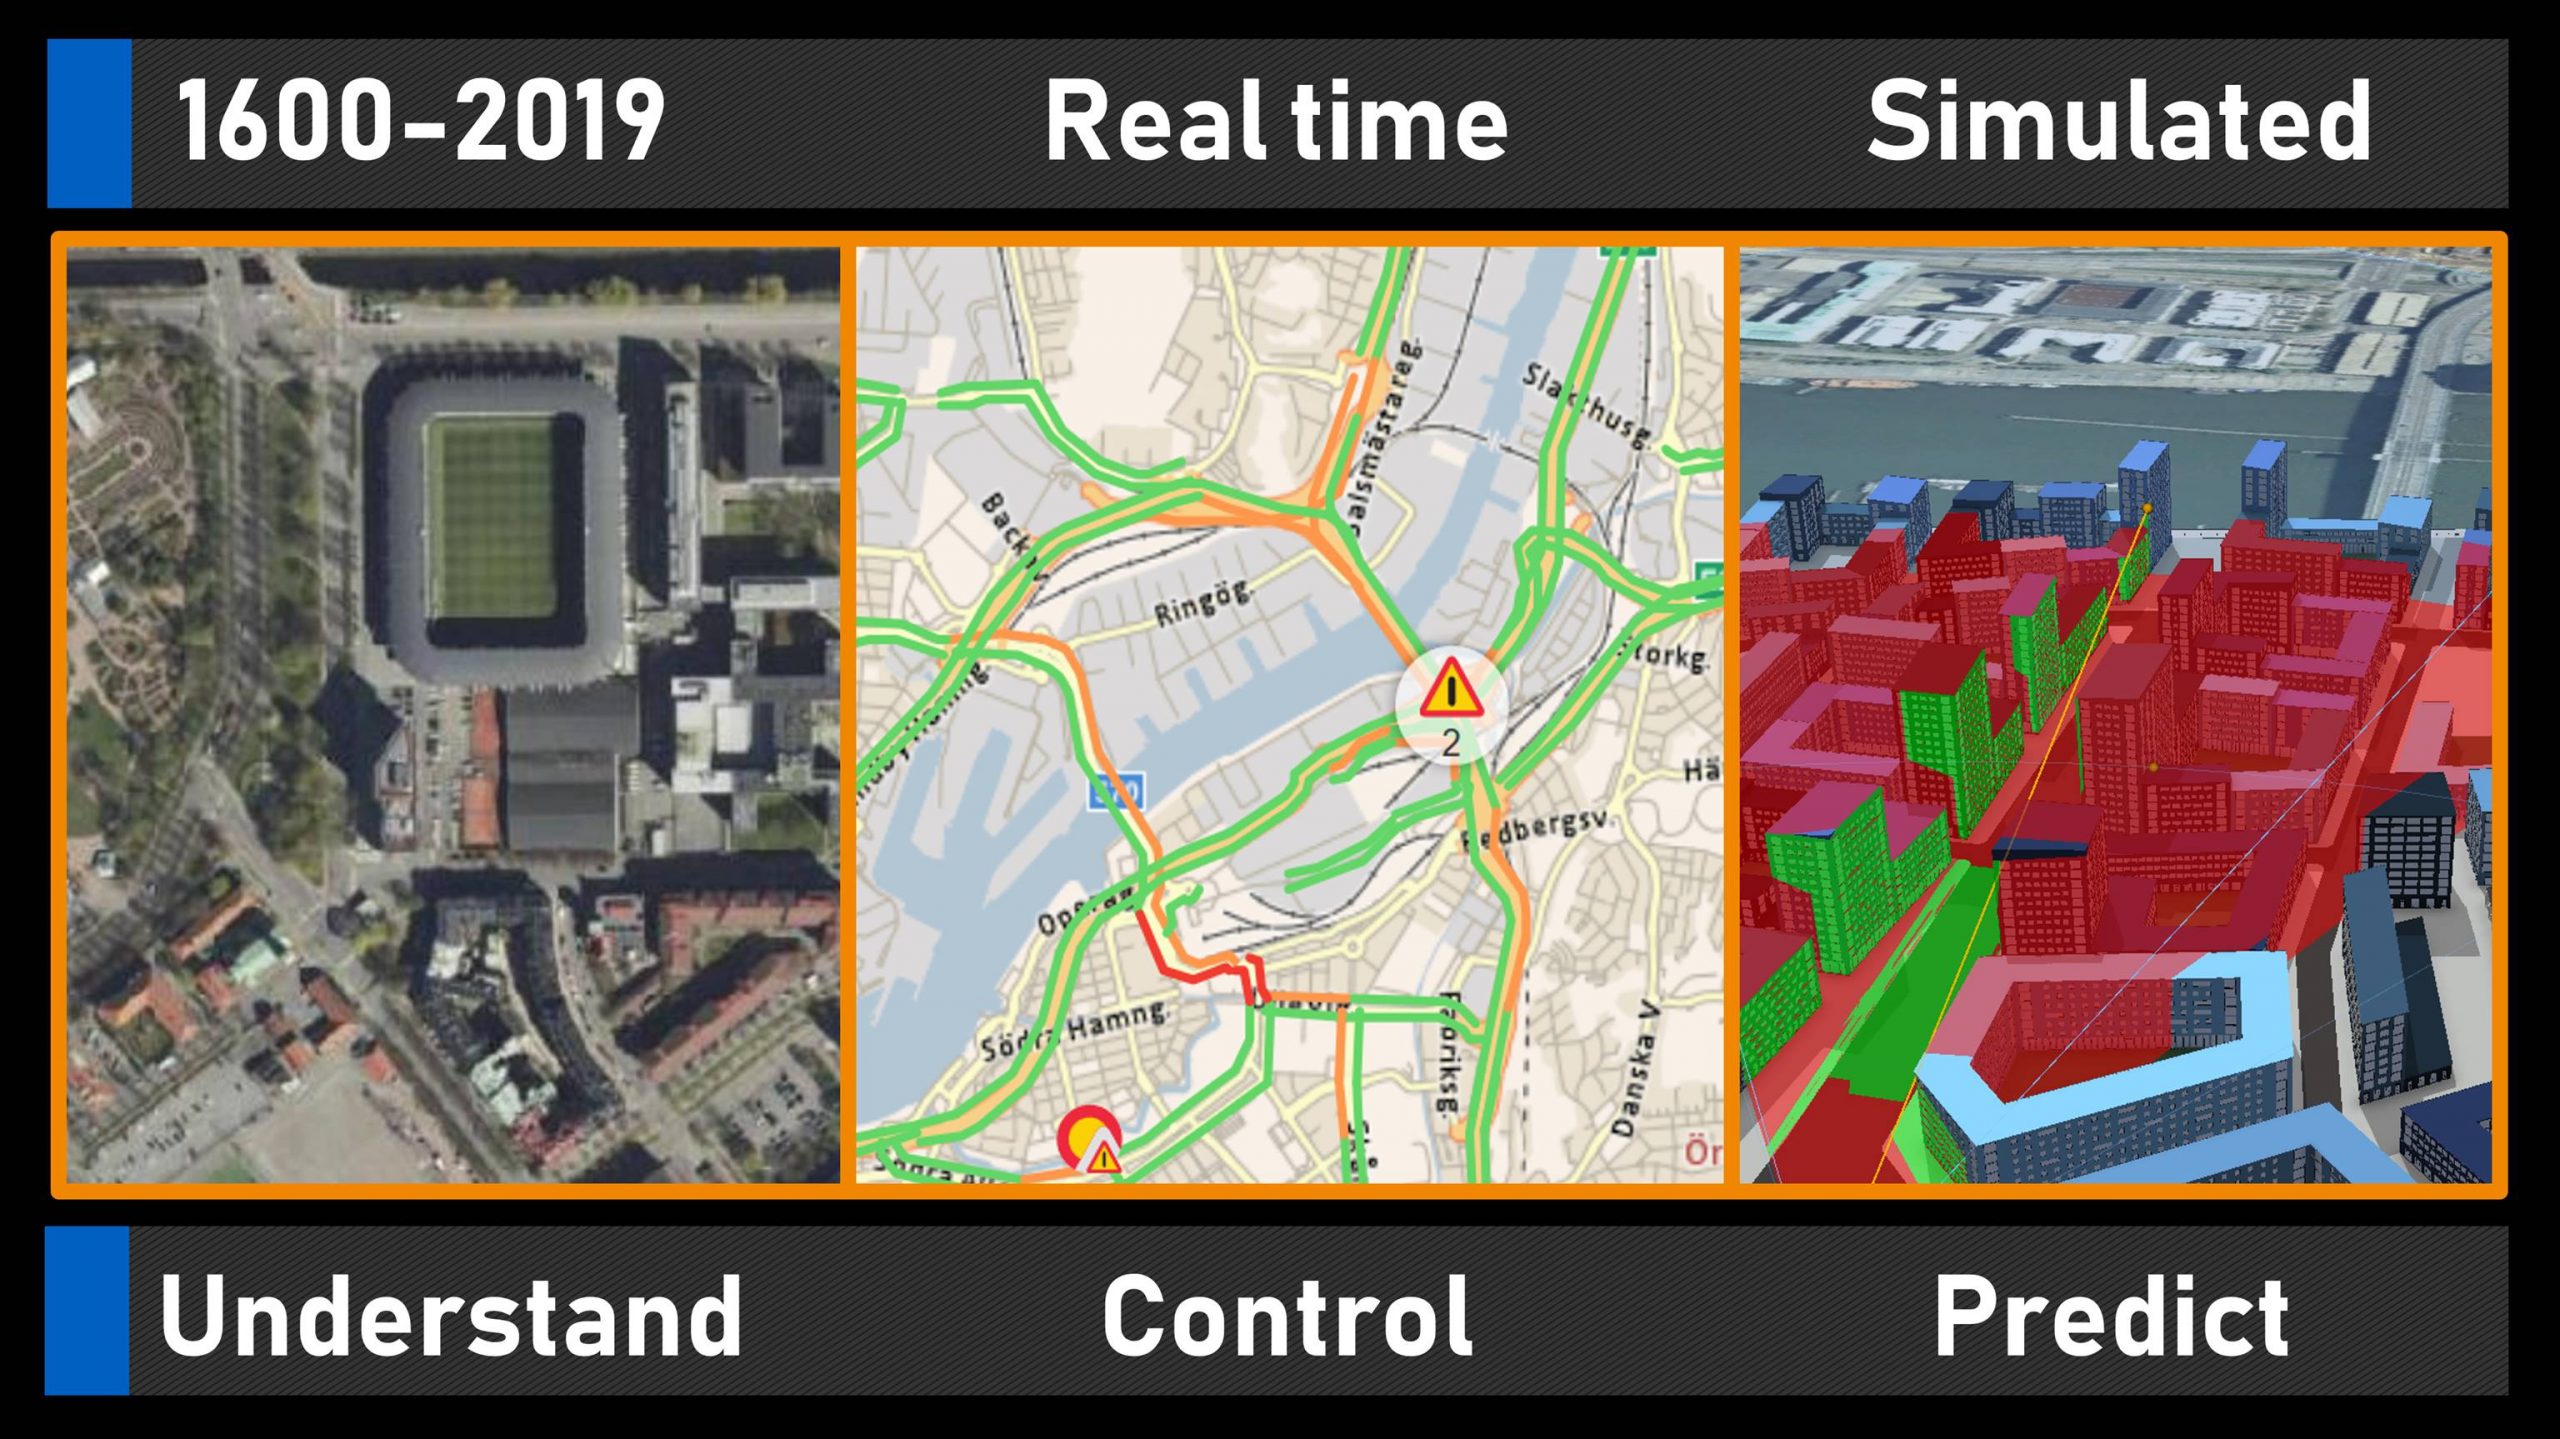
- Historical data can be used to view, analyze and understand the city and how it works. An example are the Living Atlas Indicators provided with ArcGIS Urban.
- The Real-time data can be used to regulate or control a city (e.g. the traffic flow, people and pollution). As a society we’re digitally advancing (rapidly!) and we’ve never been more connected. There are countless technologies like smart phones (which we all have) and the fourth industrial revolution (Industry 4.0) which includes things like the Industrial Internet of Things (IIoT) and it’s sensors, RFID’s and cloud services.
- Simulated or scenario data can be used to predict the future (answering a bunch of those “what if” questions). Digital twins can be useful for example to study shadowing impacts, train autonomous vehicles, or simulate flood level scenarios as can be seen in the example in the video above.
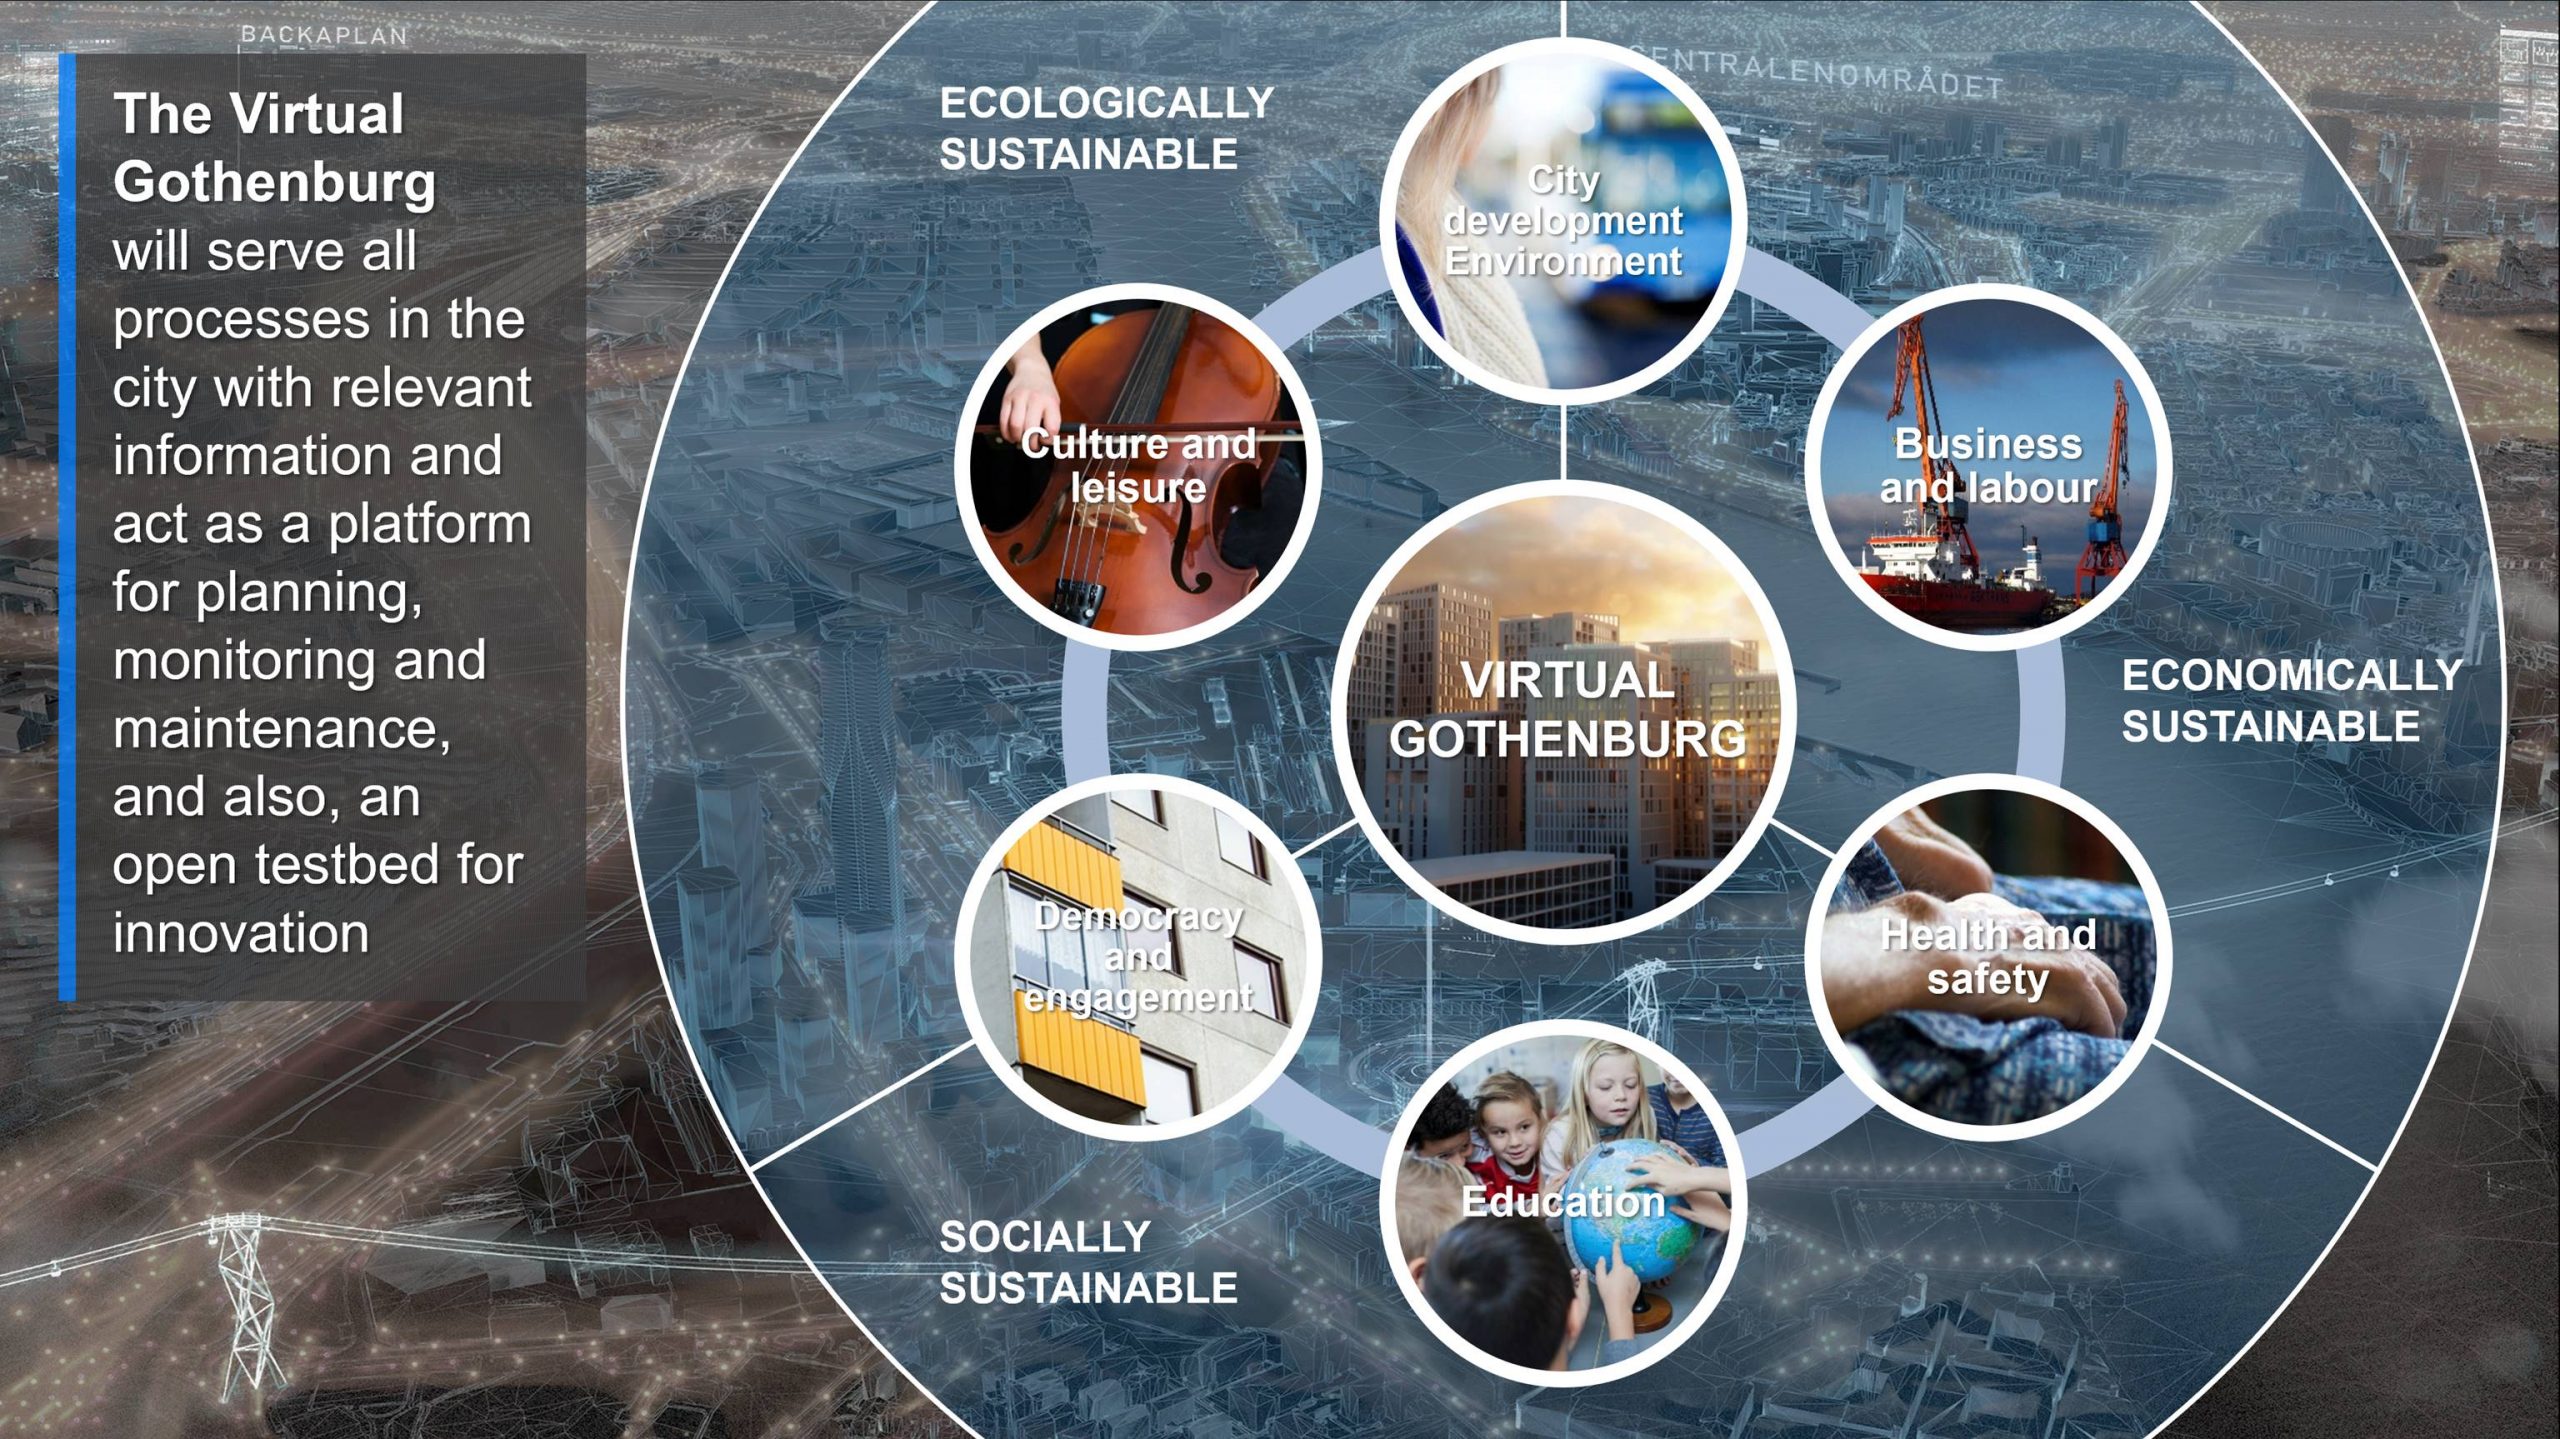
“Virtual Gothenburg” will incorporate ecologically, economically and socially sustainable data and act as a platform for planning, monitoring and maintenance as well as serving as an open testbed for innovation.
So technically, how does this work?
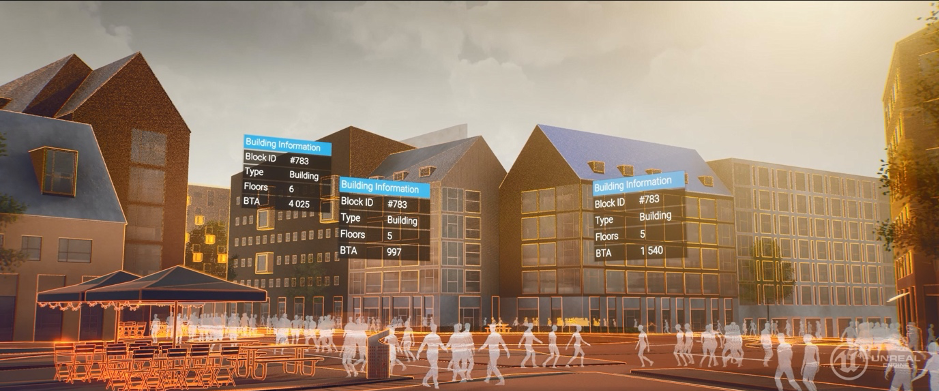
Western Sweden invests 10 million euro in digital twin technology with contributions coming from the private, public and academic sectors.
Chalmers University was interested in researching the creation of a digital twin using Epic Games’ Unreal Engine and the city of Gothenburg served as the perfect base for this research.
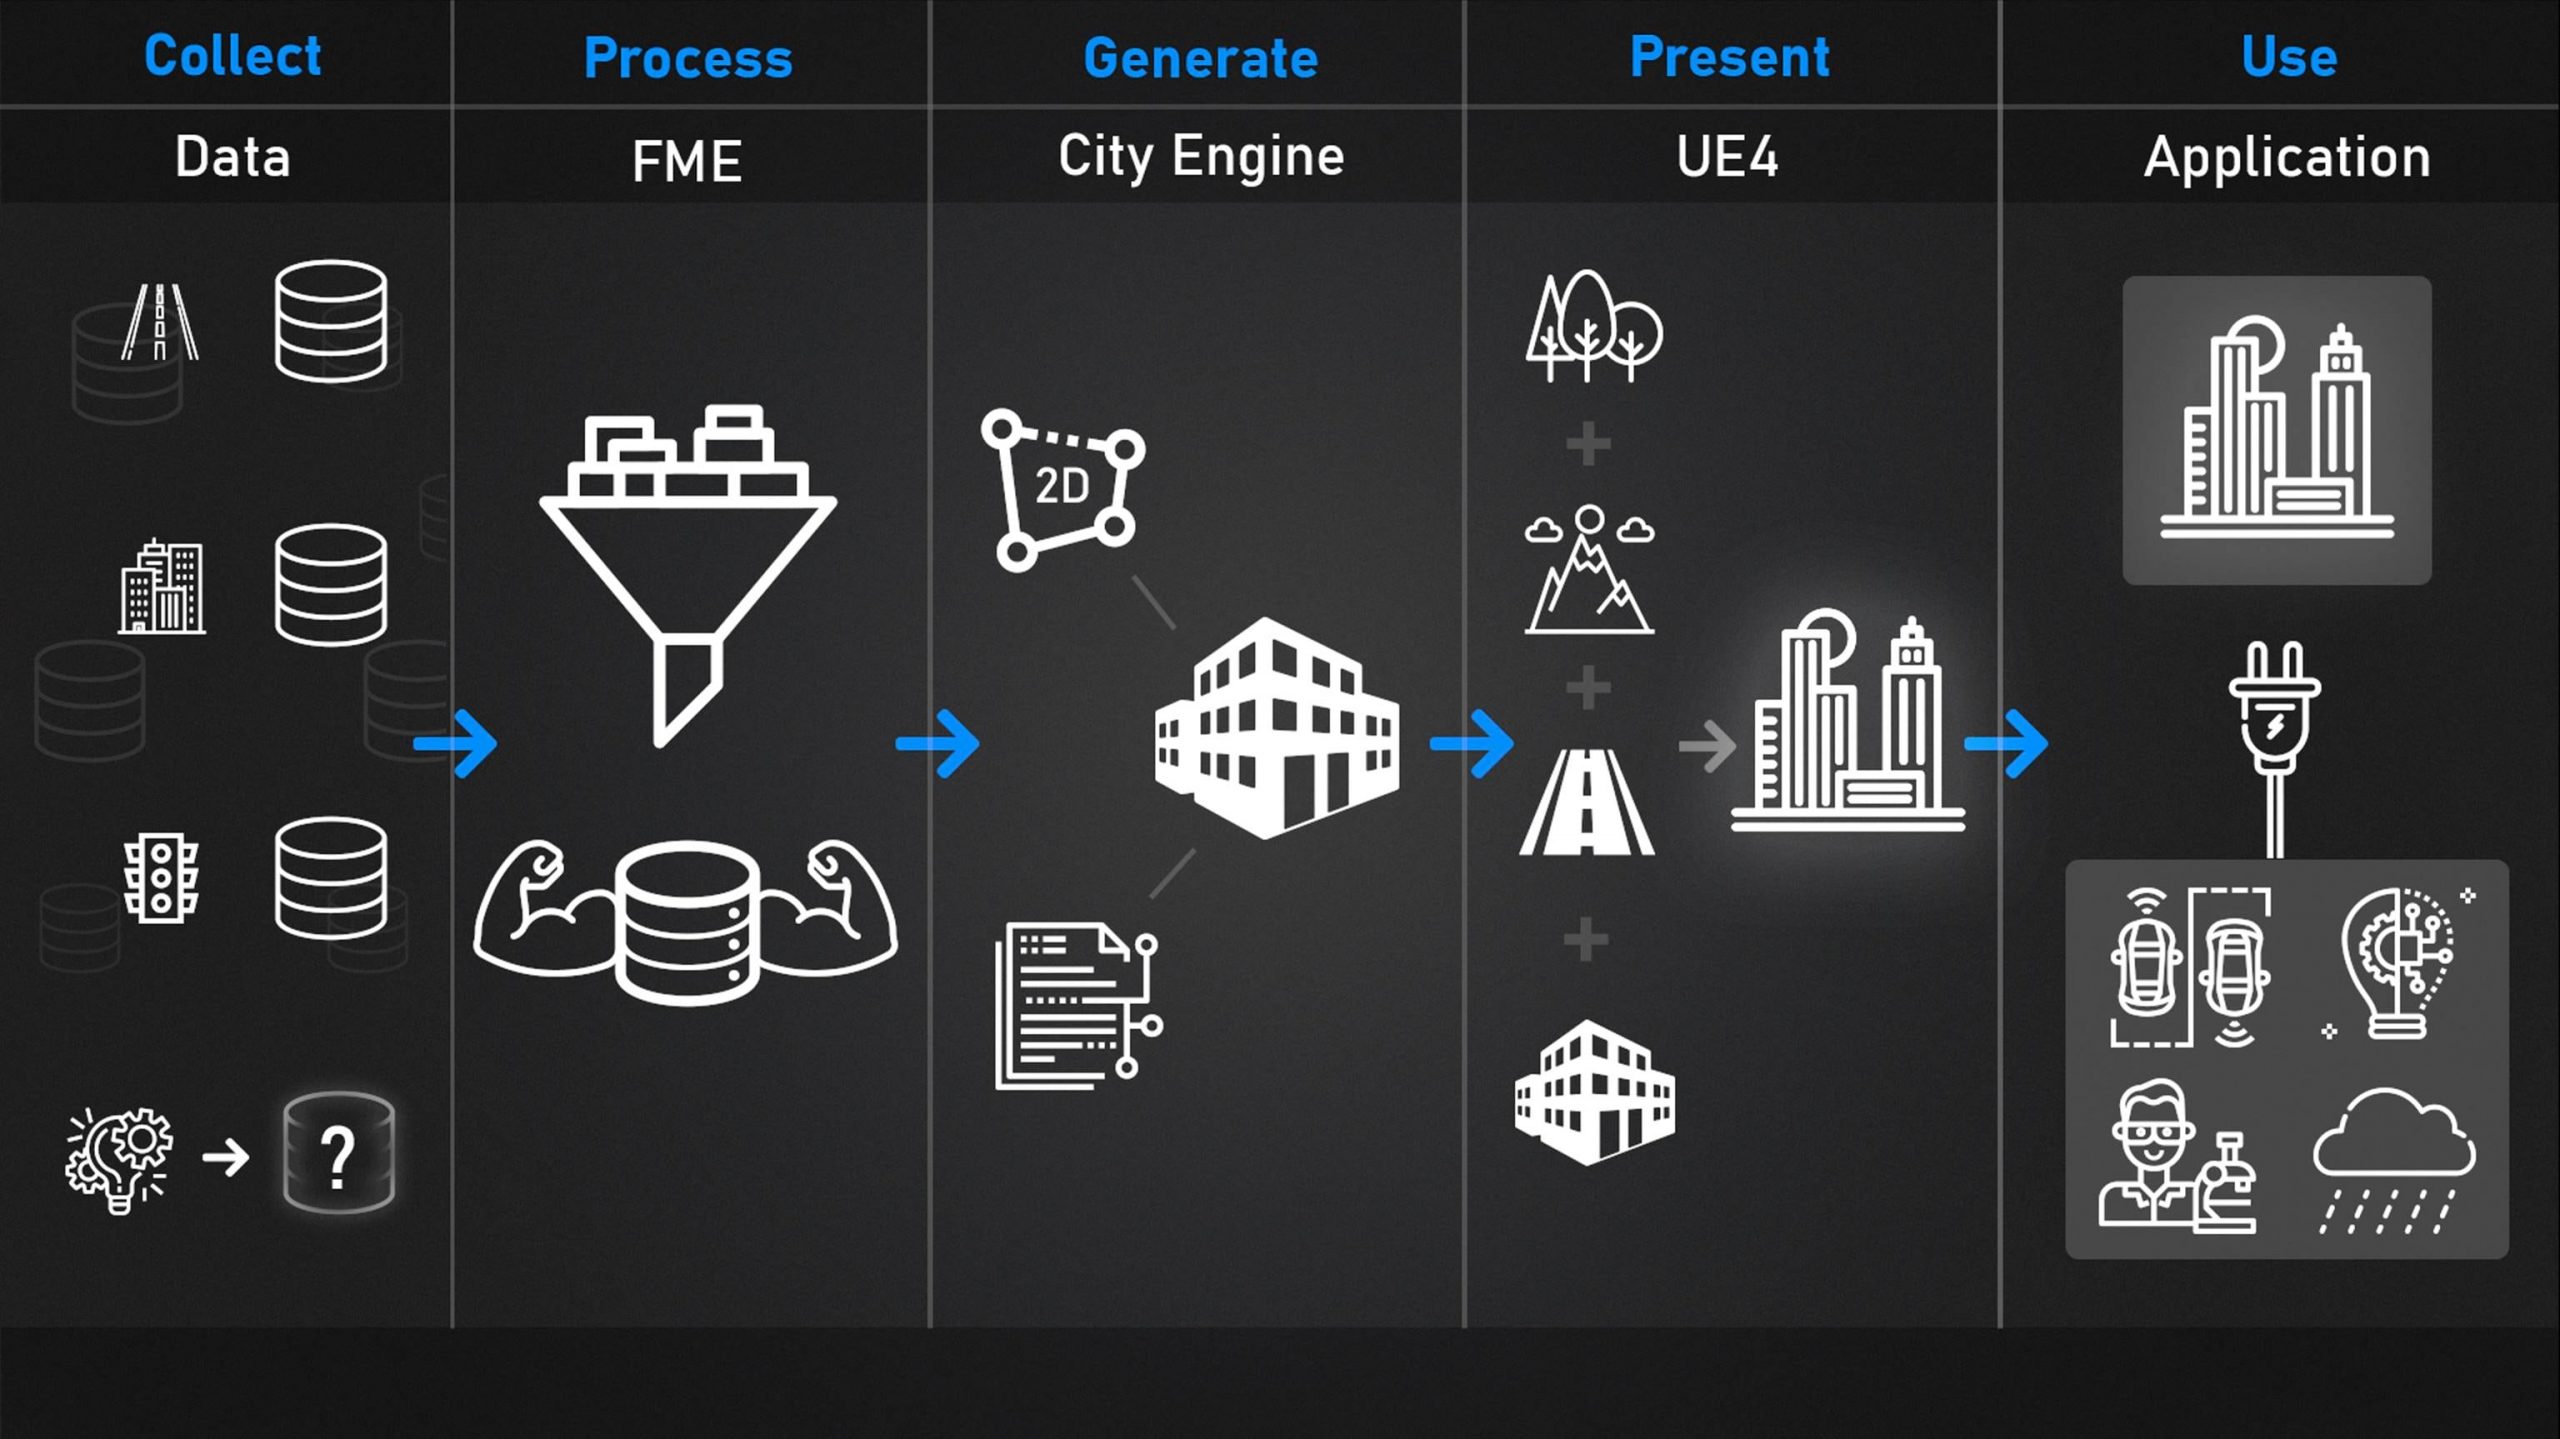
First up, to get started, we need data and lots of it and so this data of course needs to be collected.
Data is scattered all over the city and comes from a variety of sources. Some organizations have the roads, some have the traffic lights and some data does not even exist yet.
For example, there was no database covering the rooftop materials, so for the “Virtual Gothenburg” project, this data set was built using orthographic imagery and an AI that looks at all the different rooftops and calculates what kind of materials can be used to visually represent them.
The next step is to process the data into a database that can be controlled.
This dataset then is brought into CityEngine to generate the city procedurally.
As hopefully most of you know by now, CityEngine model generation can be controlled via parameters and attributes like: number of floors, what kind of windows a building has, the year of construction etc., so if you have a dataset with these kinds of parameters, then this can be modelled in CityEngine.
Once these models are generated in CityEngine, they are imported into Epic Games’ Unreal Engine (UE4). In UE4 you can add collision boxes, different levels of detail (LOD’s) etc. which are necessary to put everything together to create a virtual version of the city in real-time. This can then be run as an application and in turn allow for new types of data to be fed into the model.
How is all this even manageable?
The city of Gothenburg’s digital twin spans an area of 700km2 – which is a generally pretty big area! In order to make this manageable, “Virtual Gothenburg” essentially splits the map up into a grid (using Unreal Engine’s “World Composition”) so that you end up with a whole lot of tiles with a dimension of 1km x 1km.
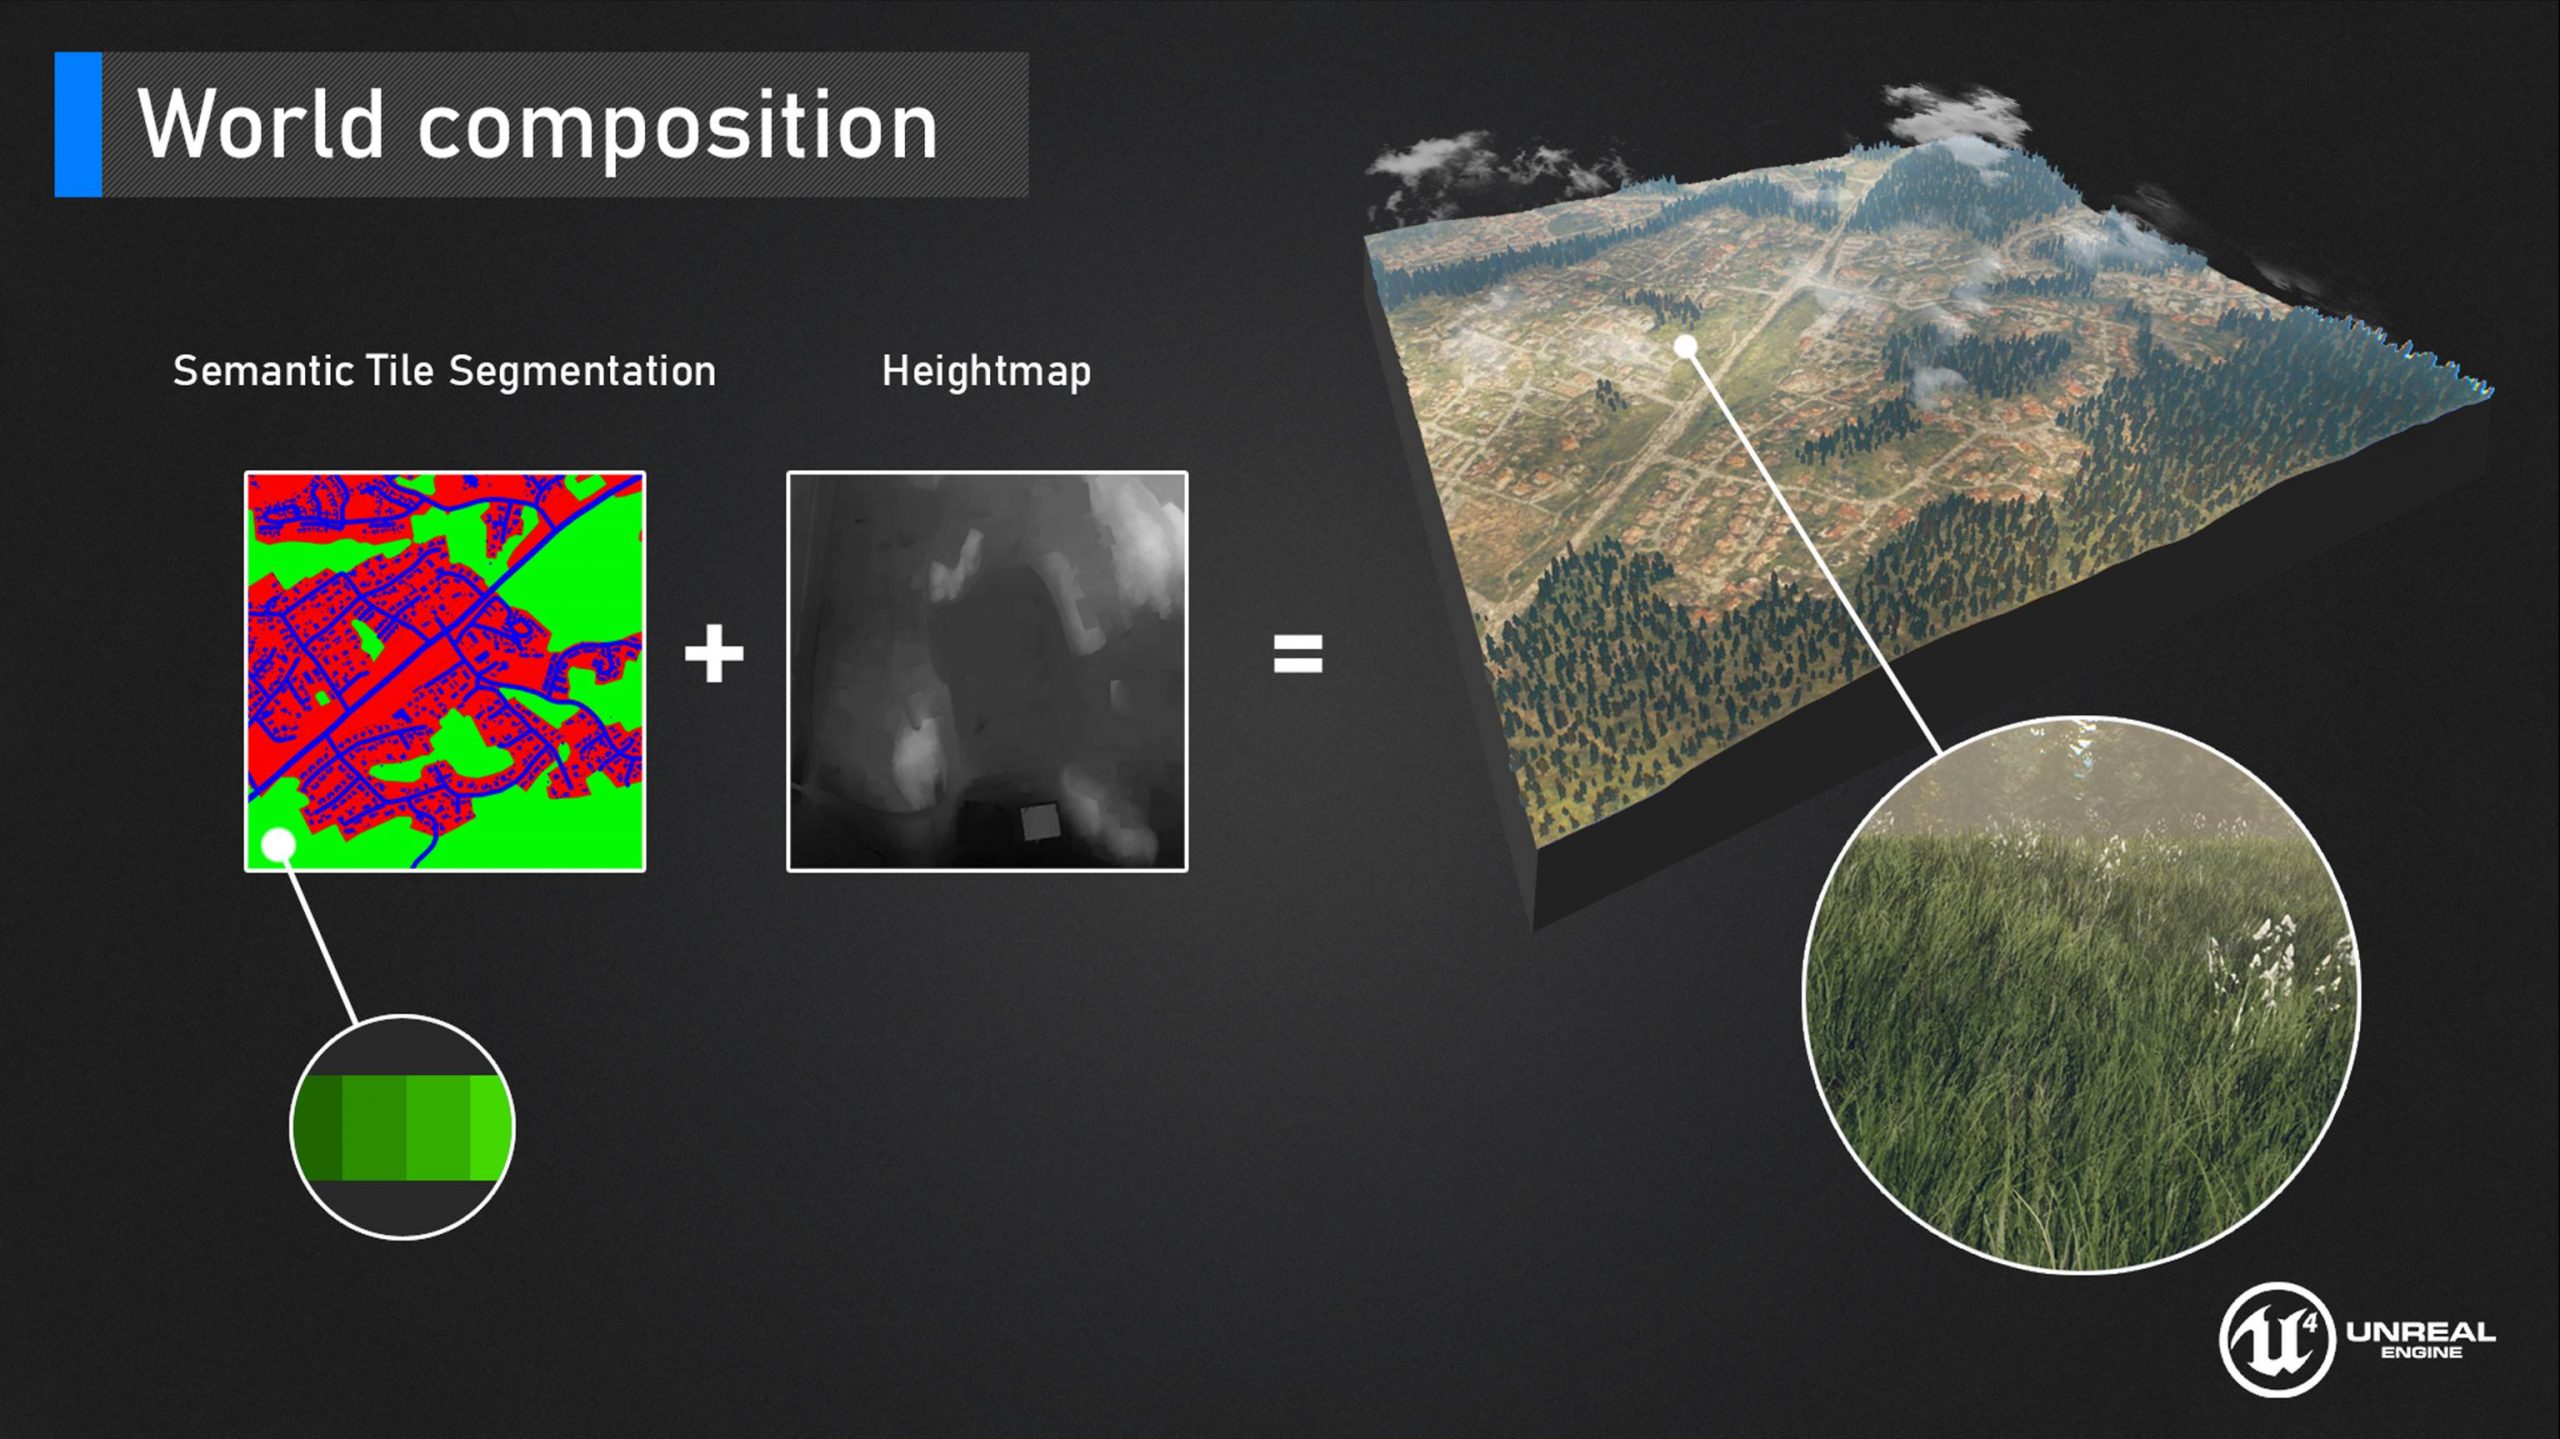
The colorful tile image you see in the figure above is “semantic tile segmentation”.
It’s precisely because these colors can be segmented, that this texture can contain thousands of data points.
Let’s look at this for a specific example.
In this example, one could define that a certain shade of green corresponds to an area where blueberries can be grown and a lighter green hue highlights an area where mushrooms might thrive.
Segmenting these colors is one thing, but this is all fairly useless if it can’t be backed by data – we need actual data (this means a database that contains mushroom and blueberry locations for Gothenburg) that can be attributed to this certain green hue for blueberries or mushrooms within this texture so that we can drive the environment.
As mentioned, we’re talking here about an area that is 700km2 in size, so not only is this a large surface, but “Virtual Gothenburg” needs to work at different levels of detail too…ergo, this whole project is a huge undertaking.
The crux of it all though, is that projects like this can (and will!) make a huge impact with regards to sustainability and resiliency in cities not just now, but perhaps even more importantly, in the future to help prepare us for what’s to come.



Article Discussion: