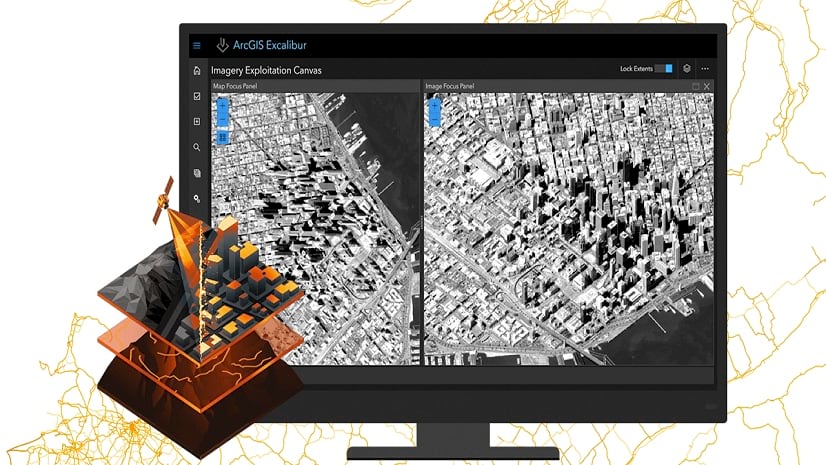
ArcGIS Excalibur transforms the way analysts search, discover, and work with imagery — all in a single web-based application. Excalibur modernizes and enhances image-based workflows by unifying traditionally separate geospatial and imagery-based views into a single integrated experience. With an easy-to-use, web-based experience, Excalibur has the power to improve daily decision-making across organizations.
Have you ever found that collecting observations from imagery in a single geographic region is a time-consuming task? With the latest release, ArcGIS Excalibur has made it easier than ever to view observation metadata in the newly implemented feature table. Users can now quickly copy or edit existing observations and save the newly created observations in their system of record for downstream analysis. Let’s take a look at this workflow by walking through a few easy steps.
Step 1 – Access Imagery Projects
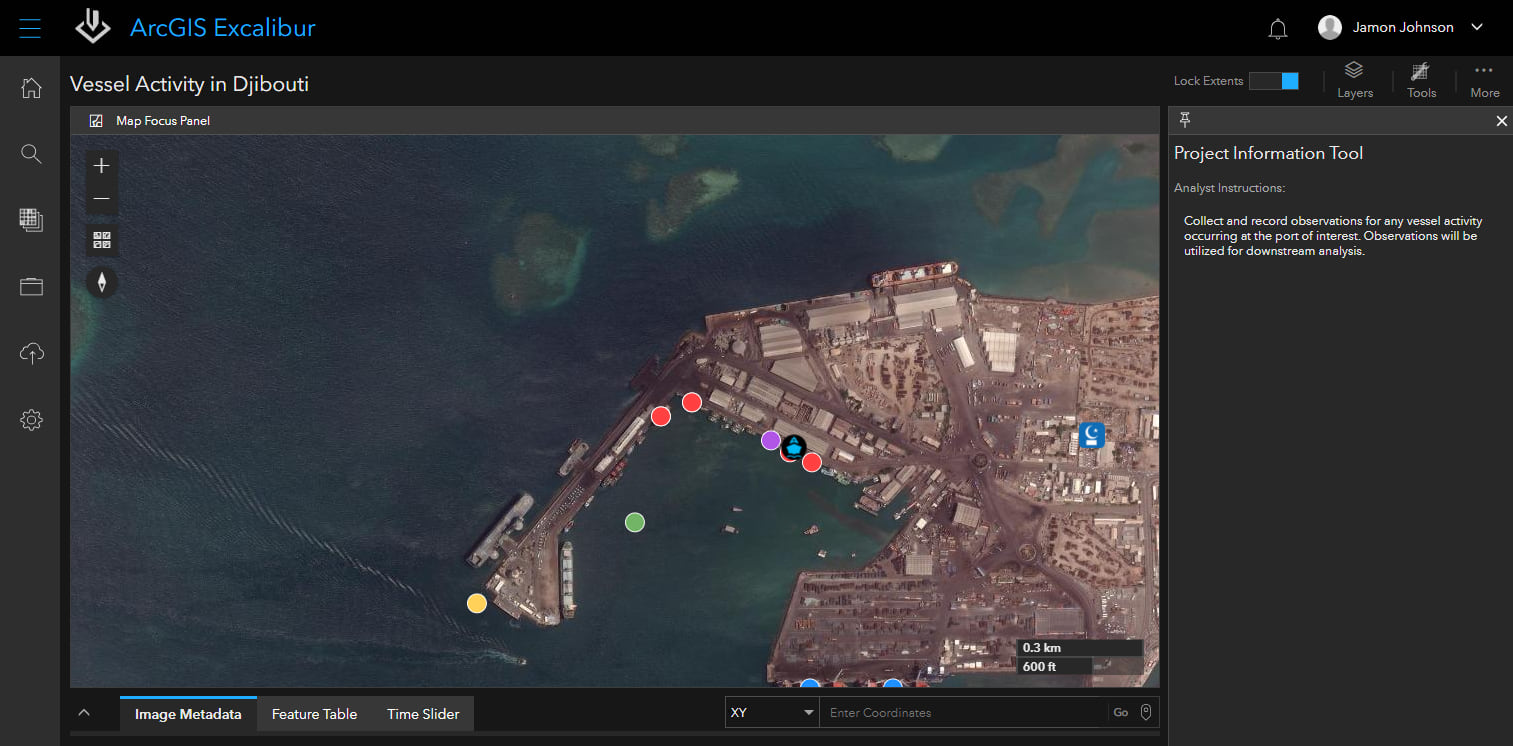
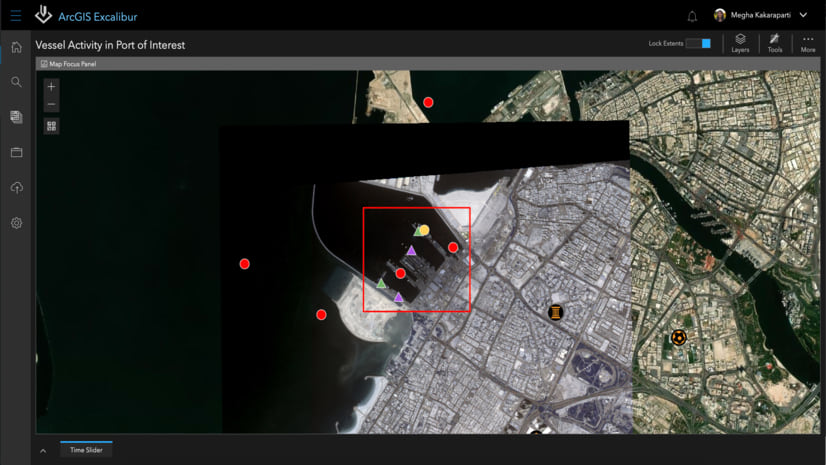
With a single click, a user can access an imagery project, a dynamic way to organize resources to complete an image-based task. The imagery project contains a set of instructions that provide details of what the user is being asked to perform. In our example below, upon opening the project, we can see that the instructions require us to collect and record observations for any vessel activity occurring at a port of interest in the vicinity of a specific geocoordinate (11 36 33.975466N 043 08 02.185653E).
Step 2 – Go to the Area of Interest
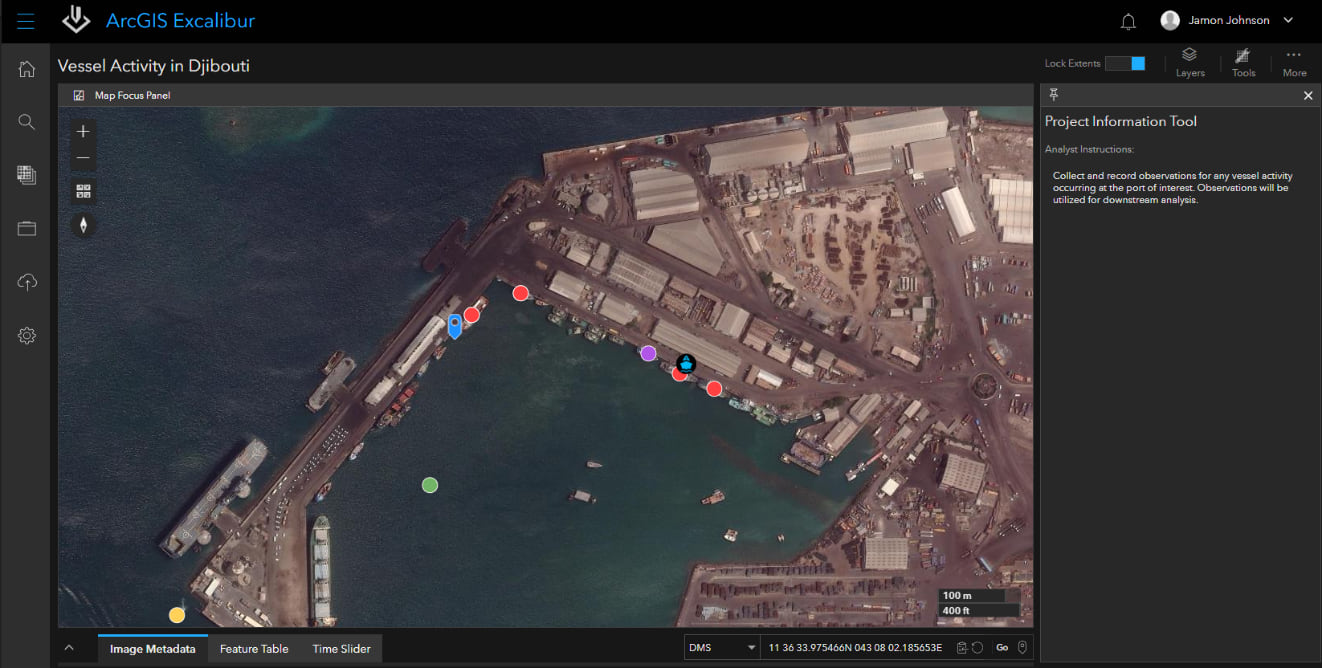
The new Go-to Coordinate tool enables users to quickly navigate to a specific location on an image or map by inputting a geocoordinate in the input field located at the bottom right of the imagery canvas.
TIP: Users can change the coordinate format using the dropdown arrow,
copy the coordinate information to the system clipboard, or capture
coordinate information from the image or map.
After navigating to the point of interest on the image, we can begin collecting and recording observations for any vessel activity.
Step 3 – Copy and View Observation Metadata
In addition to collecting new observations, it is important to report on existing observations, especially if activity status remains the same from day-to-day.
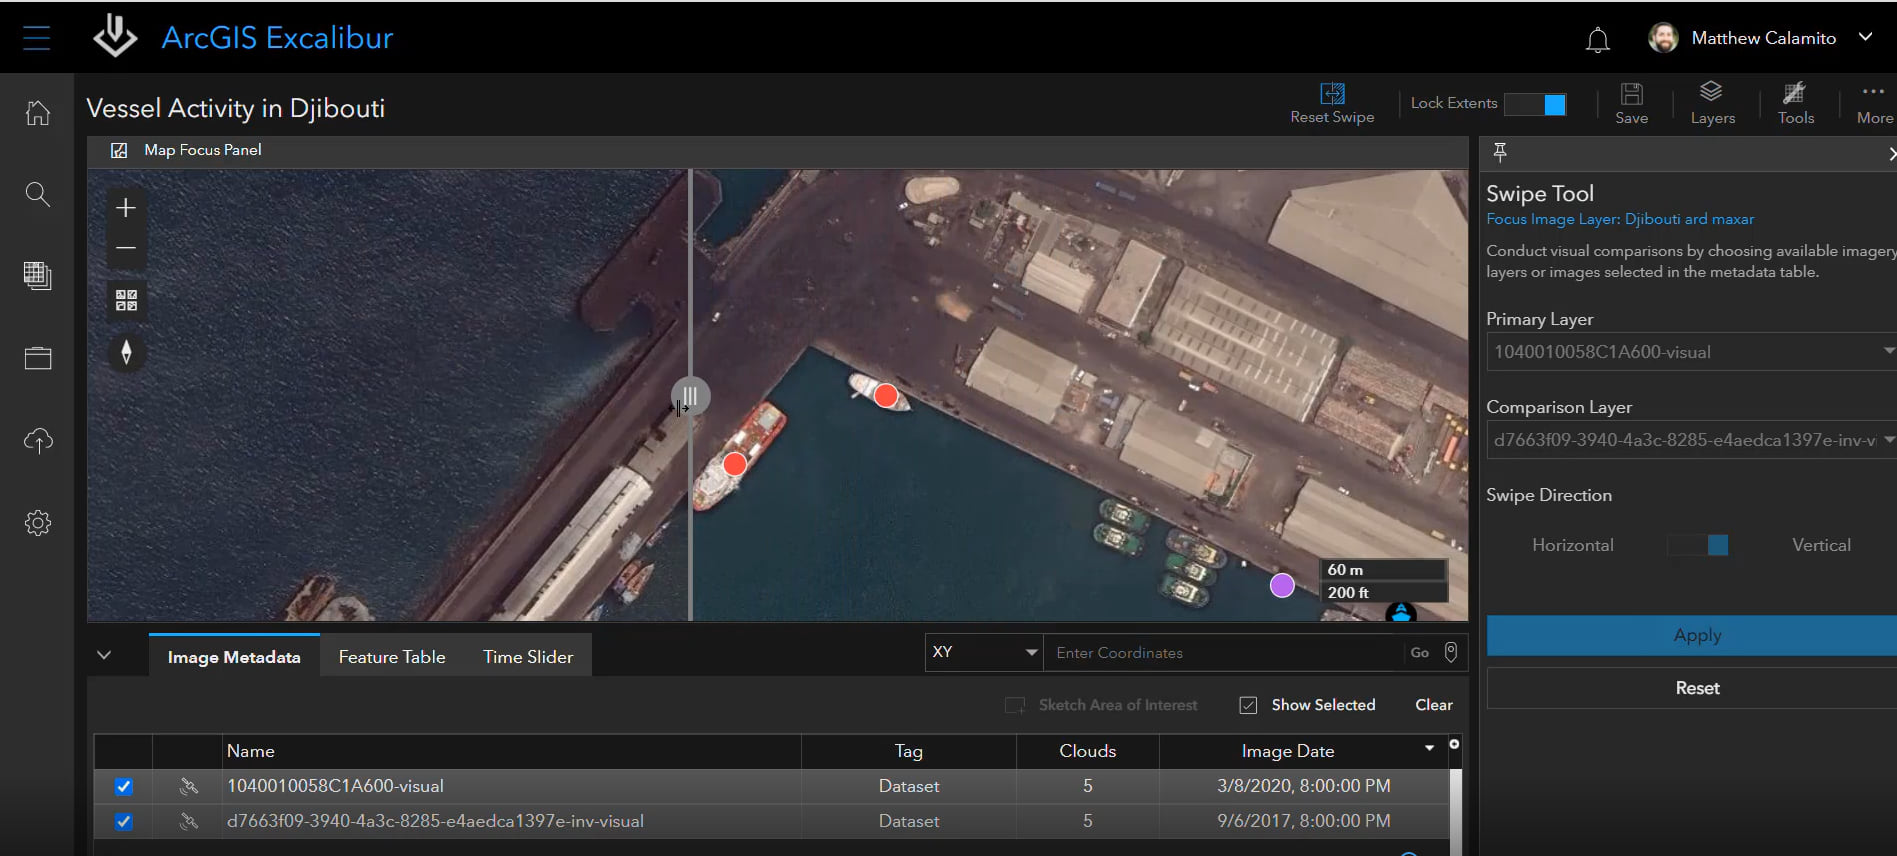
Prior to reporting on existing observations, we can use the Swipe Tool to compare images to identify changes that may or may not have occurred. In this example, using previously collected imagery, we observed two vessels. The most recent imagery below confirms that those two vessels remained docked.
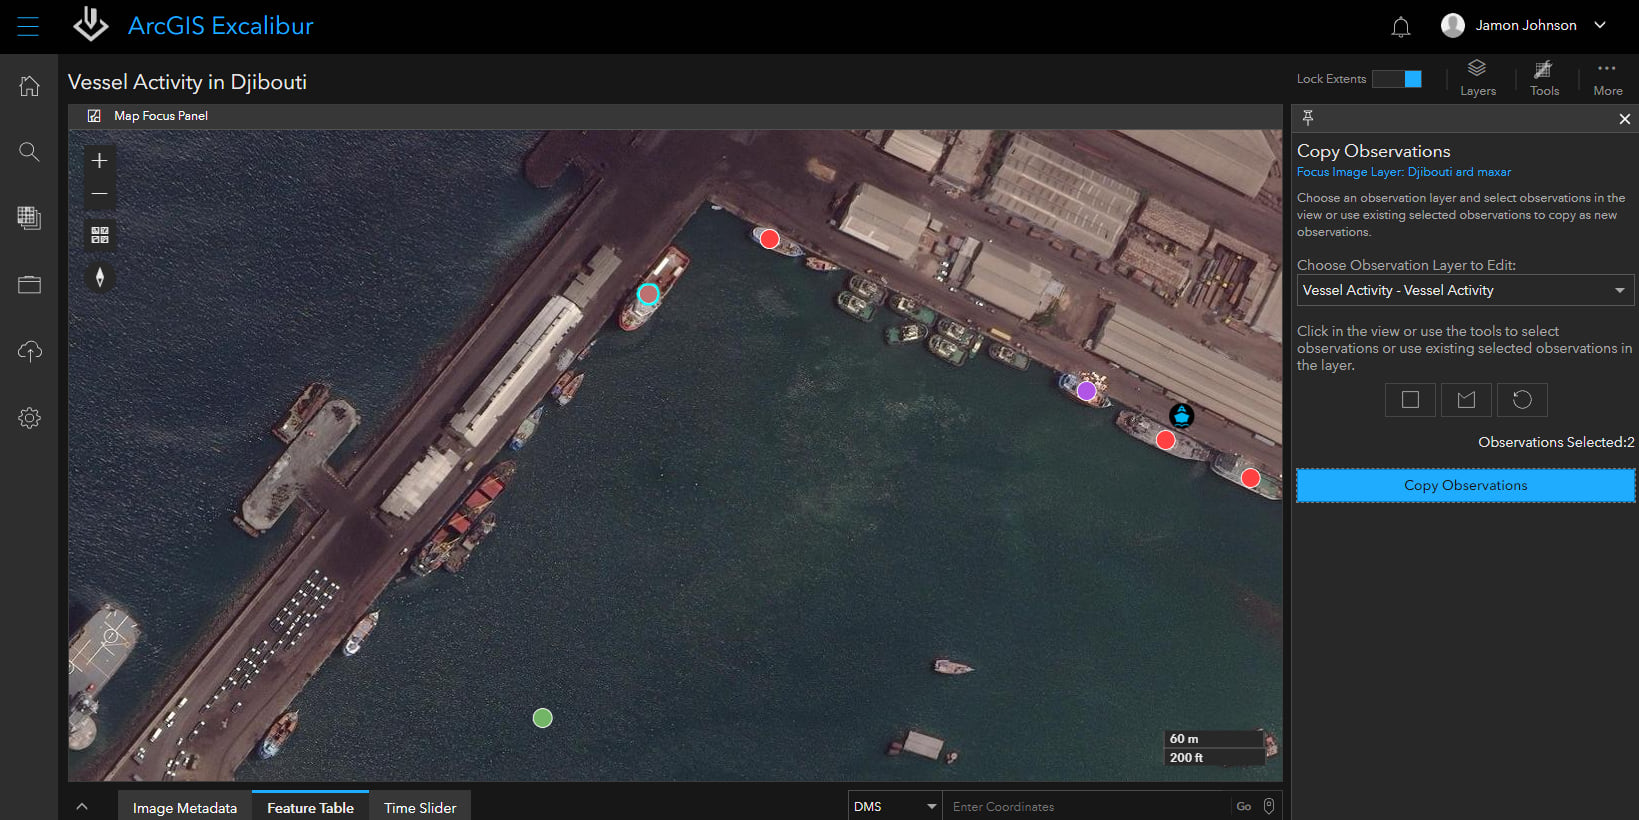
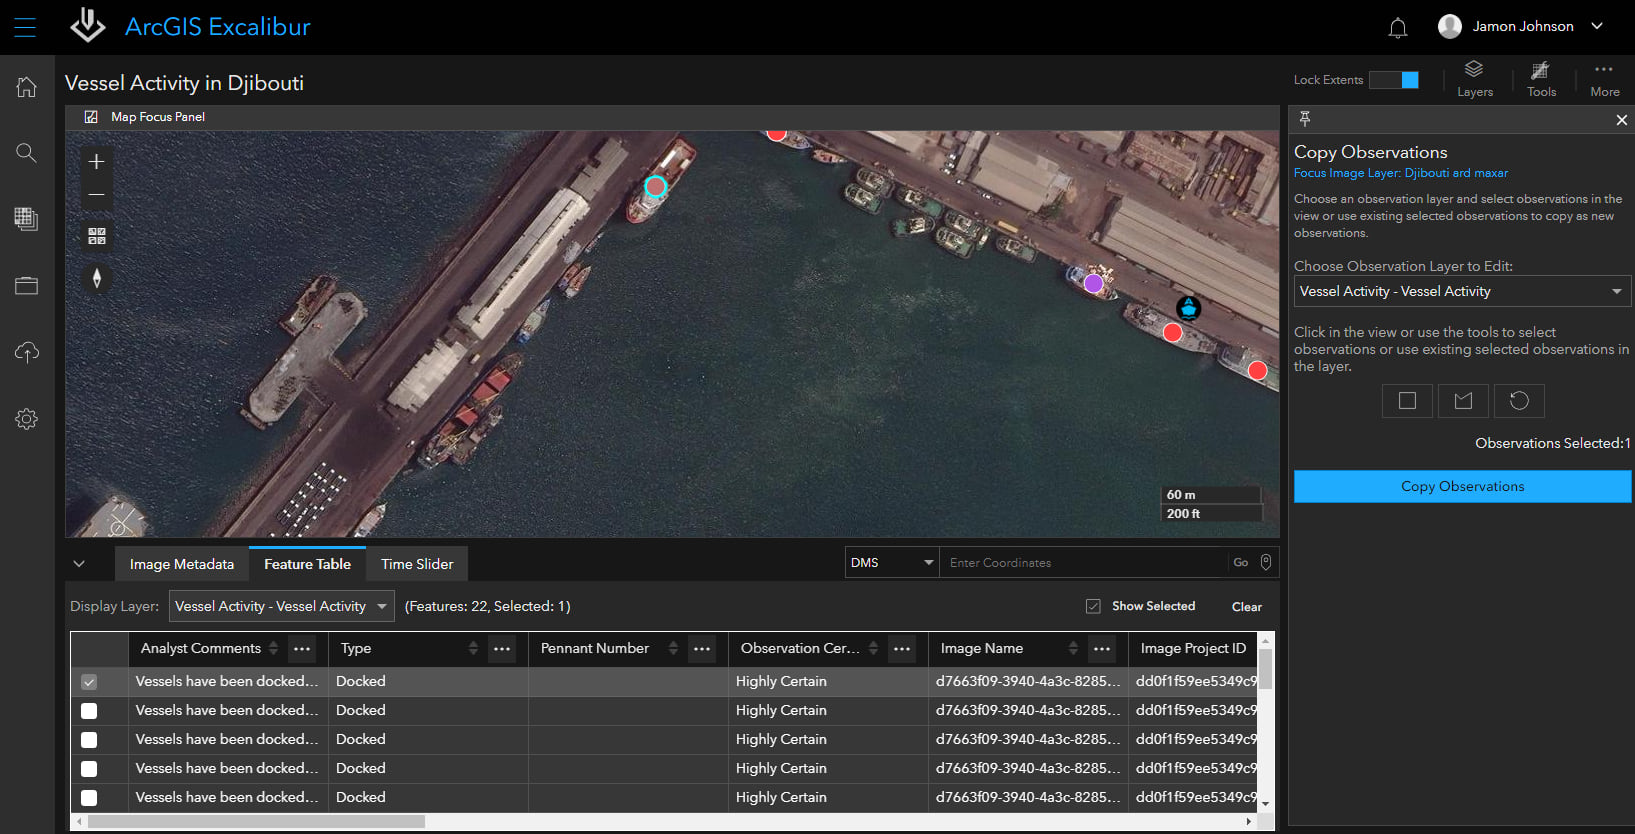
The Copy Observation Tool, added in the May release, enables a user to copy previously collected observations as new observations. This creates an exact clone where all image metadata and analyst information from the underlying image is updated within the feature, as depicted below. From here, we can quickly update these observations with a few comments by using the Batch Edit tool. In this instance, we will add a brief comment that the vessels are still observed as being docked.
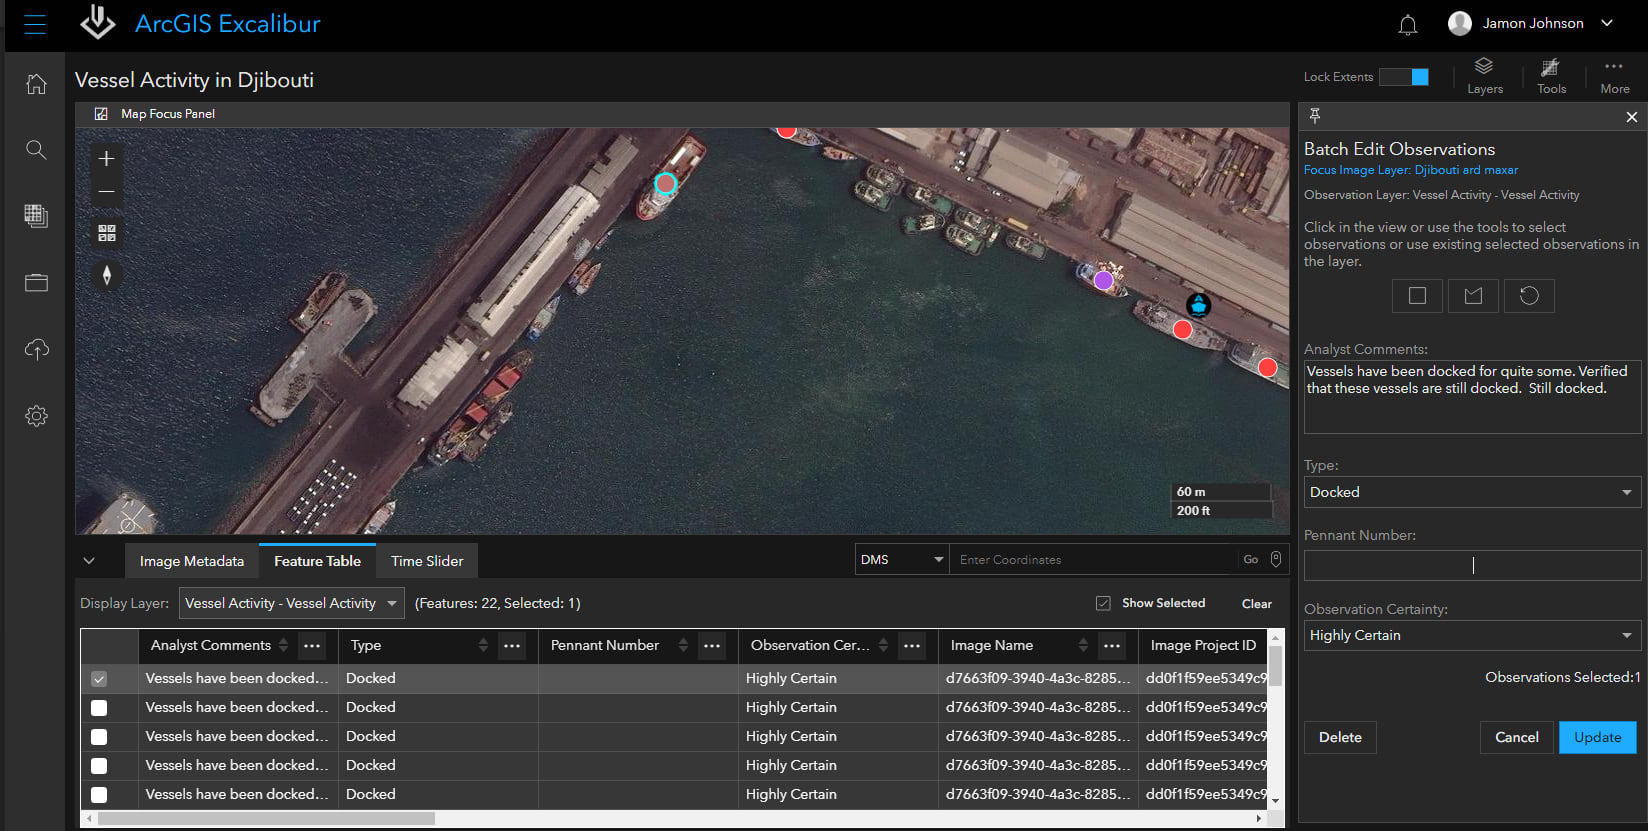
To gain an even better understanding of the newly created observations, we can use the newly added Feature Table capability to view the observation metadata.
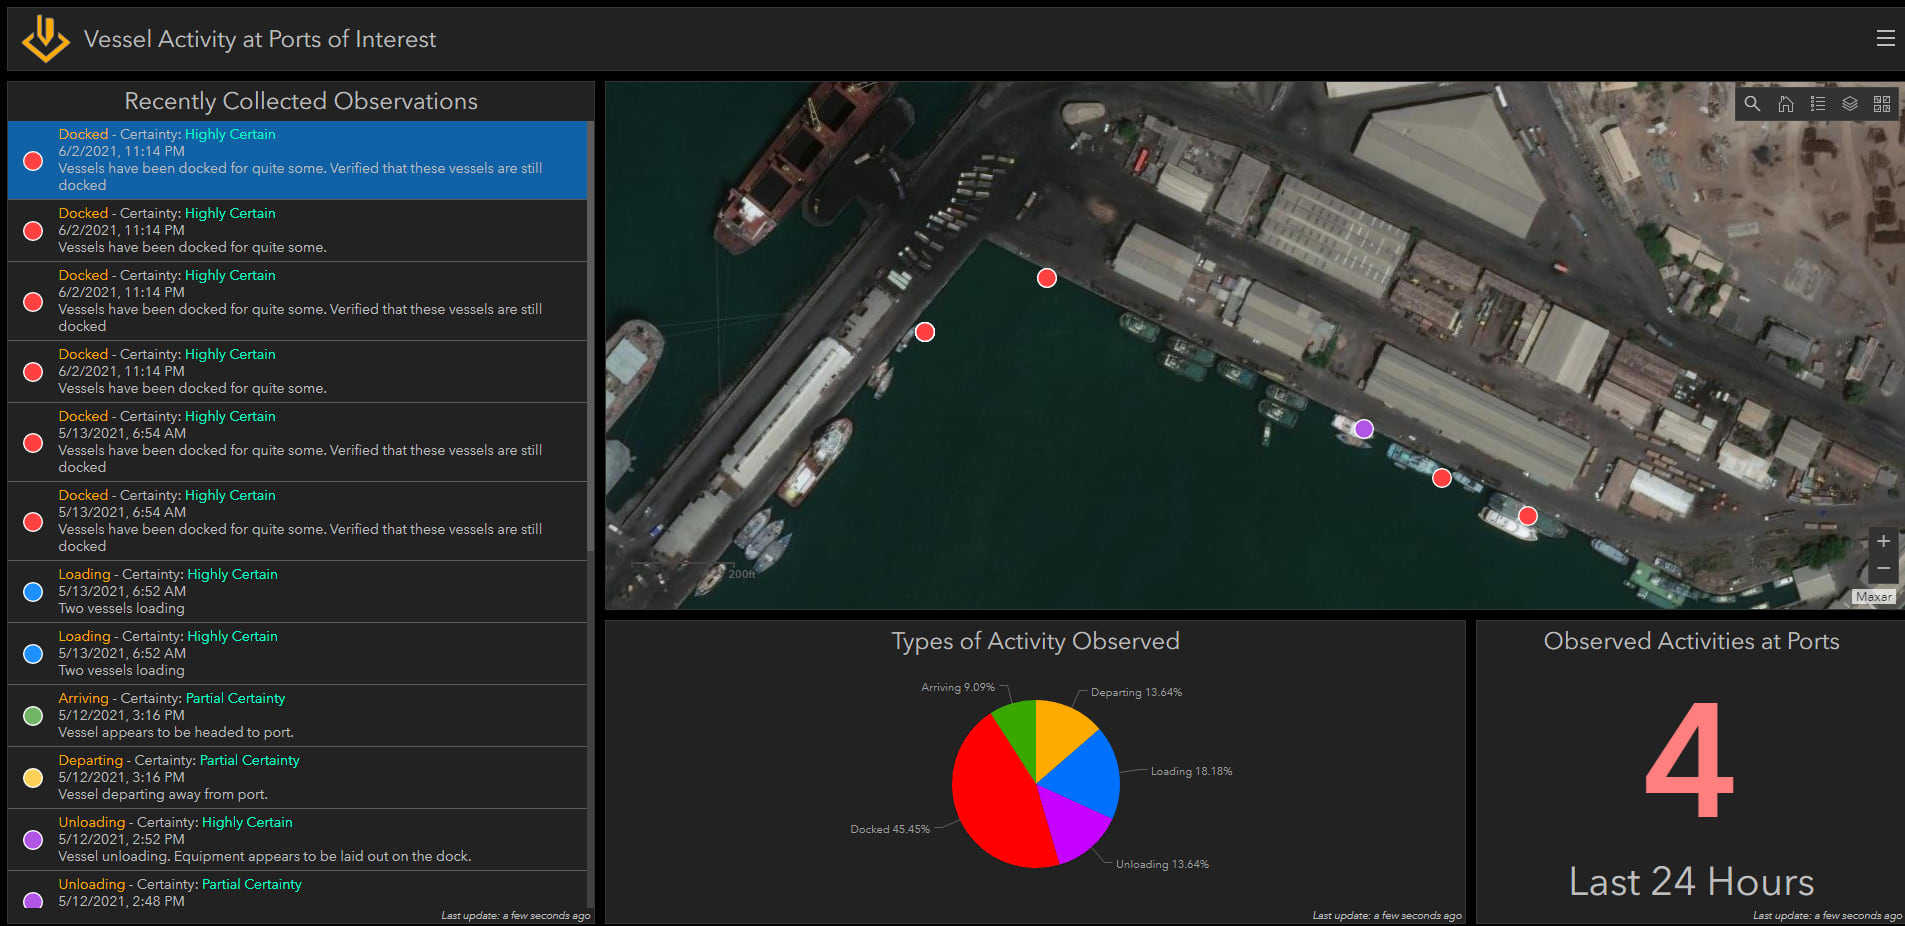
Step 4 – Observation Dashboard
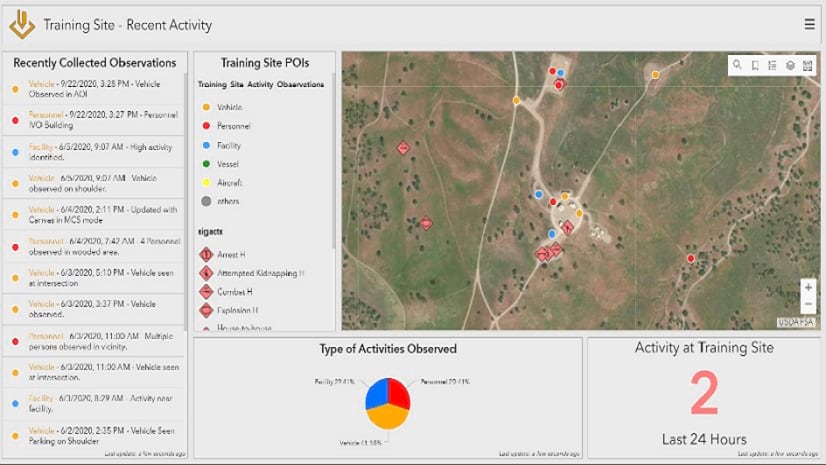
To wrap up a project, organizations can immediately see what observations were collected or edited in near real-time for utilization in downstream analysis with an ArcGIS Dashboard. This is just one example of how information produced in Excalibur can then be utilized throughout the ArcGIS system.
Stay in the Know
ArcGIS Excalibur continues to transform imagery workflows with constant improvements in response to customer input, building on the capabilities of ArcGIS. To learn more about Excalibur and add it to your organization’s ArcGIS Enterprise deployment, get in touch with an Esri representative at go.esri.com/excalibur, visit the Esri Community page, and explore our YouTube Playlist.


Article Discussion: