The networks that power our modern lives require advanced tools for monitoring, analysis, and decision-making. Spreadsheets and charts may struggle to capture the multidimensional nature of the underlying infrastructure.
Instead, gain a unique perspective on complex utility systems using the Elevation Profile widget in ArcGIS Experience Builder.
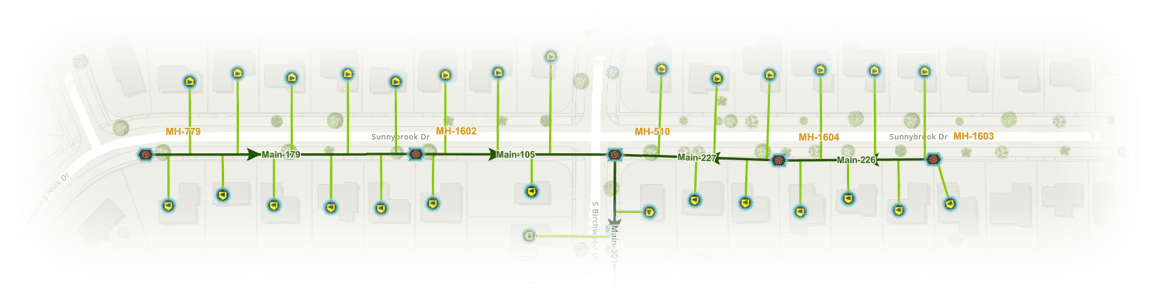
In the Underground Profile Viewer application below, select Main lines to visualize underground wastewater assets.

Leverage the next-selectable options and intersecting functionality to preview the elevation of different assets relative to the Main line and the ground. This visualization can help better understand flow direction and quickly identify any discrepancies in your elevation attributes.

How to build this app
Follow the steps below to create a basic elevation profile viewer application for your network. Feel free to further customize the layout, themes, and content for your own app. You will need an ArcGIS organizational account with privileges to create content.
Create a new application
- Use your own web map with utility data or use the Wastewater Network Map sample from the example above.
- From the web map item details page, click Create Web App and choose Experience Builder.
- Find the Blank grid template and click Create.

Configure elevation profiles for the Mains layer
- From the Insert widget panel, find the Elevation profile widget, add it below the Map widget, and connect it to the Map.
- Update the Map Settings to enable Selectable Layers.
- Change the Profile rendering to Customize.
- Set the Mains layer to be selectable for generating an elevation profile.

- Click the Mains layer to customize Elevation Settings and Style.
- For the Elevation value, represent the Mains using two fields: Upstream Elevation and Downstream Elevation.
- Optionally, make changes to the Style.
- Use the Live View mode to select a Main on the map and view its underground elevation profile.

View Manholes intersecting with the Mains
- Update the Map Settings to enable Intersecting Layers.
- Choose the Manholes point layer as intersecting.
- For the Elevation value, choose to represent Manholes using two fields: Rim Elevation and Invert Elevation.
- Choose a Display Field for the Manholes in the graph.
- Optionally, make changes to the Style.
- In Live View mode, you can now view Manholes represented relative to the Main and the ground.

View Laterals intersecting with the Mains
The Z values for this layer are incorrect and there is no elevation attribute field. It is safe to assume that all Laterals are attached to the Mains and can be represented at an elevation matching the Main lines.
- From the Map Settings, under Intersecting Layers, choose the Laterals line layer.
- For the Elevation value, choose Match Profile.
- Choose a Display Field for the Laterals in the graph.
- Optionally, make changes to the Style.
- In Live View mode, you can now see intersecting Laterals relative to the Main and the ground.

Display a list of Mains
There are different ways to select features to generate an elevation profile. Provide a list of all the Mains so users can quickly find the Main they are looking for.
- From the Insert widget panel, find the List widget and add it to the left of the Elevation Profile widget, below the Map widget.
- Connect the List widget to the Mains layer from the map.
- Configure the Dynamic text content to show the Asset ID.
- Optionally, configure the Image to display the Dynamic Symbol from the map.

Next, configure actions in the List widget to view the elevation profile when a Main is selected:
- From the Action panel, disable Data action to remove this option.
- Under Message action, click Add a trigger and choose Record selection changes. Select the Map widget as a target and set the action to Zoom to.
- Add another action and select the Elevation Profile widget as the target. Set the action to Select line.

Save your app and click Preview to launch it in a new tab. Select a Main from the list to view its underground profile and intersecting assets.

Export the results to get detailed elevation and distance attributes for each profile.

You can further customize your application with data-driven dynamic text and charts to gain further insights into your utility data.


Article Discussion: