What do traffic collisions, clothing purchases, and lightning strikes all have in common? They are examples of events that can be observed and recorded over time. Records of events like these can help organizations gain a better understanding of the past so that they’re better prepared for the future. Often that understanding comes from looking at lots of observations over time to find spatial and temporal patterns.
One way to discover spatial patterns is by clustering observations to find dense groups of events in surrounding noise. The initial release of the Find Point Clusters tool in GeoAnalytics Server and GeoAnalytics Desktop was meant for just this, offering two algorithms that spatially cluster point observations. However, we know that in some cases it’s not just the location of an event that matters but also when it happened. That’s why we’ve added support for spatiotemporal clustering with the release of ArcGIS Pro 2.5 and ArcGIS Enterprise 10.8. Now you can use Find Point Clusters to discover patterns in both time and space.
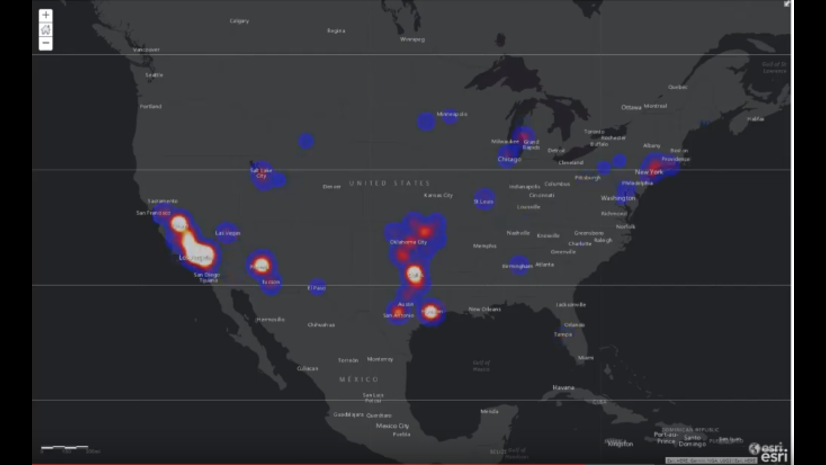
As an example, let’s look at a dataset of lightning strike observations from July 2017. Say that I work for an electric utility and I want to find clusters of strikes that intersect with transmission lines. Clusters can help highlight areas where more lightning strikes have occurred and where it’s more likely that a transmission tower has been damaged. By finding these areas I can prioritize where to send crews for inspections to avoid an outage.

I could use spatial clustering to see where there have been more strikes than surrounding areas, but what if I’m also interested in when there were more strikes? Spatiotemporal clustering will show me clusters of lighting strikes in both space and time so that I can find clusters within each storm system that moves through the area.
Because I’m only working with about 500,000 points in this example, I’ll use the GeoAnalyics Desktop Find Point Clusters tool on my 8 core, 16 GB machine. If I wanted to work with a much larger dataset I could deploy a GeoAnalytics Server with more cores and perform the same analysis (for more on GeoAnalytics Server vs. GeoAnalytics Desktop, check out this blog post). When I ran the tool in ArcGIS Pro with the parameters shown below it took 1 minute and 40 seconds to complete.

Find Point Clusters uses the DBSCAN algorithm to find spatiotemporal clusters. DBSCAN requires three parameters when using time: the minimum number of points to form a cluster, a search distance, and a search duration. The latter two are the maximum distance and duration that the algorithm will travel from a point to search for the minimum number of points that can form a cluster. If the minimum number of points is found (I chose 10), those points become the start of a cluster which can grow as more points are discovered (for more info, check out this documentation on how density-based clustering works). For this example I chose 1000 feet and 6 hours as a significantly small area and duration to find at least 10 lightning strikes in, but these parameters should always be chosen using knowledge of the specific industry and use case along with an understanding of the DBSCAN algorithm.

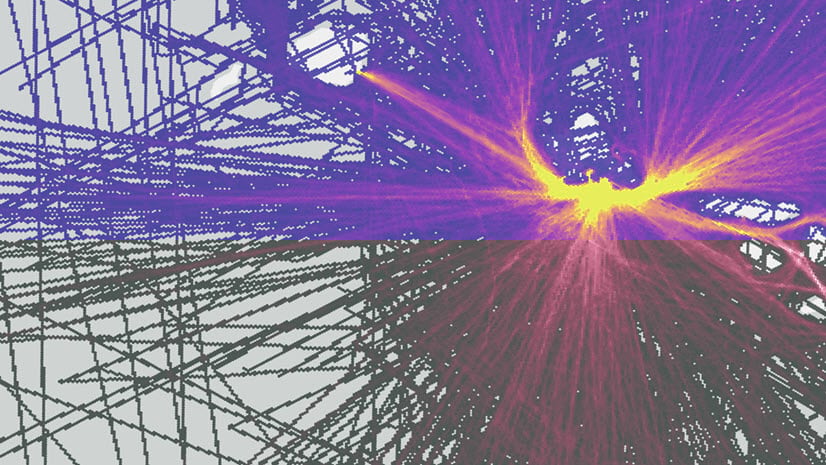
In the result, each cluster discovered is labeled with the start and end time of that cluster’s temporal extent, so I can use the time slider to visualize clusters over time. I can also disable time animation and view all clusters simultaneously.

This is just one example of how spatiotemporal clustering can be used to find patterns in historical observations. The same workflow could be applied to a wide variety of use cases, from public safety to telecommunications and more. Let us know in the comments below what kind of event data you have, and try clustering it yourself with the latest version of GeoAnalytics Server or GeoAnalytics Desktop tools.


Article Discussion: