ArcGIS GeoAnalytics Server comes with 25 tools at 10.7, but what if you want to run distributed analysis and the tool you need isn’t available? With this release, we on the GeoAnalytics team are excited to announce a new way of managing and analyzing your large datasets using a tool called Run Python Script.
As you might guess, Run Python Script executes code in a Python environment on your GeoAnalytics Server. So, what’s the excitement all about? This Python environment gives you access to Apache Spark, the engine that distributes data and analysis across the cores of each machine in a GeoAnalytics Server site. With Spark you can customize your analysis and extend your analysis capabilities by:
- Querying and summarizing your data using SQL
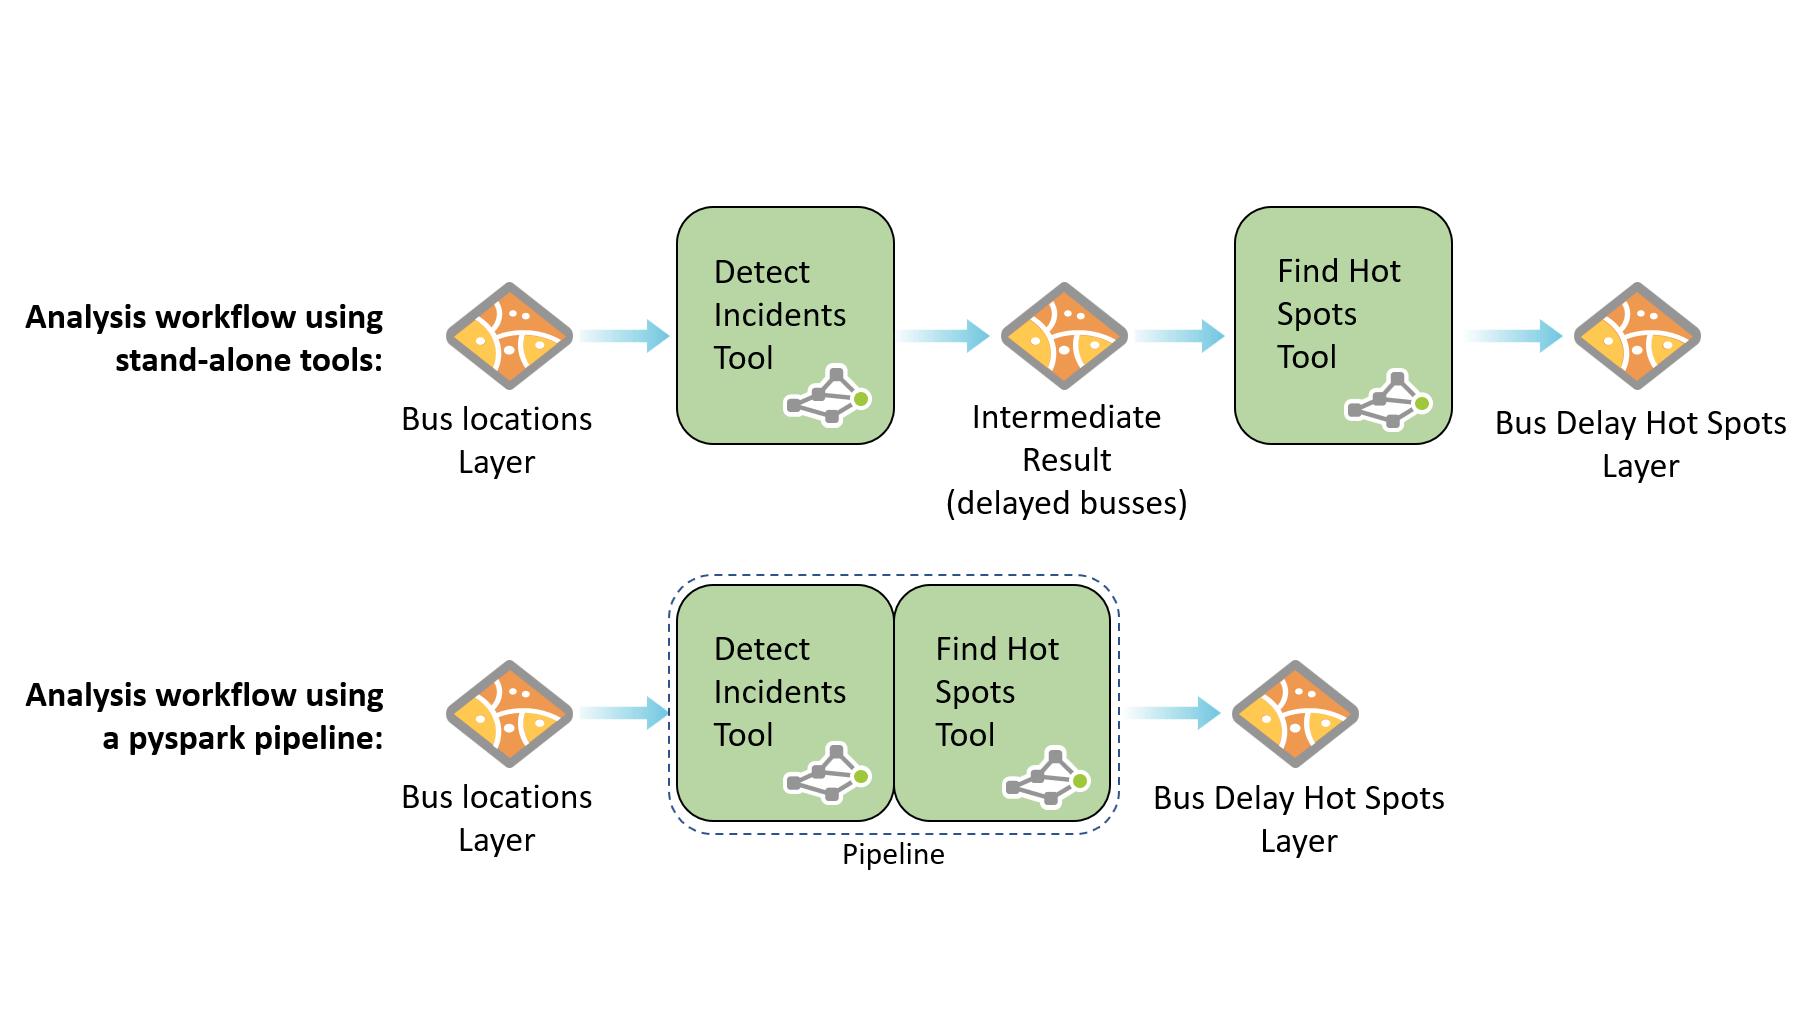
- Turning analysis workflows into pipelines of GeoAnalytics tools
- Classifying, clustering, or modeling non-spatial data with included machine learning libraries
All using the power of distributed compute! Just like other GeoAnalytics tools, this means that you can find answers in your large datasets much faster than other non-distributed tools.
The pyspark API provides an interface for working with Spark, and in this blog post we’d like to show you how easy it is to get started with pyspark and begin taking advantage of all it has to offer.
Explore and manage ArcGIS Enterprise layers as DataFrames
When using the pyspark API, data is often represented as Spark DataFrames. If you’re familiar with Pandas or R DataFrames, the Spark version is conceptually similar, but optimized for distributed data processing.
When you perform an operation on a DataFrame (such as running an SQL query) the source data will be distributed across the cores of your server site, meaning that you can work with large datasets much faster than using a non-distributed approach.
Run Python Script includes built-in support for loading ArcGIS Enterprise layers into Spark DataFrames, which means you can create a DataFrame from a feature service or big data file share with one line of code.
df = spark.read.format("webgis").load()
DataFrame operations can then be called to query the layer, update the schema, summarize columns, and more. Geometry and time info will be preserved in fields called $geometry and $time, so you can use them like any other column.
When you’re ready to write a layer back to ArcGIS Enterprise, all it takes is:
df.write.format(“webgis”).save()
and the result layer will be available as a feature service or a big data file share in your Portal. The pyspark API also supports writing to many types of locations external to ArcGIS Enterprise, allowing for the connection of GeoAnalytics to other big data solutions.
Create analysis pipelines with GeoAnalytics tools
The Run Python Script Python environment comes with a geoanalytics module which exposes most GeoAnalytics tools as pyspark methods. These methods accept DataFrames as input layers and return results as DataFrames as well, but nothing is written out to a data store until you call write() on the DataFrame.
This means that you can chain multiple GeoAnalytics tools together into a pipeline, which both reduces overall processing time and avoids creating unneeded intermediate layers in your data store. When working with large datasets these intermediate results could amount to 100’s of GB of data – but not with pyspark!
Check out this example script that chains together several GeoAnalytics tools into a single analysis pipeline.

Leverage distributed machine learning tools with pyspark.mllib
While the geoanalytics module offers powerful spatial analysis tools, the pyspark.mllib package includes dozens of non-spatial distributed tools for classification, prediction, clustering, and more.
Now that the pyspark.mllib package is exposed, you can create a Naïve Bayes classifier, perform multi-variate clustering with k-means, or build an isotonic regression model, all using the resources on your GeoAnalytics Server site.
These tools input and output DataFrames, which means you can chain them together with both GeoAnalytics tools and each other to create pipelines. While pyspark.mllib doesn’t have native support for spatial data, you can use GeoAnalytics to calculate tabular representations of spatial data and use that with pyspark.mllib.
For example, you could create a multi-variable grid with GeoAnalytics and use variables (like distance to nearest feature or attribute of nearest feature) as training data in a support vector machine, a method not available as a GeoAnalytics tool but exposed in the mllib package.
Check out this example of how one might integrate GeoAnalytics and pyspark.mllib.
Summary
We’re excited to see what you do with this new way of interrogating and analyzing your large data with GeoAnalytics Server. In addition to the samples linked-to above, be sure to check out this GitHub page I made with more samples and a utility for executing the Run Python Script tool via command line or Python.


Commenting is not enabled for this article.