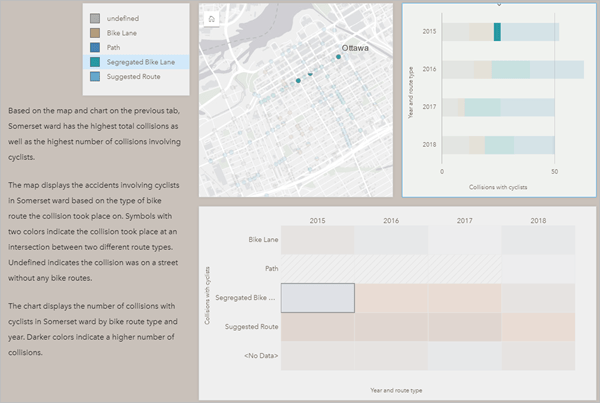
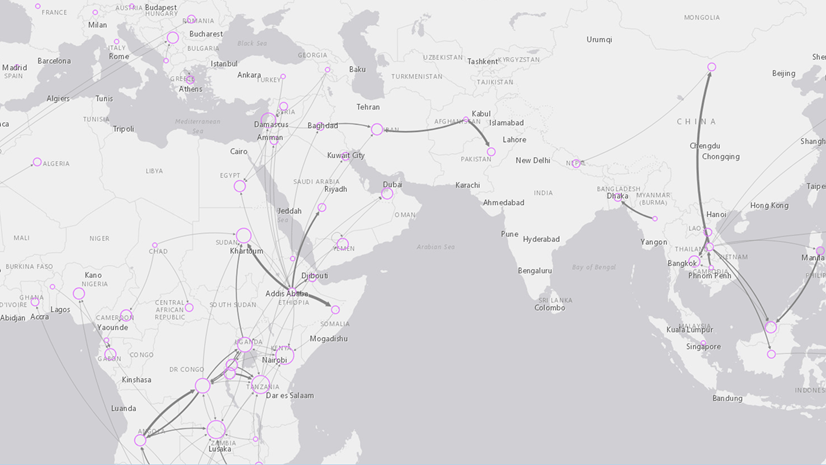
Insights reports are interactive, read-only versions of your analysis that can be customized and shared. The new Learn ArcGIS lesson, Create a report in ArcGIS Insights, builds on the analysis from Get started with ArcGIS Insights, where you analyzed traffic accidents involving cyclists in Ottawa, Canada. (Don’t worry if you haven’t done the Get Started lesson, you will be able to download a workbook with the analysis to use for your report.)
In this lesson, you will learn some basic cartographic and design principles and apply them to your report. Feel free to follow the lesson exactly, or use what you learn to personalize your report to your own style.

Platform: ArcGIS Insights*
Time: 50 minutes
Level: Beginner
*This lesson uses new functionality released in Insights 2020.2 (July 2020)


Article Discussion: